You are facing the challenge of effectively identifying trends in time series data? Then exponential smoothing is a method that can help you make more accurate predictions. In this guide, you will learn step by step how to perform exponential smoothing in Excel to analyze and visualize trends in data. Together we will experience how you can achieve meaningful results with minimal effort.
Main Insights
- Exponential smoothing allows for finer adjustment to trends in time series.
- Use a smoothing parameter (Alpha) of 0.15 for trend calculation.
- Calculate the fluctuation components and seasonal values for better analysis.
Step-by-Step Guide
Step 1: Prepare Data
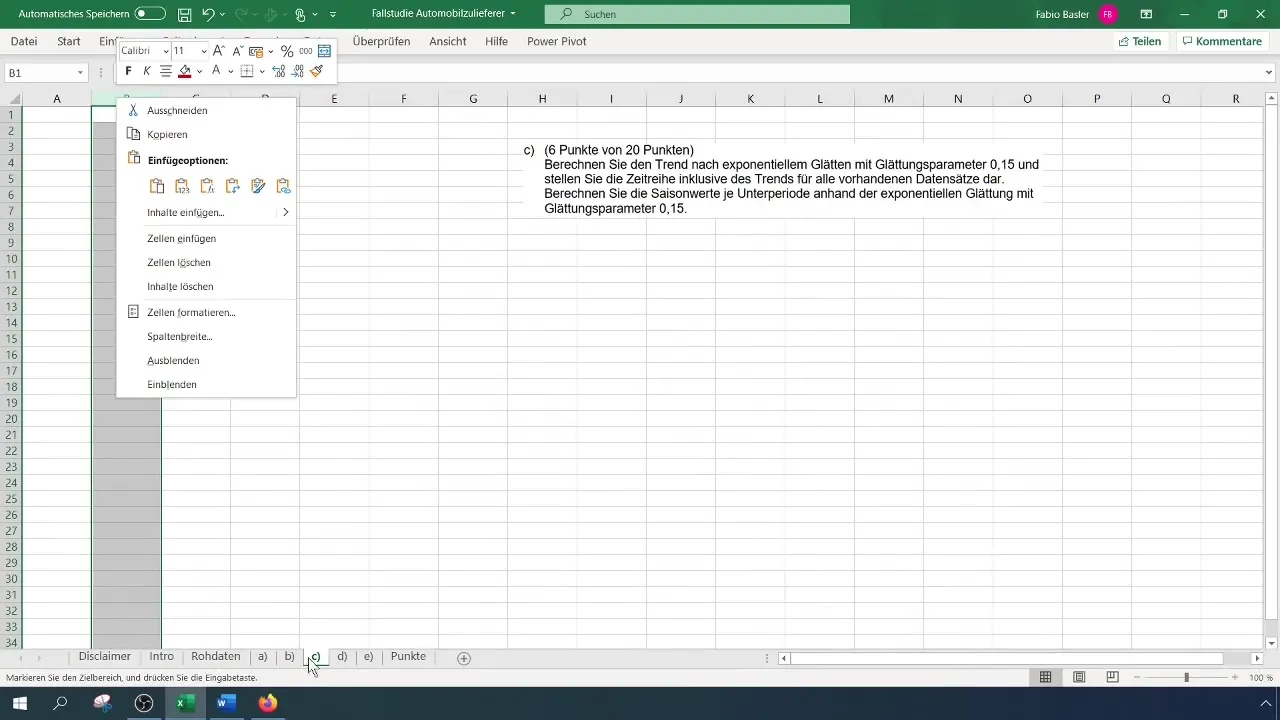
First, you need a table with the relevant data you want to analyze. You should enter the data in Excel with the date information and corresponding quantities in adjacent columns. Copy all necessary values, especially the transferable date information and quantities. These values are the basis for your analysis.
Step 2: Define Smoothing Parameter
Before starting with exponential smoothing, you need to define the smoothing parameter. This is usually a value between 0 and 1 that determines how much weight the latest observations carry. In this case, we have chosen an Alpha value of 0.15. This value is popular and effective in time series analysis as it neither focuses too heavily on the latest values nor takes a too conservative approach.
Step 3: Perform Trend Calculation
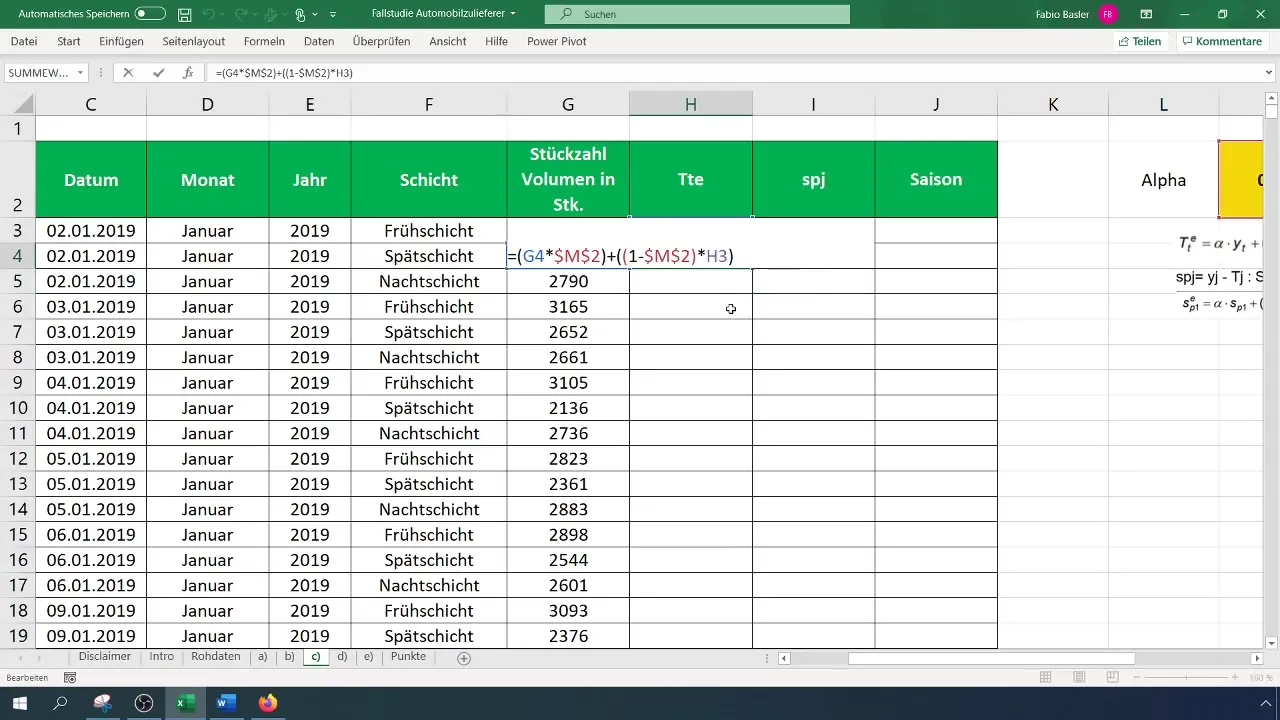
The next element is calculating the trend. To do this, start by entering the formula for exponential smoothing in the respective cell. Make sure to keep the first data point unchanged. From the second point onwards, apply the formula by weighting the previously calculated trend number with the Alpha value. The content of your cell could look like this:
[ T_t = \alpha \cdot Yt + (1 - \alpha) \cdot T{t-1} ]
Use this formula to calculate the first trend value and then drag the formula down to determine the next trend values.
Step 4: Calculate Fluctuation Component
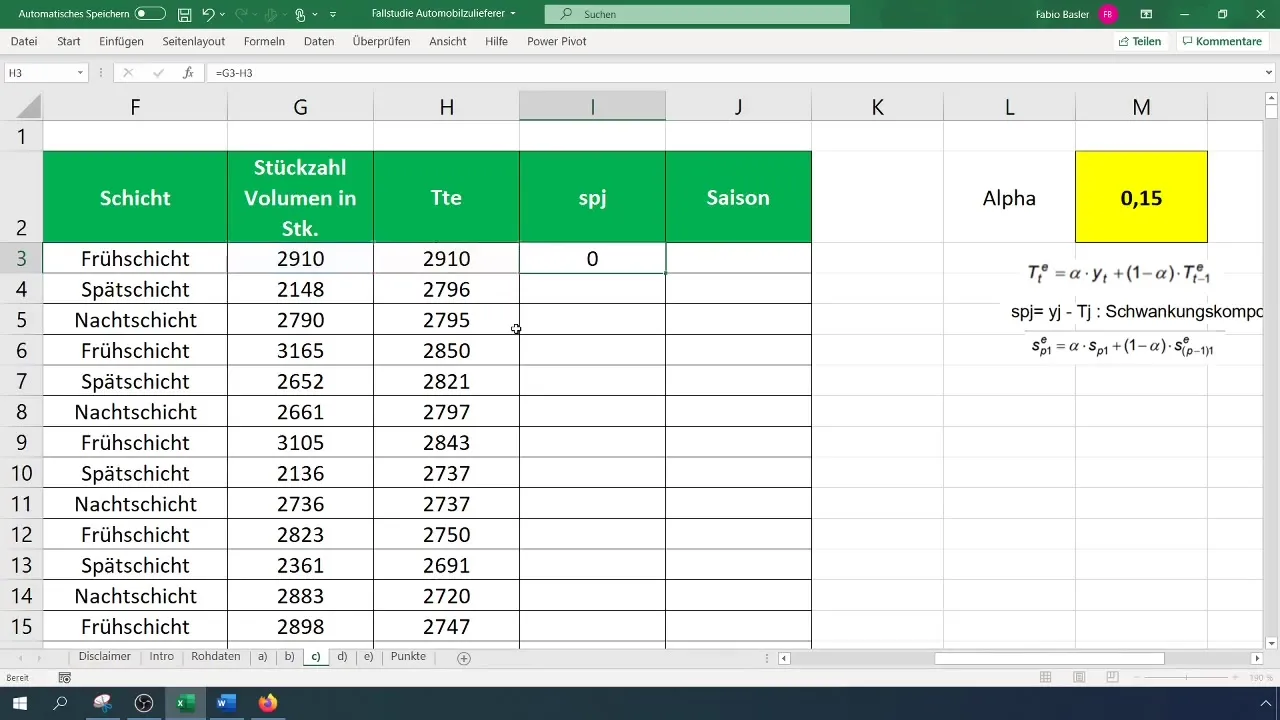
After calculating the trend, it's time to determine the fluctuation component. This is done simply by taking the difference between the actual values and the trend values. The formula for this is:
[ S_j = Y_j - T_j ]
Do not forget to perform this calculation for each data point you are analyzing.
Step 5: Determine Seasonal Values
The next step involves determining the seasonal values. First, you need to identify the number of subperiods in your data. You will usually find a certain regularity in the data. Note down the number of subperiods as this is essential for the seasonal calculations.
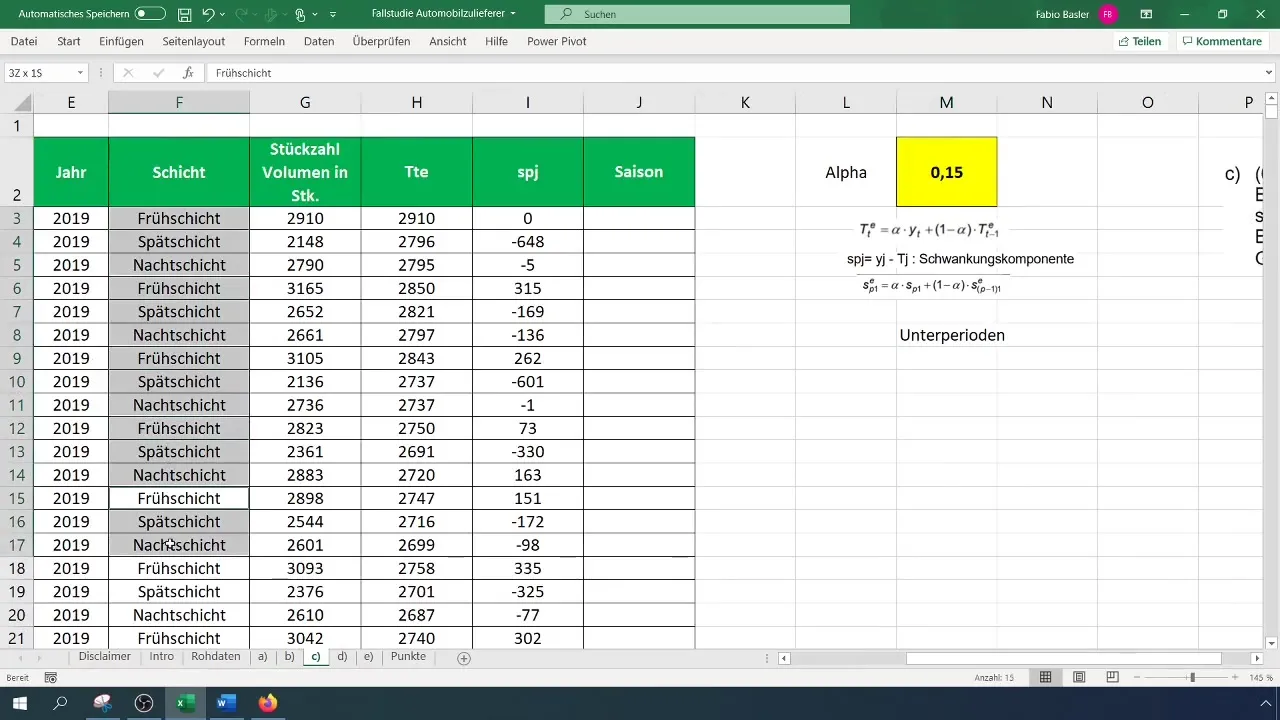
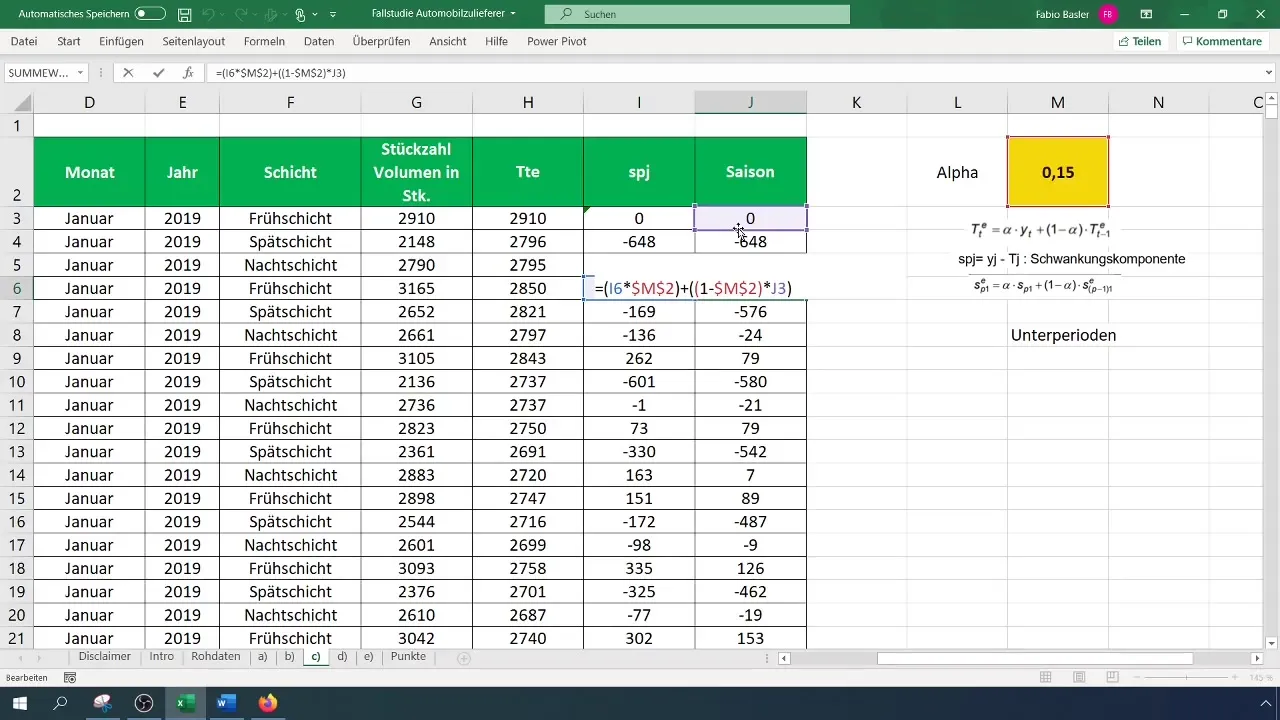
Now that you need the seasonal values, start by adopting the first observations and perform the calculations for the seasonal values from the fourth point onwards by multiplying the previous fluctuations by the Alpha and a counter-Alpha value (1 - Alpha). Remember to fix the formulas before copying to get the results for the subsequent points.
Step 6: Visualize Results
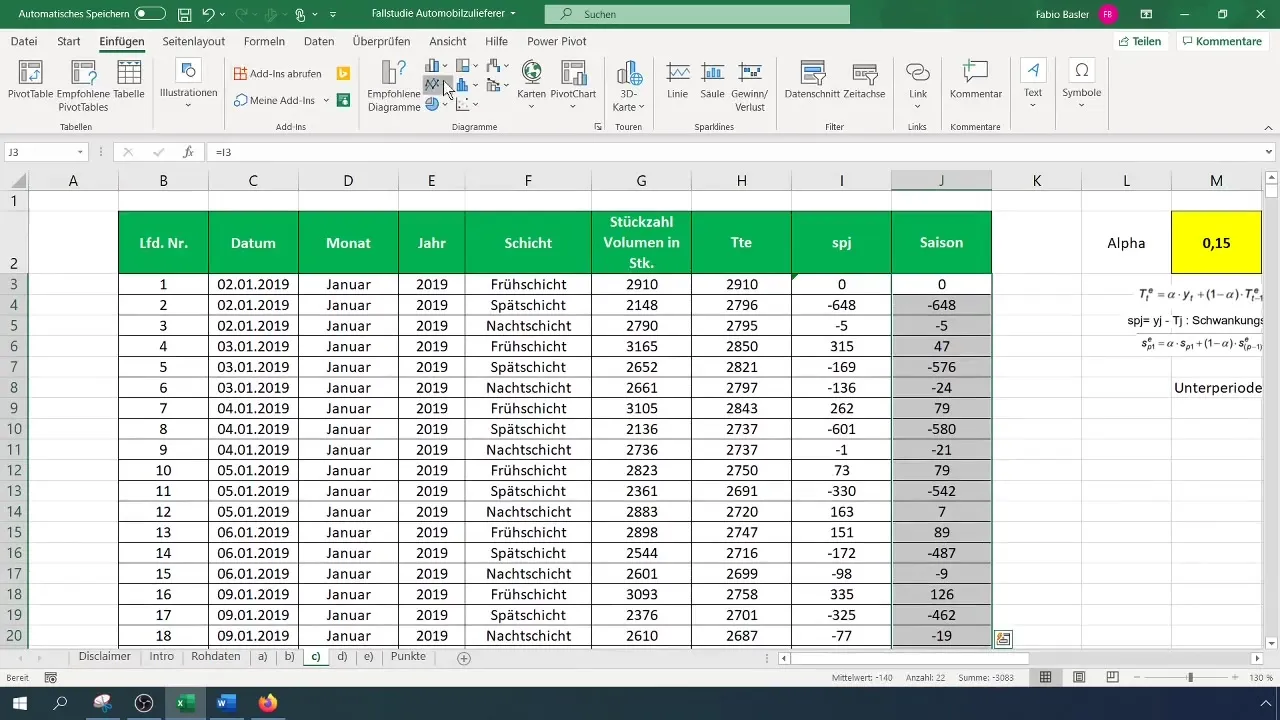
For a better understanding of your insights, a graphical representation is helpful. Visualize the seasonal values in a line chart to identify trends and possible cyclical patterns. You can enhance the visibility of your data by highlighting the values for the first month.
Summary
You have now learned the basics for performing exponential smoothing in Excel. From data entry to trend and fluctuation calculation to seasonal analysis, you have taken an effective tool in hand to gain valuable insights into time series data.
Frequently Asked Questions
How do I use the smoothing parameter (Alpha)?The smoothing parameter should be between 0 and 1; a value of 0.15 is often recommended for time series analyses.
What is the fluctuation component?The fluctuation component is the difference between the actual value and the trend value.
How many subperiods should I use?The number of subperiods depends on your data structure; in this example, there were three.
Can I adjust and visualize the results myself?Yes, you can adjust your results at any time and visualize them in Excel.


