When researching and developing new active ingredients, it is essential to effectively analyze the financial successes and failures in order to optimize future strategies. This guide will show you how to examine the financial results of a case study in the field of biotechnology using Excel. The focus here is on inductive statistics, an important method for analyzing datasets and their interpretation.
Main Insights
- Biotechnology is an essential sector in healthcare that encompasses innovation and development of new active ingredients.
- When analyzing biotechnology data, features like success rate, approval, and research expenses are crucial.
- Excel provides powerful tools for conducting statistical analyses and visualizing the results.
Step-by-Step Guide
Understanding the Case Study
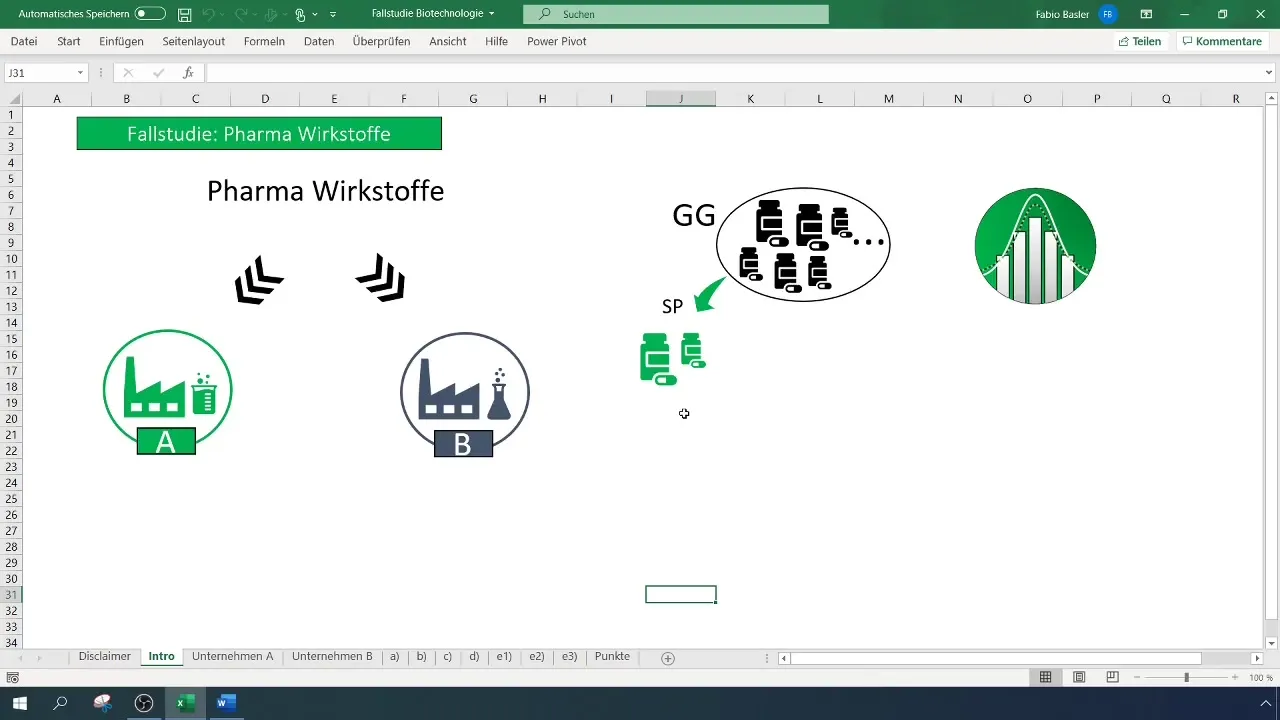
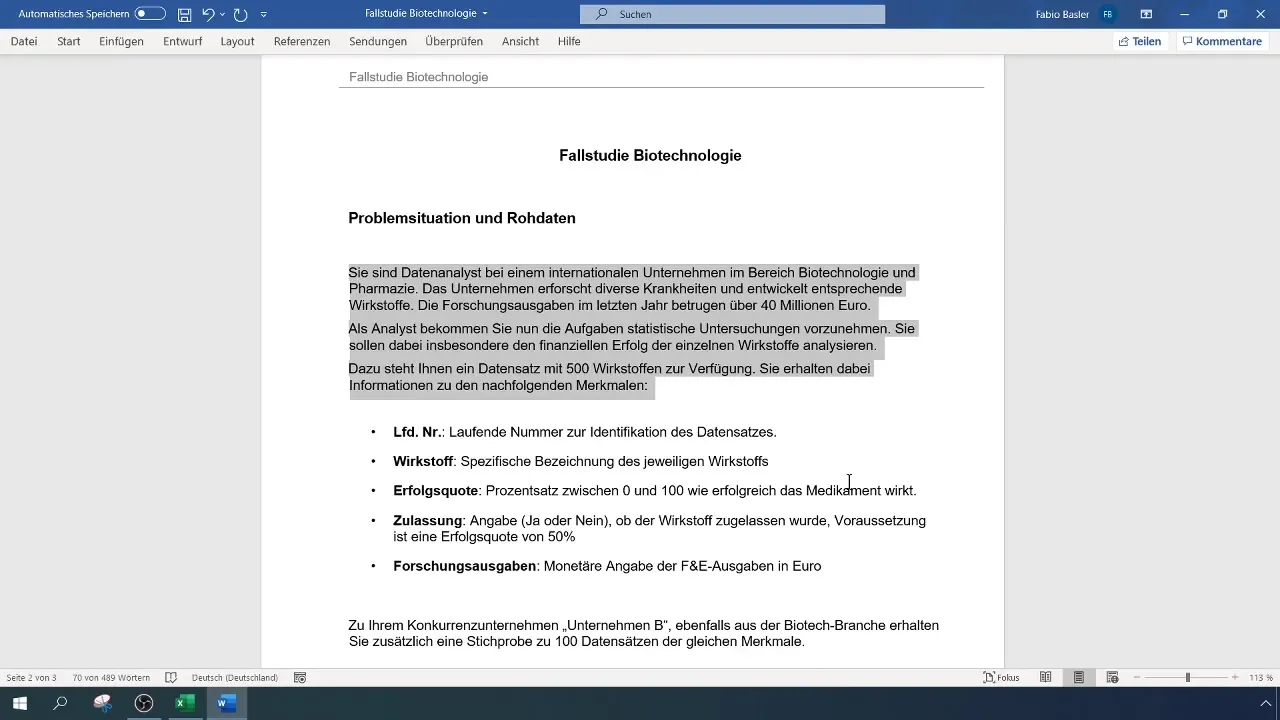
Before you begin data analysis, it is important to understand the basic aspects of the case study. You work in a biotechnology company that develops and investigates various active ingredients. The company has an extensive dataset of 500 active ingredients, whose features you will analyze.

Data Provision and Structure
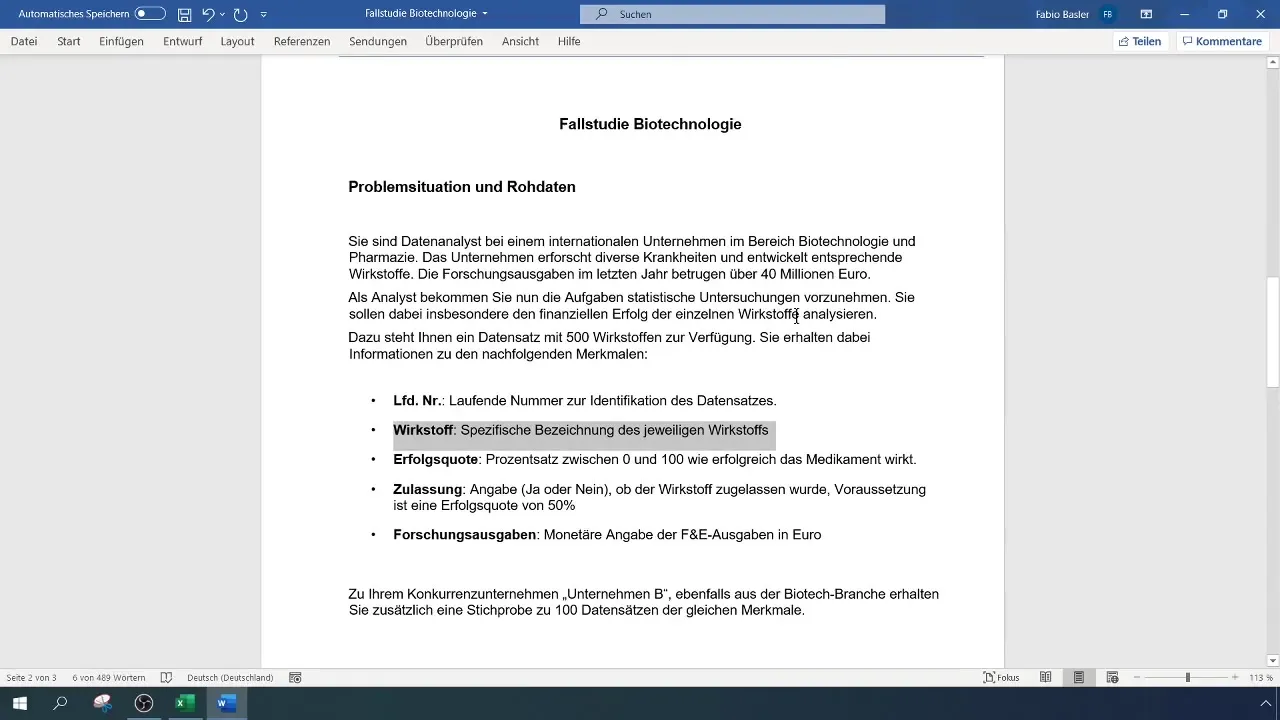
The first step in your analysis is to thoroughly understand the structure of the dataset. It consists of several important features: a serial number for identification, the specific name of the active ingredient, R&D costs (research and development expenses), success rate, approval status, and the financial resources invested in each active ingredient.
Statistical Objectives
Your task as an analyst is now to examine the financial successes of the active ingredients in detail. The success rate, ranging from 0 (low successful) to 100 (highly successful), will play a crucial role. Additionally, you will check whether the developed active ingredients have been approved or not.
Data Analysis with Excel
To start your analysis, open Excel and import the dataset. You can then filter the data by different features to analyze comparable active ingredients. Begin by looking at the research and development costs and compare them with the success rate of the active ingredients.
Graphic Data Representation
Create meaningful charts in Excel to visualize the relationship between research and development costs and the success rate. Use chart types such as bar charts or scatter plots to identify potential trends. Make sure to label the axes and give clear titles to the charts.

Comparison between Company A and B
Continue your data analysis by comparing the results with those of the competitor company (Company B). Analyze the differences in success rate, approval rate, and investments. This can provide valuable insights to make strategic decisions.

Interpretation of Results
After analyzing the data, it's time to interpret the results. What do the collected data say about the efficiency of research and development costs? Are the investments justified in terms of success rate? Use these insights to derive informed probabilities for future projects.

Conclusion of Analysis
To conclude, you should create a summary of the main results. Summarize the insights on success rate and associated costs, and provide recommendations for future investments based on the analysis trends.
Summary
In this guide, you have learned how to analyze the financial successes of biotechnology using Excel. From data structuring to graphical representation to comparative analysis between Company A and B, you have numerous options available to gain the most relevant insights.
Frequently Asked Questions
How many active ingredients were examined in the case study?500 active ingredients were examined in the case study.
What are the key features to be analyzed?The key features are the specific name of the active ingredient, research and development costs, success rate, approval status, and financial investments.
Which software is used for data analysis?Microsoft Excel is used for data analysis.
What types of charts are suitable for data visualization?Bar charts and scatter plots are particularly suitable for visualizing success rate and research and development costs.
How is the success rate defined?The success rate is a quantitative percentage between 0 and 100 indicating how successful a drug is.


