Statistical tests are a central part of data analysis and decision-making. Especially in the field of biotechnology, it can be crucial to test hypotheses about the success rate of active substances. In the context of this tutorial, you will learn how to efficiently conduct a one-sample test (1-SP test) for the expected value with known variance in Excel.
Main Findings
This guide teaches you:
- The theoretical foundations of the 1-SP test.
- Steps to perform the test in Excel.
- Interpretation of the results.
Data Preparation
To perform the 1-SP test in Excel, you first need the relevant data. In our example, we assume that you are analyzing the success rate of active substances. It is known that the average success rate used to be 59%, with a standard deviation of 19. First, you should input your data into an Excel table.

Make sure your data is organized in columns so that you can access it later. Clarity in presentation will help you follow the individual steps more easily.
Test Overview
The 1-SP test is used to check whether the average success value significantly differs from a given value. In this case, we are checking whether the success rate of 59% can be significantly increased in the future.
Formulating Hypotheses
The hypotheses you formulate for the test are crucial:
- Null Hypothesis (H0): The true expected value is equal to 59 (σ = 59%).
- Alternative Hypothesis (H1): The true expected value is greater than 59%.
When formulating the hypotheses, the focus should be on what exactly needs to be tested and how it is represented in your context.
It is important to clearly distinguish between the null hypothesis and the alternative hypothesis, as they form the basis for the subsequent calculations.
Sample Collection
For our test, we are taking a sample of 500 active substances. It is important to ensure that the sample selection is representative and should guarantee through the appropriate method that your results can realistically be extrapolated to the entire population.
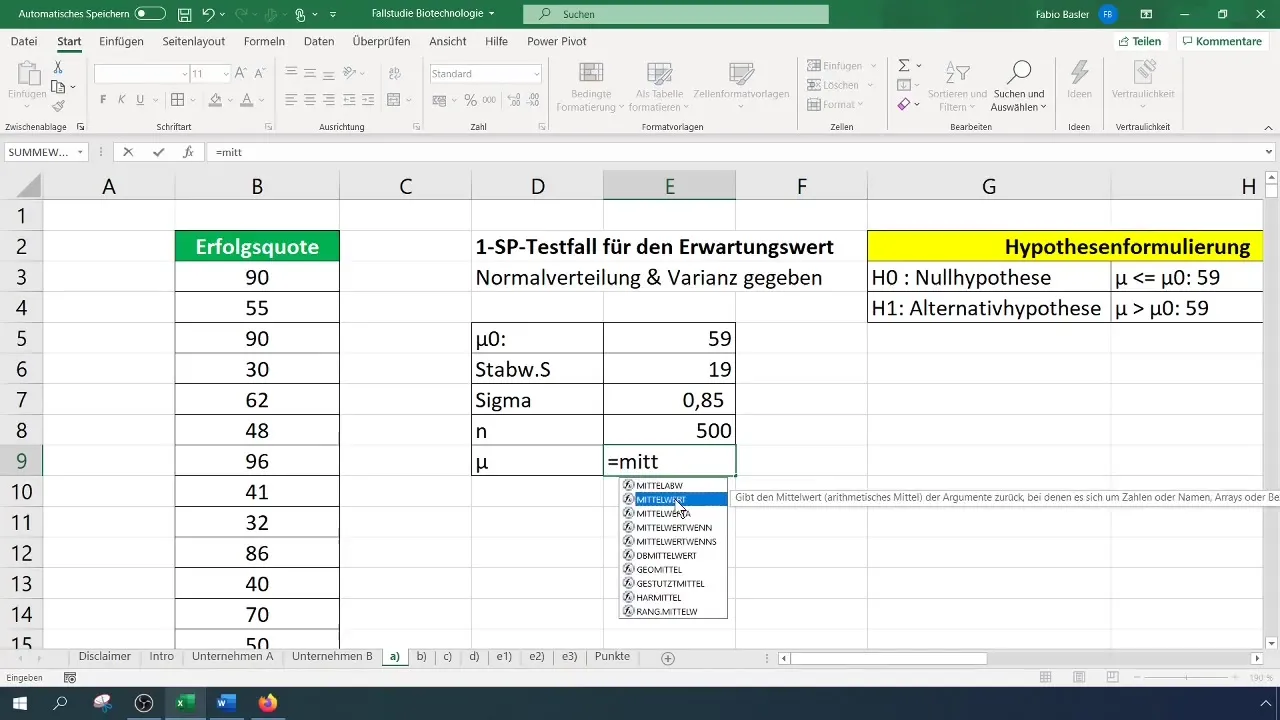
For the test, you first calculate the arithmetic mean. This should be easily accomplished by using the appropriate formula in Excel.
Calculation of Test Statistic
The test statistic for a 1-SP test is determined by the following formula:
[ Z = \frac{\bar{x} - \mu_0}{\sigma/\sqrt{n}} ]
Here, (\bar{x}) represents the mean of your sample, (\mu_0) the assumed mean value (in this case 59), (\sigma) the standard deviation (here 19), and (n) the number of samples (500).
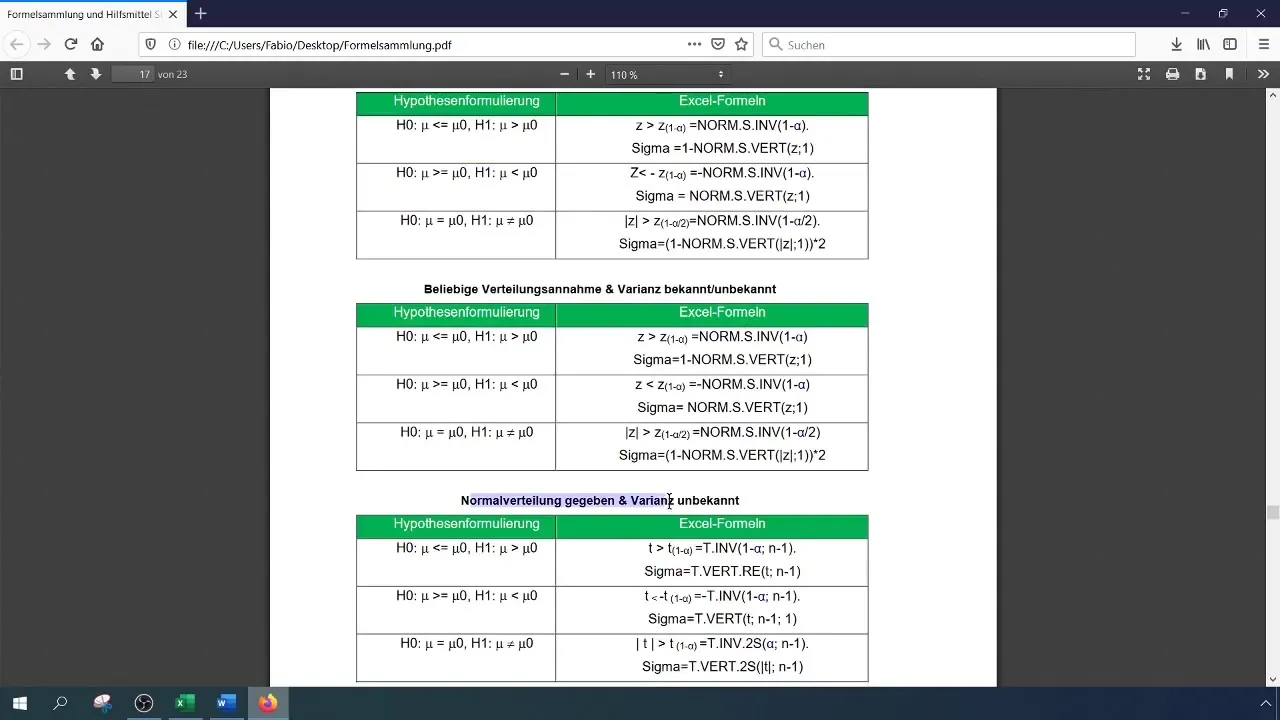
After plugging in the values into the formula, calculate the test statistic to determine if it is significant or not.
Determination of the Critical Value
For a significance level of 1% (0.01), you need to read or calculate the critical value. You can do this in Excel using the NORM.S.INV function.
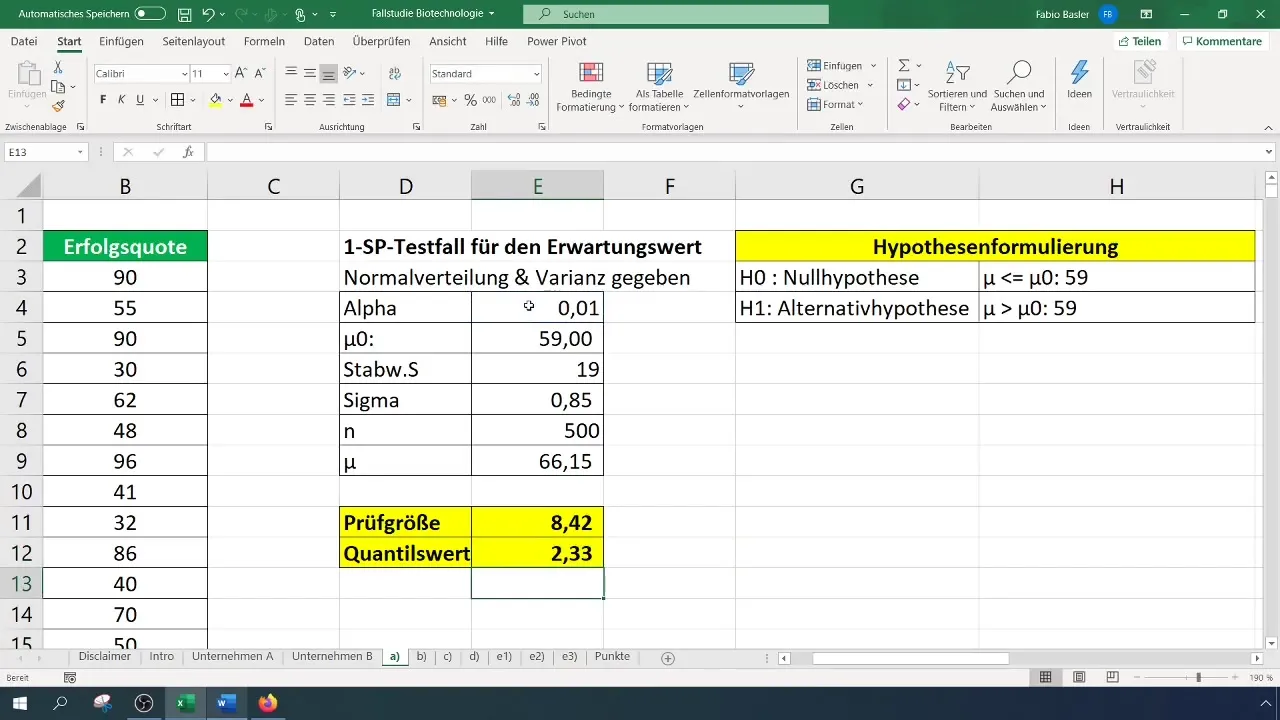
The formula is:
[ \text{NORM.S.INV}(1 - \alpha) ]
Here, (\alpha) is the significance level (0.01). The calculated value serves as the basis for comparison with the test statistic.
Test Execution
Now that you have both the test statistic and the critical value, you compare them:
- If the test statistic is greater than the critical value, the null hypothesis is rejected.
- Otherwise, you cannot reject the null hypothesis.

In our case, a test statistic of 8.4 is obtained, which exceeds the critical value of 2.33. Therefore, we can reject the null hypothesis. This indicates that the success rate has been significantly improved.
Interpretation of the Results
After conducting the test and determining the results, you should interpret them in a clear context. Rejecting the null hypothesis means that the tested new value significantly differs from the past, in this case, 59%.
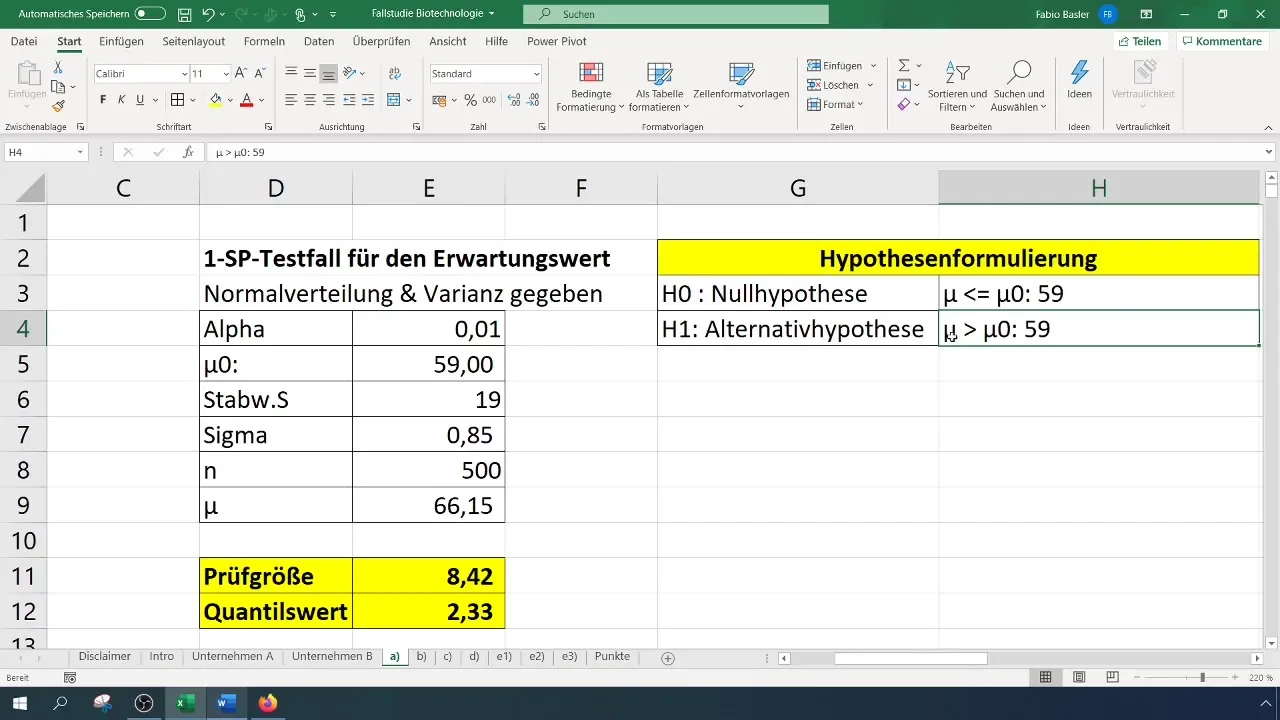
This information is of enormous importance for the strategic decision-making in your company. It confirms that the efforts to improve the success rate have been effective.
Summary
In this tutorial, you have learned how to perform a 1-SP test for the expected value in Excel. Using a case study, you were able to follow the steps from formulating hypotheses to calculating data to interpreting the results. This knowledge is valuable not only for scientific evaluations but also for practical applications in the company.
Frequently Asked Questions
What is the 1-SP Test?The 1-SP Test is a statistical test to check if the mean of a sample significantly deviates from a given value.
How do I formulate hypotheses for the test?The hypotheses consist of a null hypothesis (H0) and an alternative hypothesis (H1) documenting the state to be tested.
How do I calculate the test statistic?The test statistic is determined by the formula ( Z = \frac{\bar{x} - \mu_0}{\sigma/\sqrt{n}} ).
What happens if the test statistic is greater than the critical value?If the test statistic is greater than the critical value, the null hypothesis is rejected.
What role does the significance level play?The significance level indicates the probability with which you are willing to accept an error if you mistakenly reject the null hypothesis.


