Statistical hypothesis tests are crucial instruments for making informed decisions based on data. In this guide, you will learn how to conduct a one-dimensional single-sample test for the mean when the variance is unknown. We will use Excel to effectively perform the calculations and easily visualize the results. This will allow you to analyze the research expenses of a company and evaluate whether they have indeed been reduced. Let's dive straight into the subject.
Key Takeaways
- You will learn the basic steps to conduct a 1-SP test for the mean in Excel.
- The test pertains to a normal distribution with an unknown variance.
- The null hypothesis is rejected if the test statistic is less than the critical quantile value.
- Excel allows you to perform all necessary mathematical calculations and create charts.
Step-by-Step Guide
Step 1: Understanding the Task
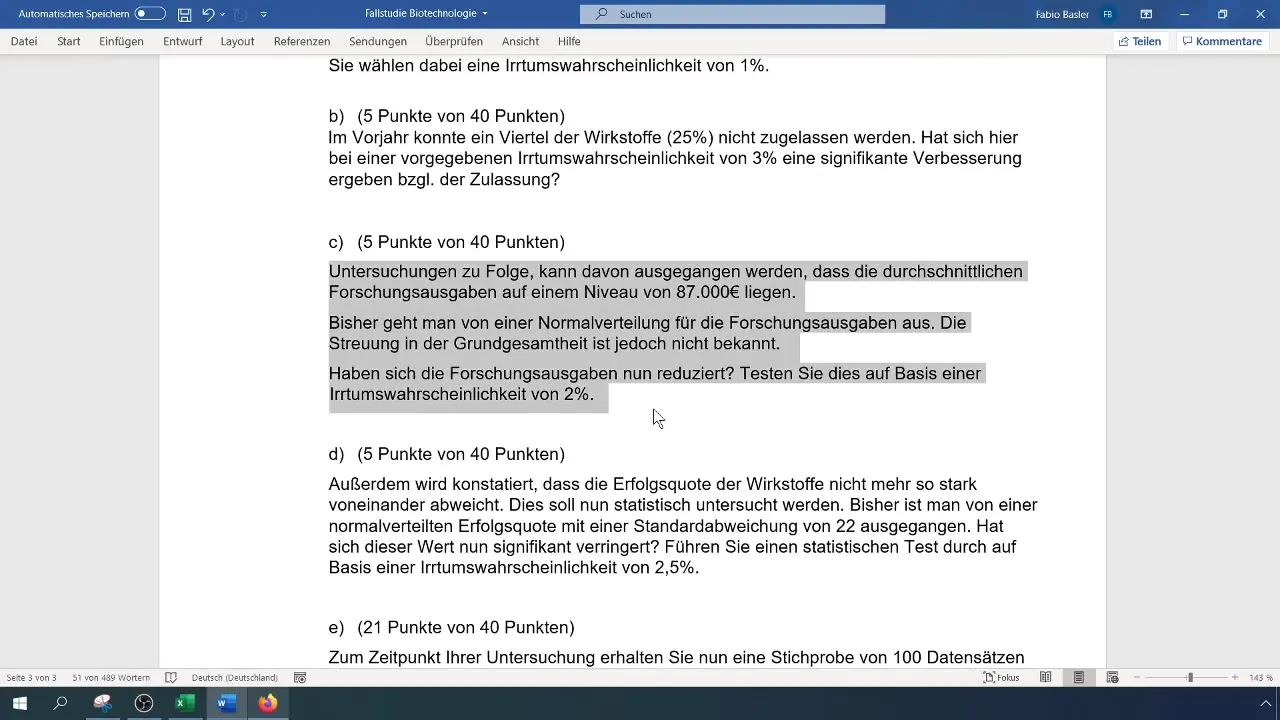
First, you need to thoroughly read the assignment. It is given that the average research expenses for a specific project are at a level of 87,000 €. In our case, we assume that these expenses may have been reduced and you want to test this hypothesis.

Step 2: Formulating the Hypotheses
Next, formulate the hypotheses. The null hypothesis H0 states that the average research expenses continue to be at 87,000 €. On the other hand, the alternative hypothesis H1 tests whether these expenses have actually been reduced.
Step 3: Data Collection and Preparation in Excel
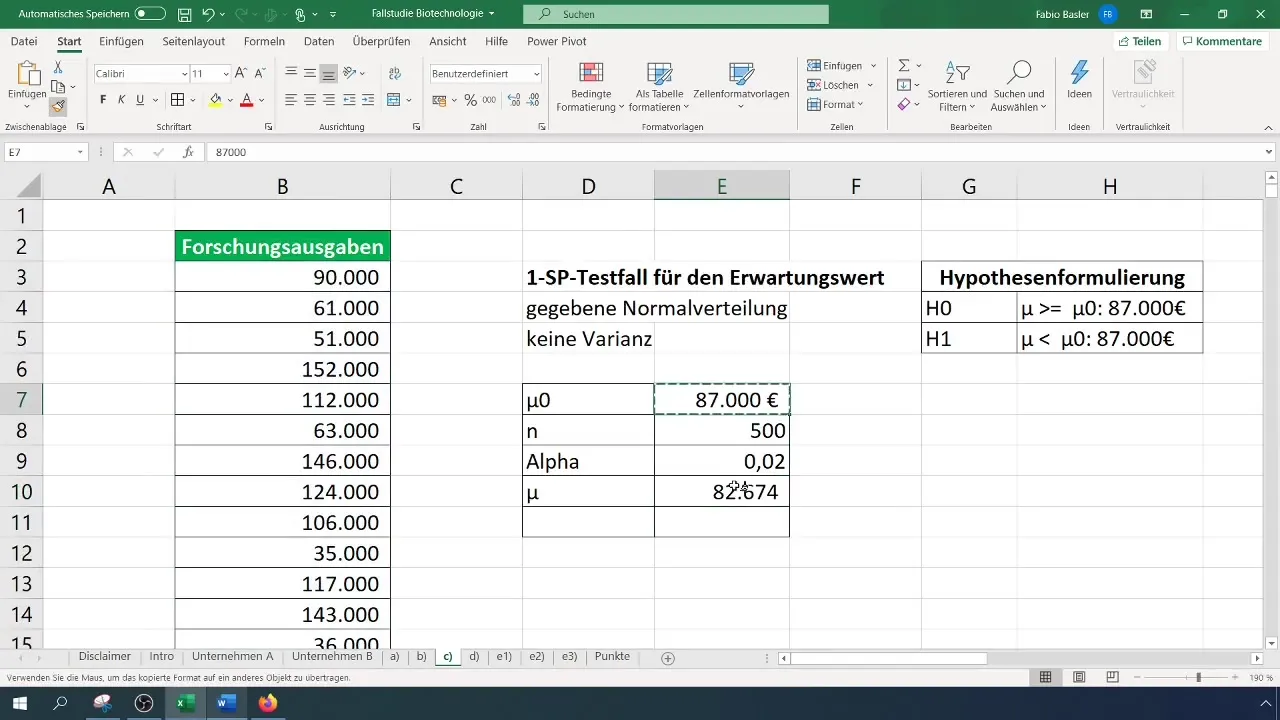
Now, you should enter the relevant data in Excel. Copy the provided data into the cell where you need it for the calculation. Keep the sample size (n), average expenses, and known normal distribution in a separate column.

Step 4: Calculating the Mean
Calculate the mean of the data using the Excel formula =AVERAGE(). This calculation is important to reflect the current state of research expenses. You will need this value later to calculate the test statistic.
Step 5: Calculating the Standard Deviation
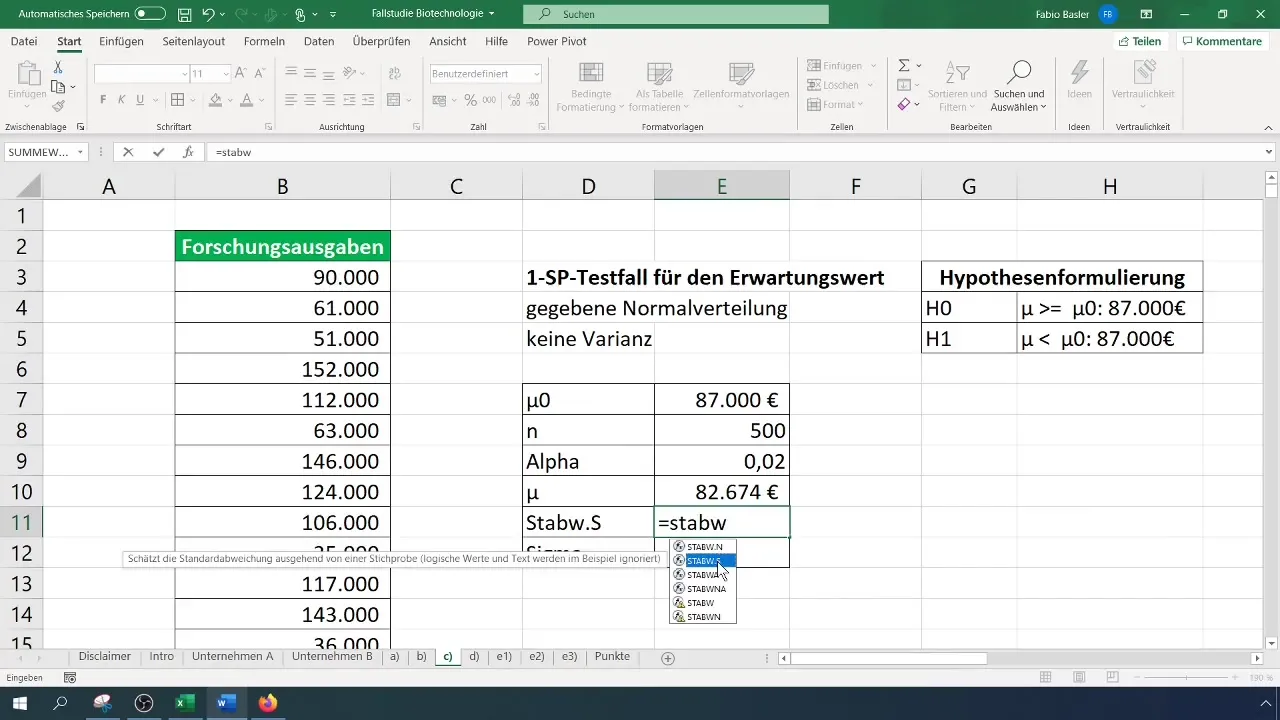
Since the variance is unknown, use the formula STDEV.S() in Excel to calculate the standard deviation. This is crucial in the context of the t-test we will conduct.
Step 6: Calculating the Test Statistic
The test statistic is calculated using the following formula:
[ t = \frac{\bar{x} - \mu_0}{\frac{s}{\sqrt{n}}} ]
Here, (\bar{x}) is the current mean, (\mu_0) is the mean from the null hypothesis, (s) is the standard deviation, and (n) is the number of samples.
Step 7: Determining the Critical Value
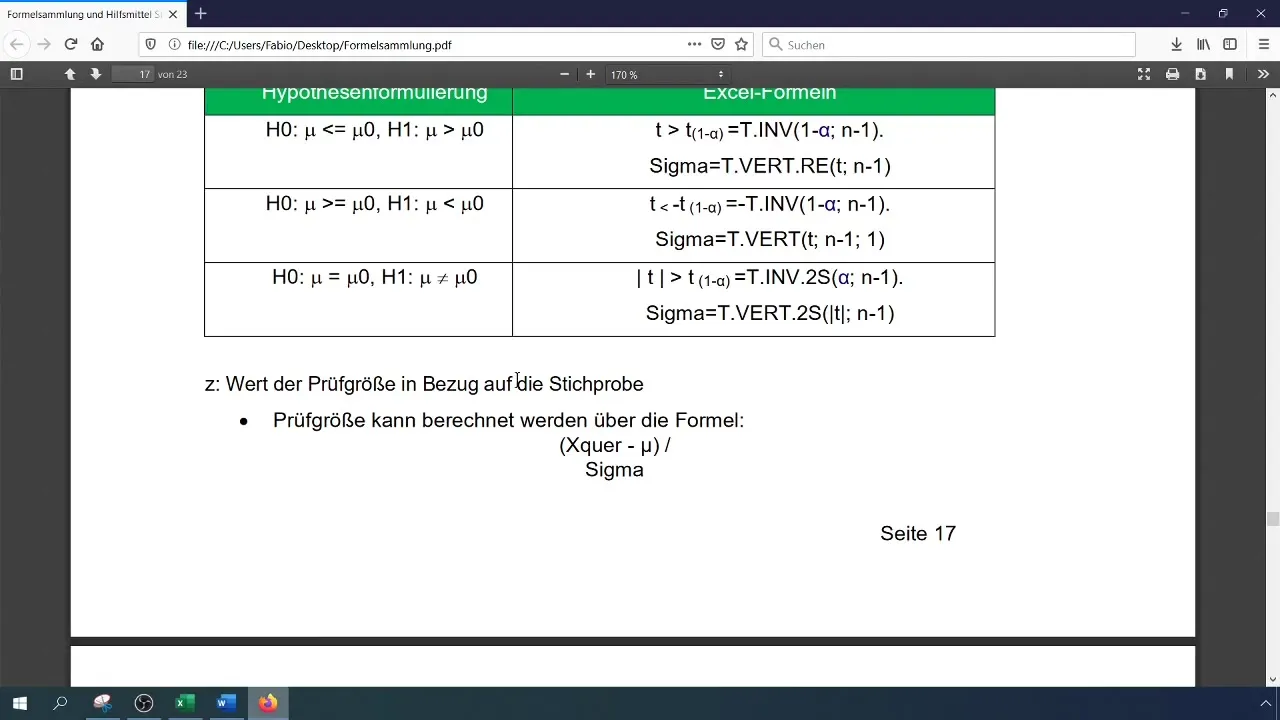
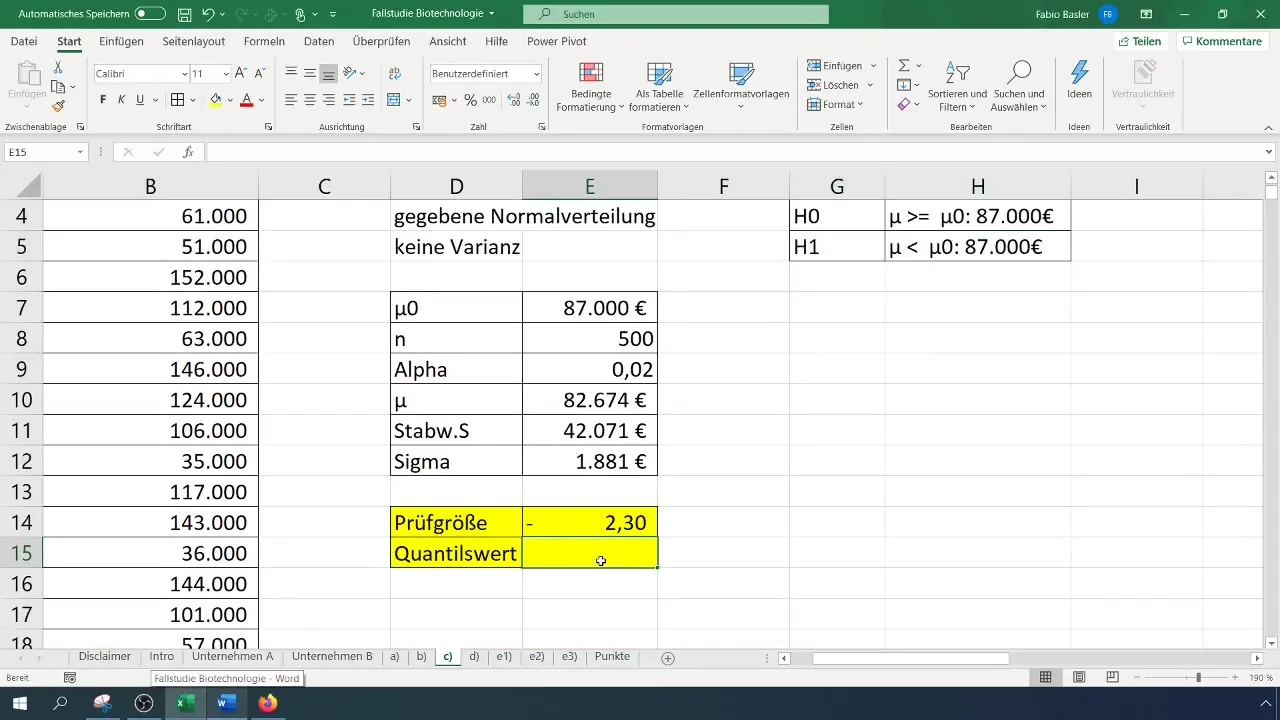
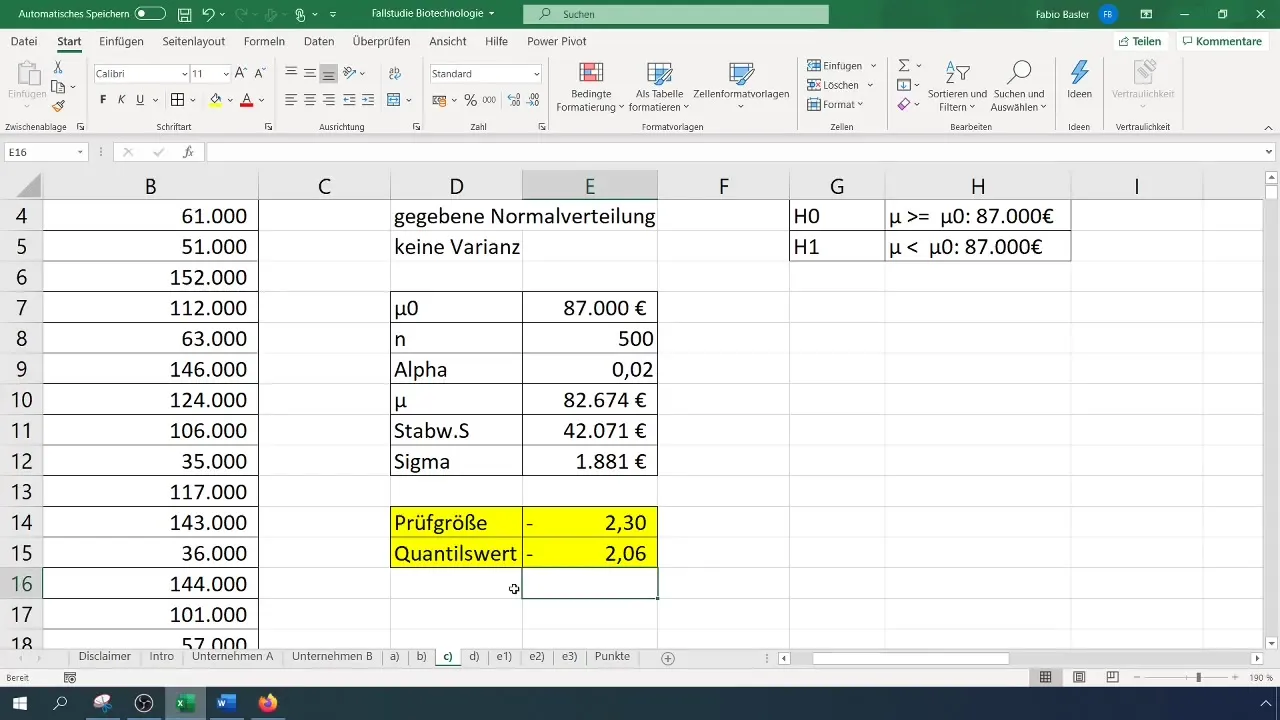
To determine the critical value, use the Excel function for the t-distribution. You can do this with the formula =T.DIST(). Make sure to specify the relevant parameters like the confidence level and degrees of freedom.
Step 8: Comparing the Test Statistic with the Critical Value
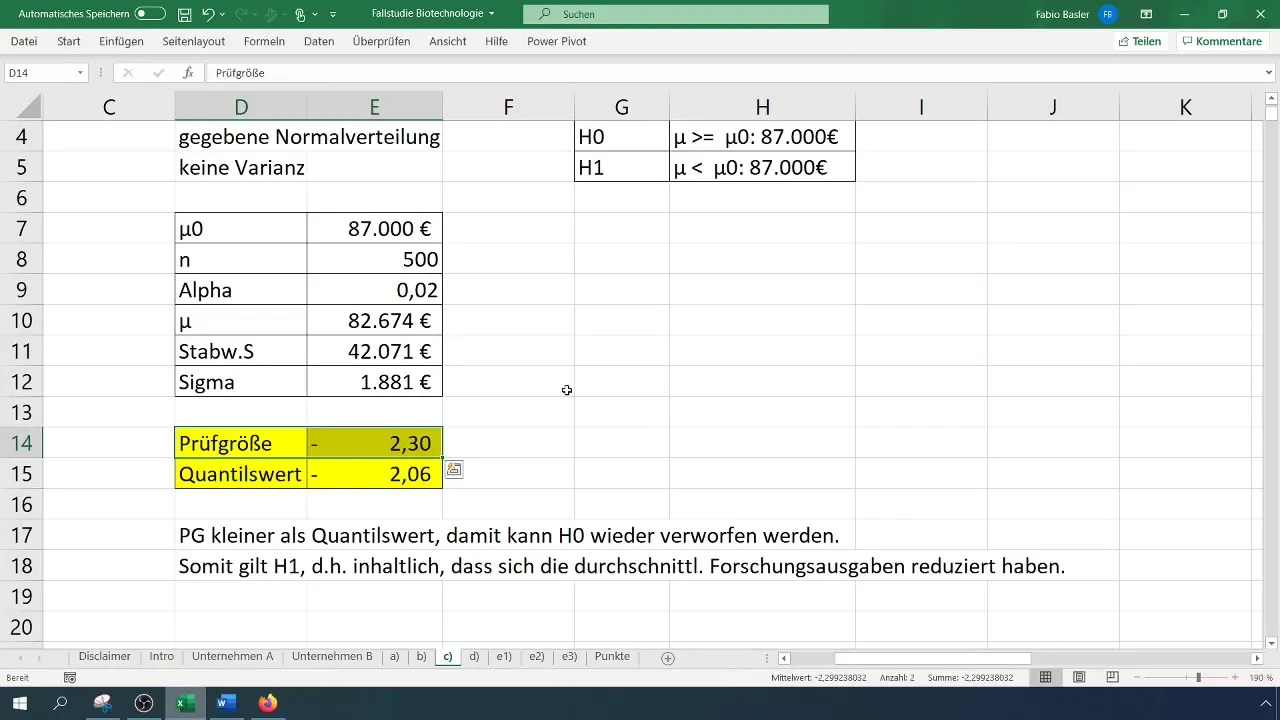
Now, compare your calculated test statistic with the critical value. If the test statistic is less than the critical value, then you can reject the null hypothesis.
Step 9: Drawing Conclusions
Finally, draw the conclusions. If you have rejected the null hypothesis, it means that the average research expenditures have decreased. Document your results and consider what implications these could have for your company.
Summary
You have successfully learned how to perform a 1-Sample Test for the mean with an unknown variance in Excel. The main steps included understanding the task, formulating hypotheses, collecting data, calculating mean and standard deviation, determining test statistics, and critically evaluating your results. These skills are not only important for academic purposes but also in practice, especially in research and development.
Frequently Asked Questions
How do I perform a 1-Sample Test in Excel?Go through the steps of the test: Formulate the hypotheses, calculate the mean and standard deviation, find the test statistic and critical value, and compare the two.
What do I do if my variance is known?In this case, you use a z-test instead of a t-test, as the variance is a known element in this case.
How do I interpret the results?If the test statistic is less than the critical value, the null hypothesis is rejected, which means there is significant evidence of a change in average values.


