The two-sample t-test is an essential tool in statistics when you want to examine the difference between two means. In this tutorial, you will learn how to perform this test simply and effectively in Excel. Using an example from biotechnology, you will learn to compare and statistically analyze the success rates of two competing companies.
Key Takeaways
- Application of the two-sample t-test to analyze the difference between two means.
- Formulation and testing of hypotheses.
- Use of Excel to calculate and present results.
Step-by-Step Guide
First, we will start by creating the necessary data and conducting the test in Excel.
Step 1: Prepare Data
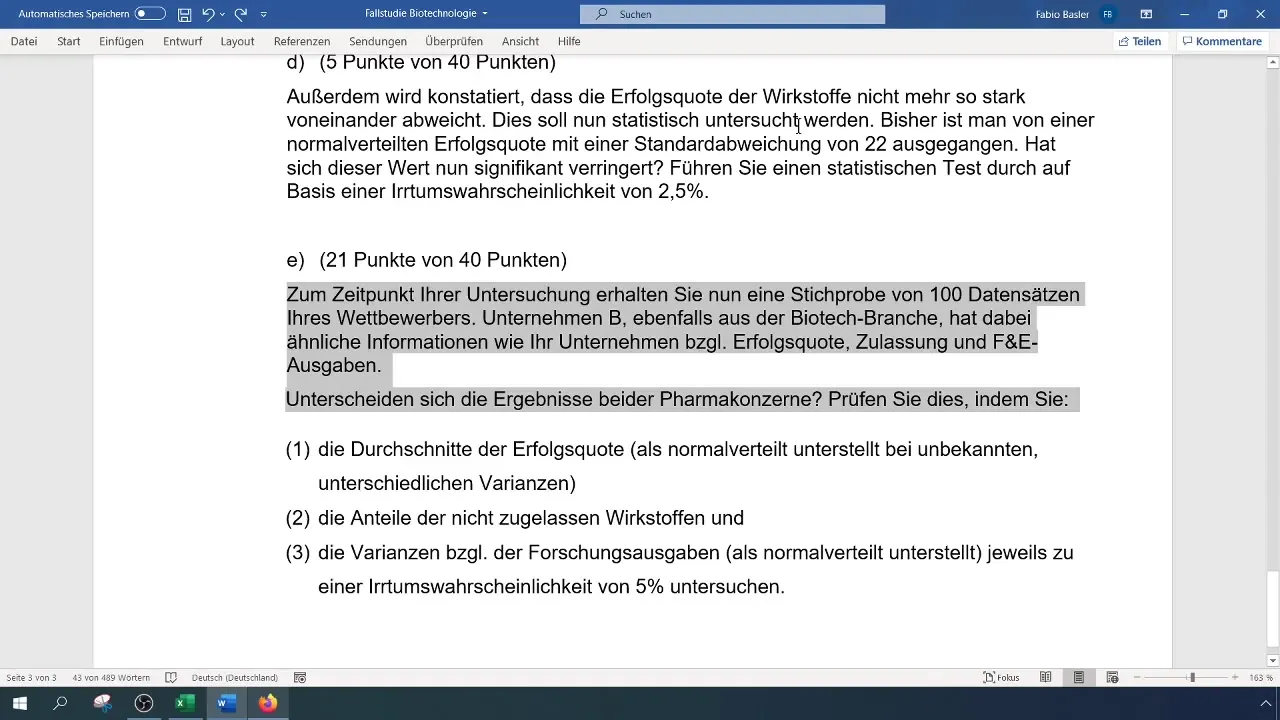
Begin by collecting raw data on the success rates of the two companies. Assume you have data from Company A and Company B, each with a sample of 100 records.

Step 2: Calculate Sample Size and Means
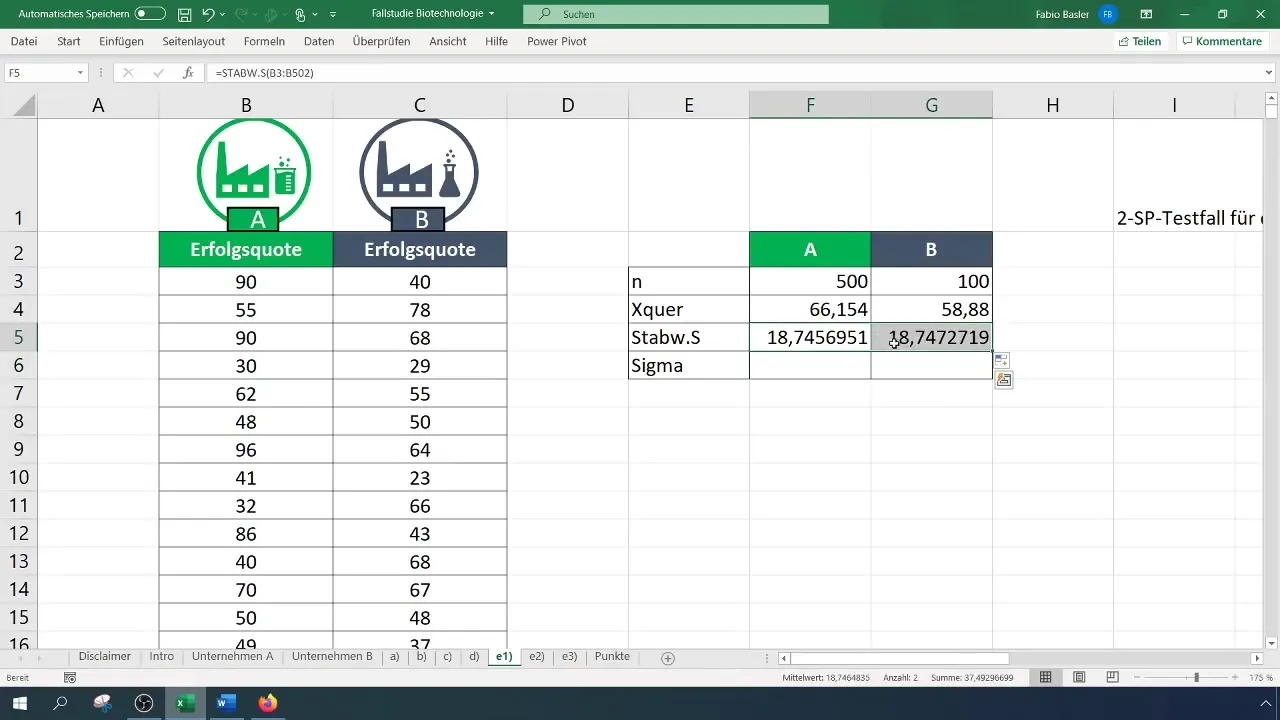
Create a table in Excel to compare the samples and their means. Calculate the sample size (N) for both companies and the mean (X) initially.
Step 3: Determine Standard Deviations
Calculate the standard deviation for both companies. These values are important for calculating the variance and subsequent calculations.
Step 4: Formulate Hypotheses
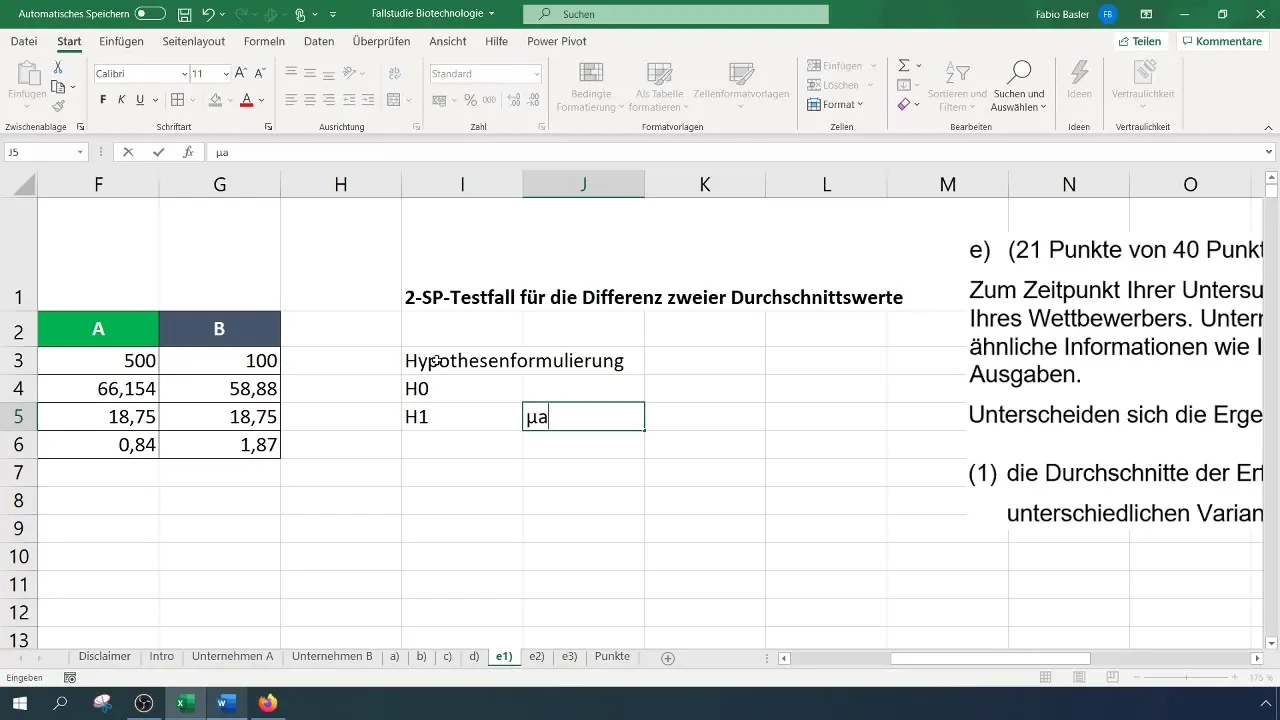
Formulate the null hypothesis (H_0): The average success rates of Companies A and B are equal. The alternative hypothesis (H_1): The average success rates are different.
Step 5: Calculate Test Statistic
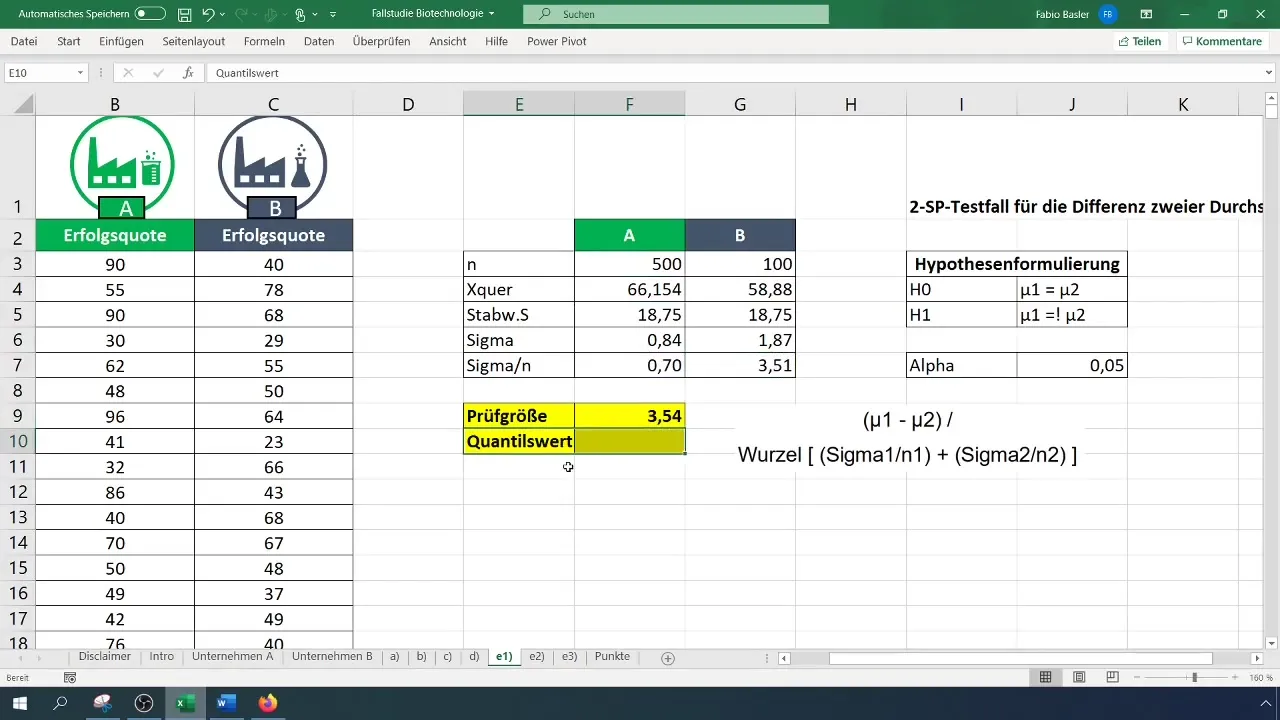
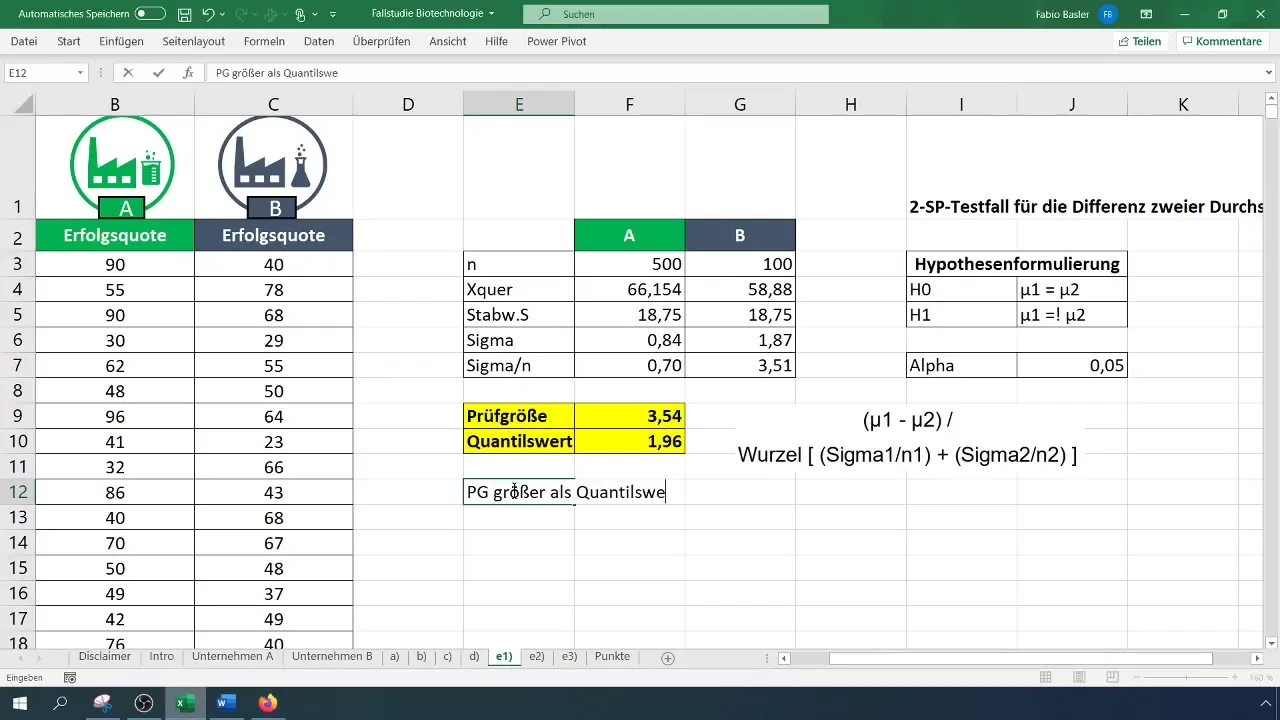
To calculate the test statistic, use the formula for the t-test. Calculate the difference of the means and divide by the square root of the sum of variances for each sample.
Step 6: Determine Critical Value
Use the two-tailed t-distribution to find the critical value. Set the alpha level to 0.05. Check the t-distribution table or calculate the factor directly in Excel.
Step 7: Decide on Hypothesis
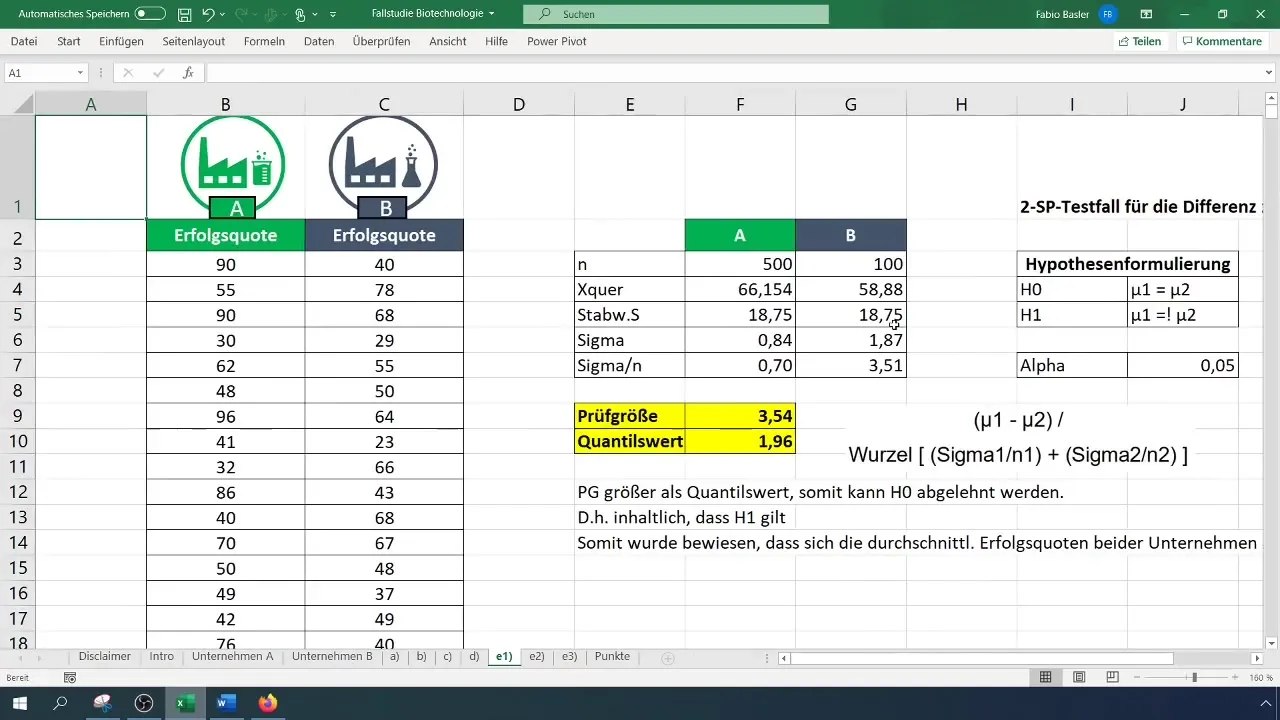
Compare the calculated test statistic with the critical value. If the test statistic is greater than the critical value, reject the null hypothesis (H_0) and thereby confirm the alternative hypothesis (H_1).
Step 8: Interpret Results
Finally, interpret the results. In this example, the average success rates of the two companies were found to be significantly different.
Summary
You have learned how to perform a two-sample t-test in Excel to examine differences in means between two groups. The steps from data preparation to hypothesis formulation to interpreting results are crucial for making valid and informed decisions.
Frequently Asked Questions
What is a two-sample t-test?A two-sample t-test compares the means of two groups to determine if they are significantly different.
How do I formulate hypotheses?The null hypothesis (H_0) states that the means are equal, while the alternative hypothesis (H_1) states that they are different.
How do I calculate the test statistic?The test statistic is calculated by dividing the difference of means by the square root of the sum of variances.
What do I do after calculation?Compare the test statistic with the critical value to decide if you can reject the null hypothesis.
Why is standard deviation important?Standard deviation helps understand the variability of data, which is crucial for calculating the test statistic.


