The analysis of share values is of great interest in many industries, especially when comparing two different groups. In this guide, you will learn how to conduct a 2-sample test (2-SP-Test) for the difference of two share values in Excel. This test allows you to check whether the share values of two different companies regarding the approval of active substances are significantly different.
Main Insights
- The 2-SP-Test evaluates the difference between two share values.
- You can use Excel to calculate important statistical parameters such as the estimator and test statistic.
- The test result shows whether the share values are equal or unequal.
Step-by-Step Guide
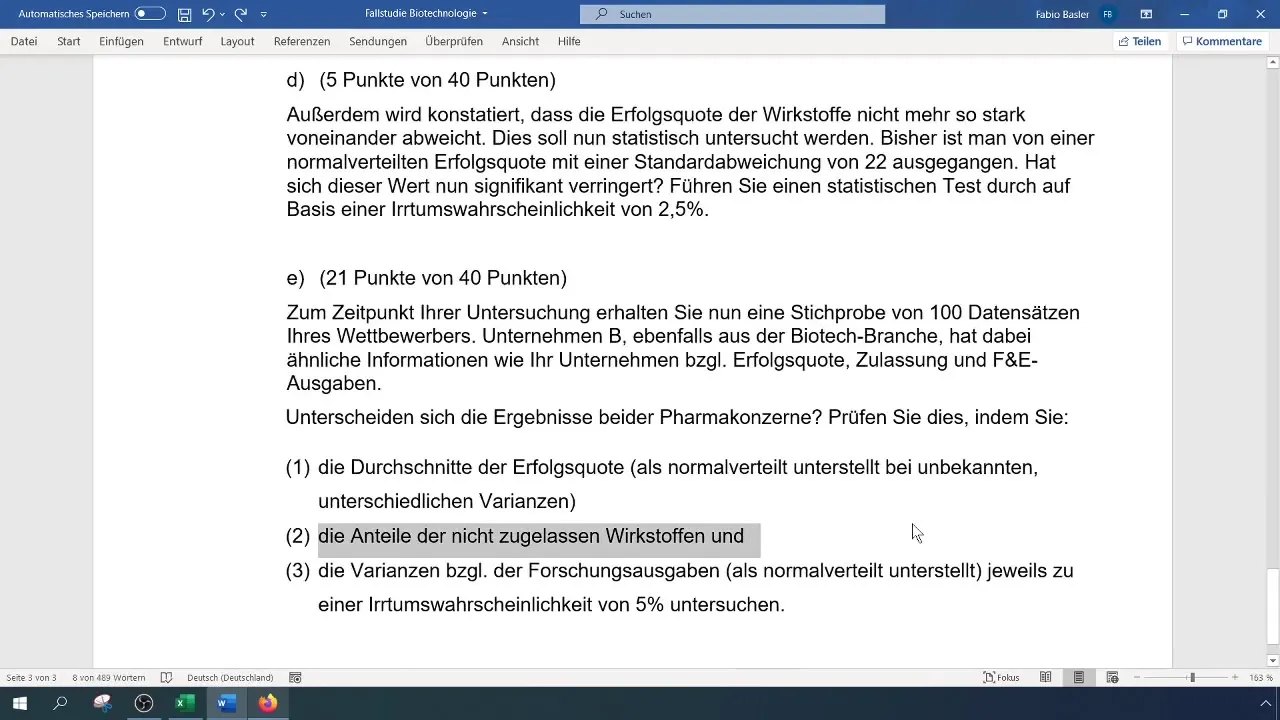
First, it is important to organize the data for the two companies. You need to record the number of approved and unapproved active substances in Excel.
In this case, we have the information on the approvals of Companies A and B in cells E2 and E3. To maintain a clear overview, you note down the respective share values.

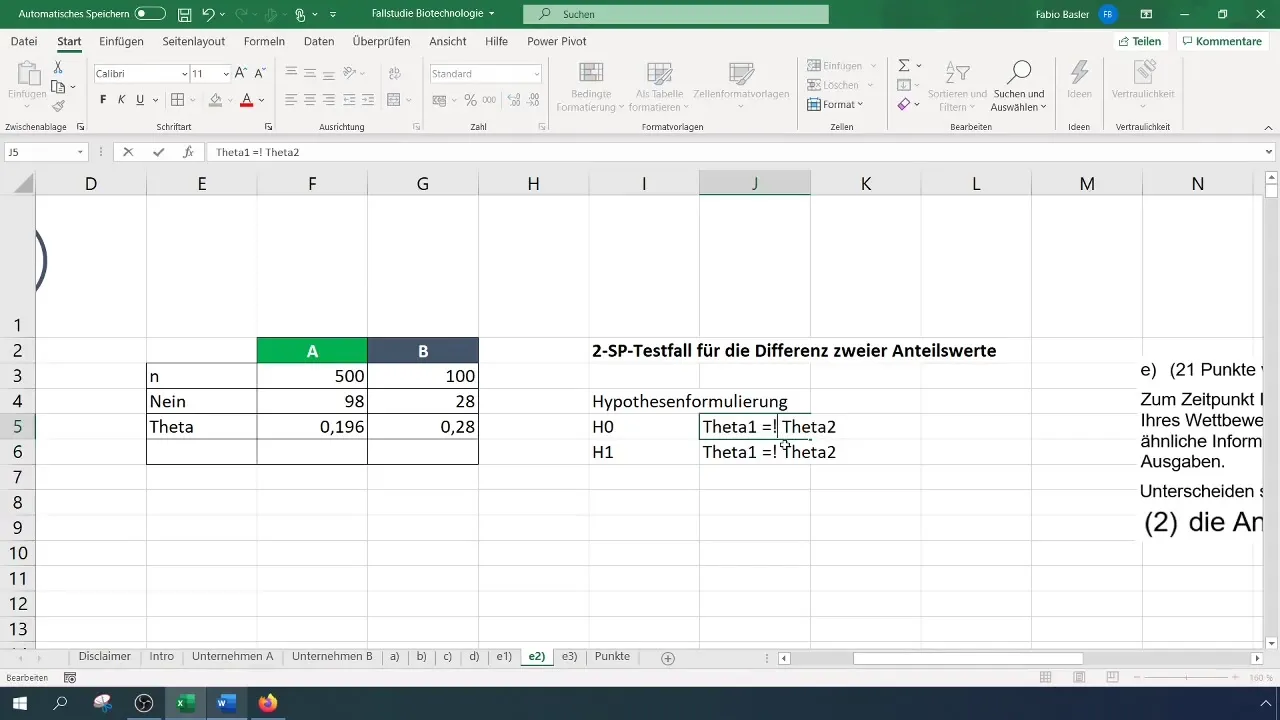
The goal here is to calculate the share value for the unapproved active substances. For this, you need the sample size, which is 500 for Company A and 100 for Company B for our analysis.

To calculate the estimator for the share values, you first need to count the "no" responses. You do this using the "Count if..." function.

For Company A, you have a total of 98 "no" responses, which will be factored into the calculation. Apply the same procedure to Company B.

Afterwards, you calculate proportionally, giving you values of 19.6% for Company A and 28% for Company B. Now we have the share values needed for the further process.
Since we are dealing with a parametric test case here, you will now clearly formulate the hypotheses. The null hypothesis (H0) states that the share values of both companies are equal, while the alternative hypothesis (H1) states that the share values are unequal.
Next, you calculate the test statistic. Enter the formula for the estimator in Excel, including the votes from Companies A and B and their respective sample sizes.
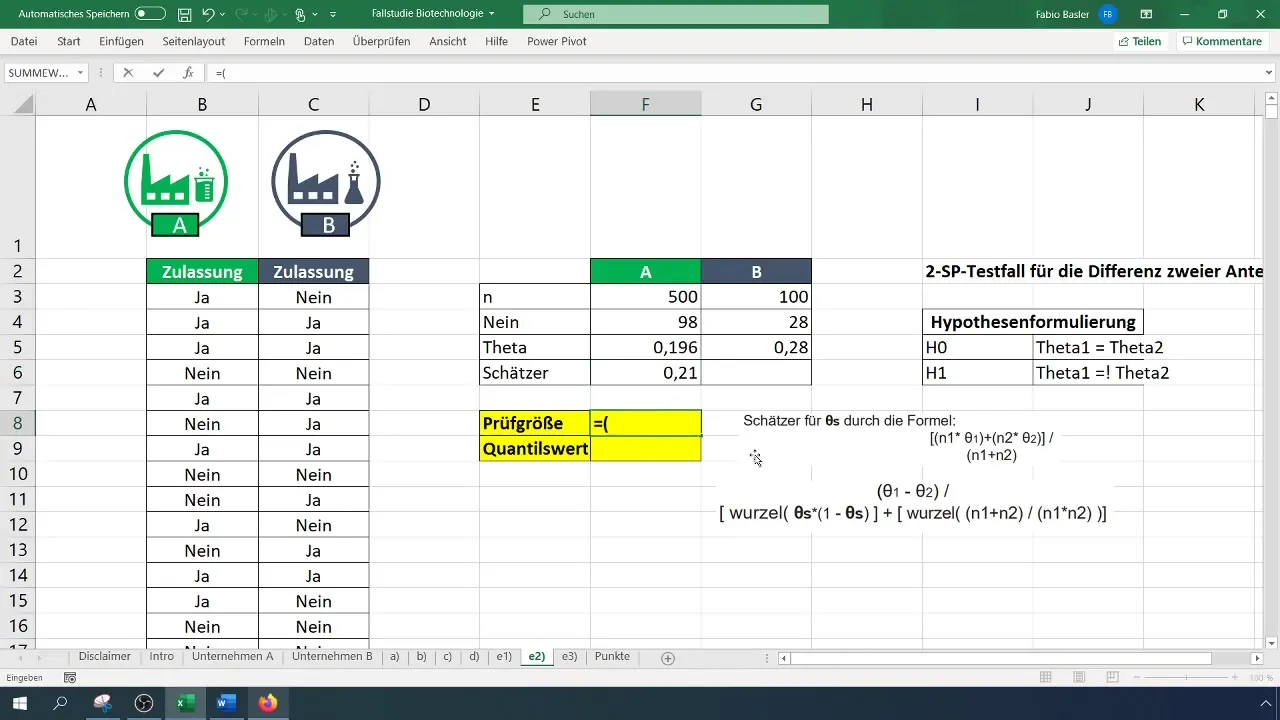
The test statistic is then determined by dividing the difference of the share values by the standard deviation of the difference. This formula may appear complicated at first, but can be implemented neatly in Excel.
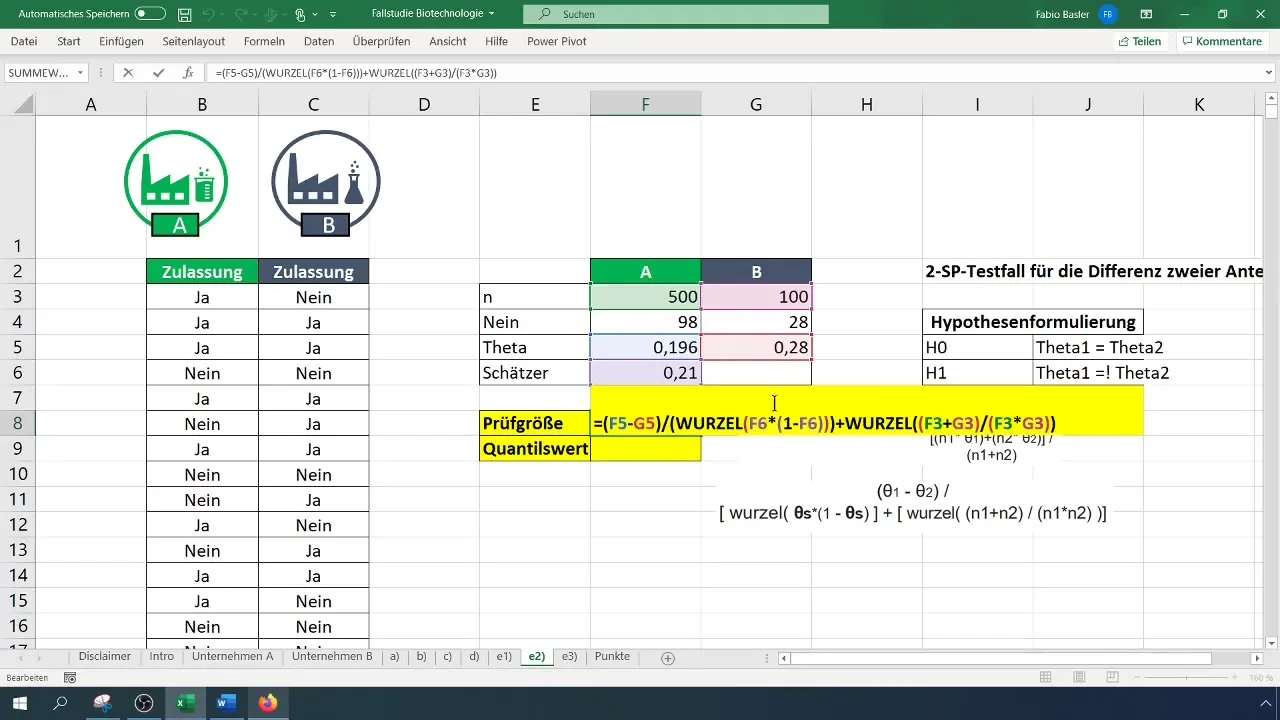
Make sure you have correctly entered all ingredients of the calculation in the cells. If you accomplish this, at the end of the calculation you will obtain a test statistic, which you now need to compare with the critical value (quantile value).
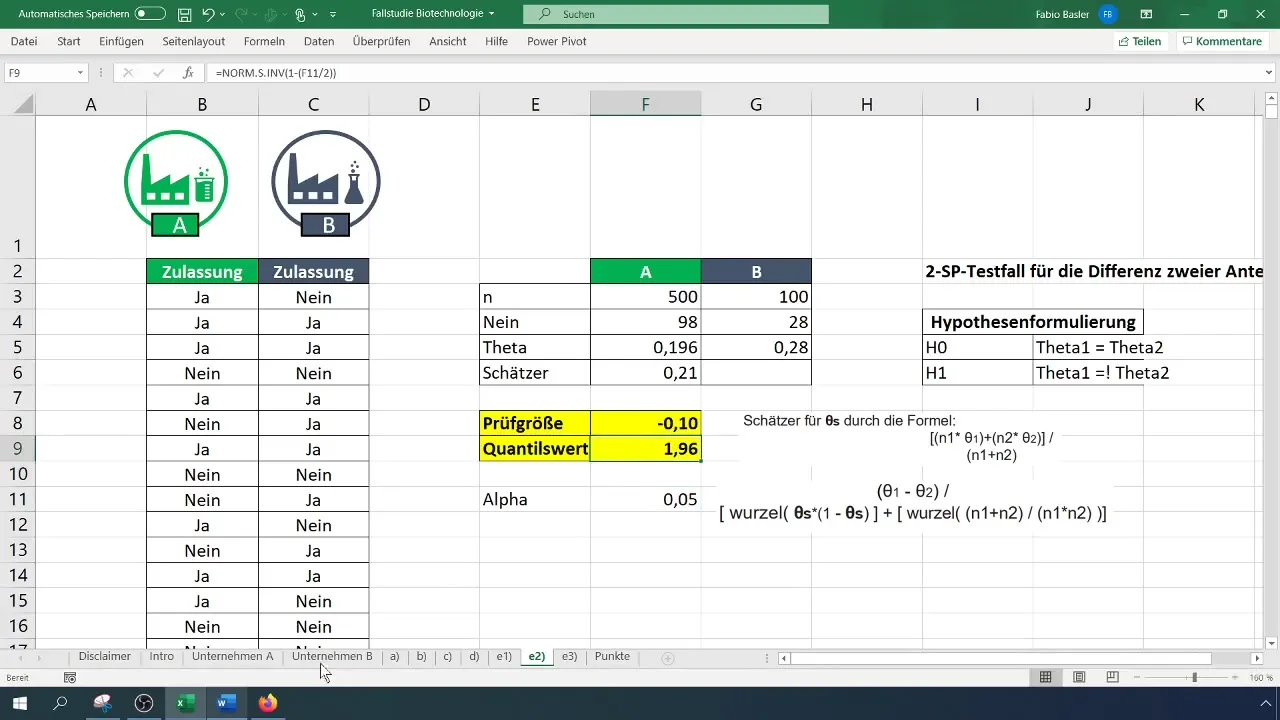
To find the quantile value, use the function for the standard normal distribution in Excel. Insert the values for Alpha. For this test, we typically use an Alpha value of 0.05.
With the calculation of the quantile value, you can now make the decision on rejecting or retaining the null hypothesis. Comparing your test statistic with the quantile value will give you insight into whether the hypothesis can be rejected or not.
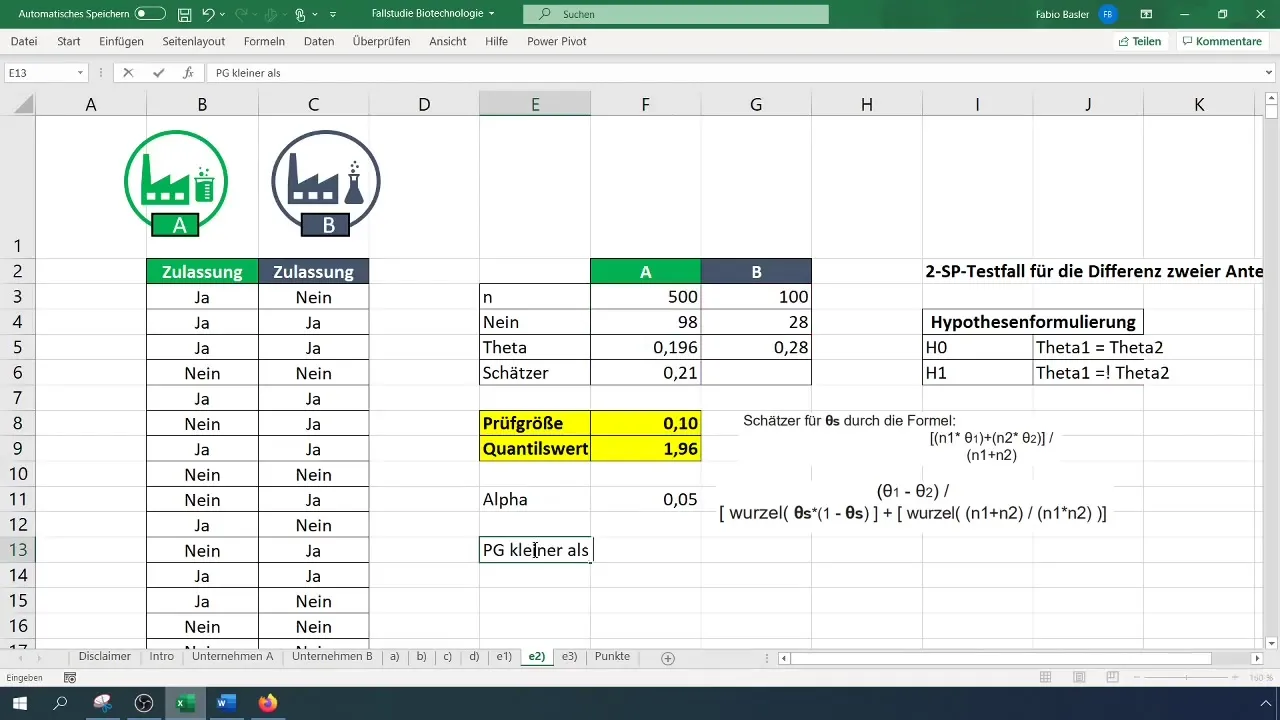
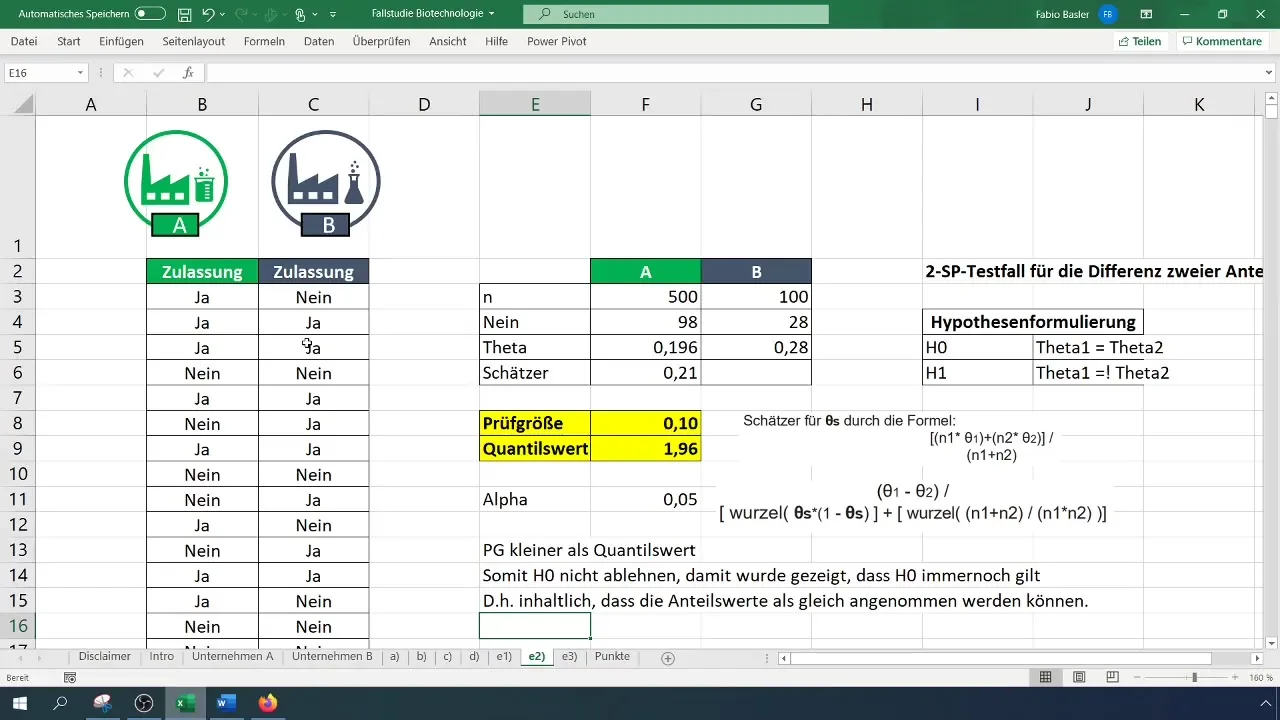
In our case, the test statistic is smaller than the quantile value, which means that you cannot reject the null hypothesis. As a result, the proportion values of companies A and B can be considered as equal.
Summary
You have now learned all the steps necessary to perform a 2-sample test for the difference of two proportion values in Excel. The correct application of the respective formulas and functions allows you to make informed decisions based on statistical data.
Frequently Asked Questions
What is the 2-sample test?The 2-sample test compares the proportion values of two groups to determine if there is a significant difference.
How do I calculate the test statistic in Excel?The test statistic is calculated by dividing the difference of the proportion values by the standard deviation of the difference.
What should I do if the test statistic is smaller than the quantile value?If the test statistic is smaller, you cannot reject the null hypothesis, which means that the proportion values are considered equal.
What data do I need for the 2-sample test?You need the number of successes (e.g., approved drugs) and the sample size for each group.
How can I calculate the quantile value in Excel for my test?Use the function for the standard normal distribution and plug in your alpha value to determine the quantile value.


