Statistical tests are an essential part of data analysis, especially when it comes to examining differences between groups. A proven method often used in research and business is the two-sample F-test. This guide will show you step by step how to perform such a test using Excel to compare the variables of two pharmaceutical companies in terms of their research expenses.
Key insights
- You will learn how to compare the variance of two groups using an F-test.
- The guide includes detailed steps for conducting the test in Excel, including using the Data Analysis function.
- By the end, you will know how to interpret the results and draw conclusions.
Step-by-Step Guide
Step 1: Prepare Data
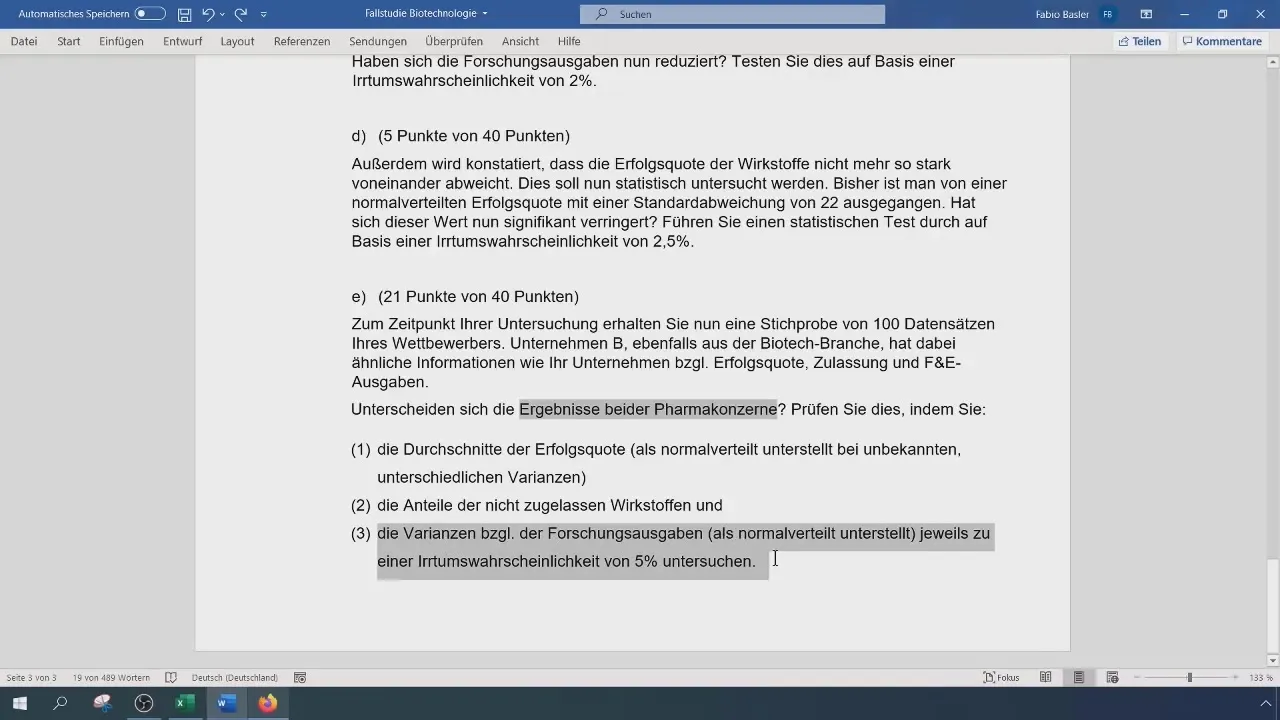
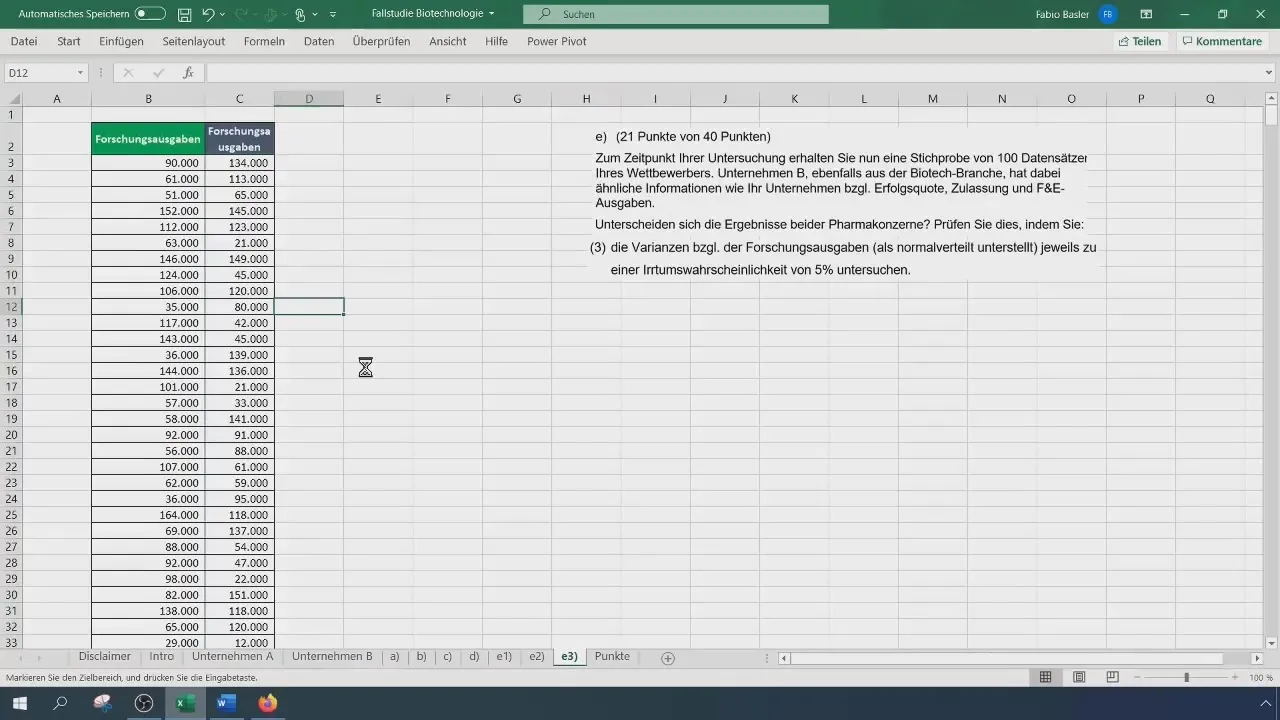
First, you need the raw data of the research expenses of the two companies. Open your Excel file and copy the respective research data of the two companies into separate columns.

Step 2: Calculate Sample Size and Variance
Your sample size remains at 500 for Company A and 100 for Company B. To calculate the data variance, use the VAR.S() function to estimate the variance for the groups. Make sure to enter the values in Excel format to get accurate results.
Step 3: Formulate Hypotheses
For the F-test, the hypotheses need to be set as follows:
- Null Hypothesis (H0): σ1² = σ2² (The variances of the two companies are equal).
- Alternative Hypothesis (H1): σ1² ≠ σ2² (The variances of the two companies are unequal).
Step 4: Calculate Test Statistic
Calculate the test statistic (F-statistic) by the ratio of the two variances. Use the formula Variance_A / Variance_B. If you have entered the variances correctly, you will get an F-statistic for comparison.
Step 5: Determine Critical Value
To determine the critical F-value, you need the alpha level (usually 0.05) and the degrees of freedom. Degrees of freedom are calculated as follows: df1 = n1 - 1 and df2 = n2 - 1. Calculate the critical value using the F.INV() function.

Step 6: Make a Decision
Compare the calculated F-statistic with the critical F-value. If the F-statistic is greater than the critical value, reject the null hypothesis; otherwise, do not. In this example, the criterion for rejection is that the test statistic must be smaller than the quantile value (critical F).
Step 7: Use Excel Data Analysis
Excel also provides the option to perform the F-test through the Data Analysis function. Go to "Data" and select "Data Analysis." Choose the "Two-Sample F-Test." Enter the ranges of the two variables and select the appropriate settings.

Step 8: Interpret Results
Analyze the results of the F-test. If the calculated F-statistic and the p-value in the Excel output match the results of your manual calculation, you can conclude that the variances of the two companies are equal.
Summary
The two-sample F-test is an essential tool in statistical analysis that allows you to compare variances between two groups. In this guide, you have learned how to effectively perform this test in Excel, from preparing the data to interpreting the results.
Frequently Asked Questions
What is the two-sample F-test?The two-sample F-test compares the variances of two groups to determine if they are statistically significantly different.
When should I use an F-test?An F-test is used when you want to test the equality of variances in two independent groups.
How do I calculate the F-statistic?The F-statistic is calculated by dividing the variance of the first group by the variance of the second group.
What should I do if the null hypothesis is rejected?If the null hypothesis is rejected, you can assume that the variances of the two groups are statistically significantly different.
Are there alternatives to the F-test?Yes, you can also use the Bartlett test or Levene test if you want to test the homogeneity of variance.


