The Chi-Square Goodness of Fit Test provides a simple method to test the hypothesis of whether a given data set follows a normal distribution. In this guide, you will learn how to perform the Chi-Square test in Excel to determine if smartphone sales follow a normal distribution. We will guide you through the process step by step, from creating a grouped frequency table to calculating the test statistic and comparing it with the critical Chi-Square value.
Main Takeaways
- The Chi-Square Goodness of Fit Test helps in testing normal distributions.
- Creating a grouped frequency table is essential.
- The test statistic is compared with a critical value to reject or accept the null hypothesis.
Step-by-Step Guide
Step 1: Prepare Data
To conduct the Chi-Square test, you first need the data. Copy the smartphone sales into an Excel worksheet. Ensure your data is organized in a single column.

Step 2: Create Histogram
To get initial visual insights on the distribution, create a histogram of your data. Go to "Insert" and select "Charts." Add a histogram by selecting the data range.

Step 3: Create Grouped Frequency Table
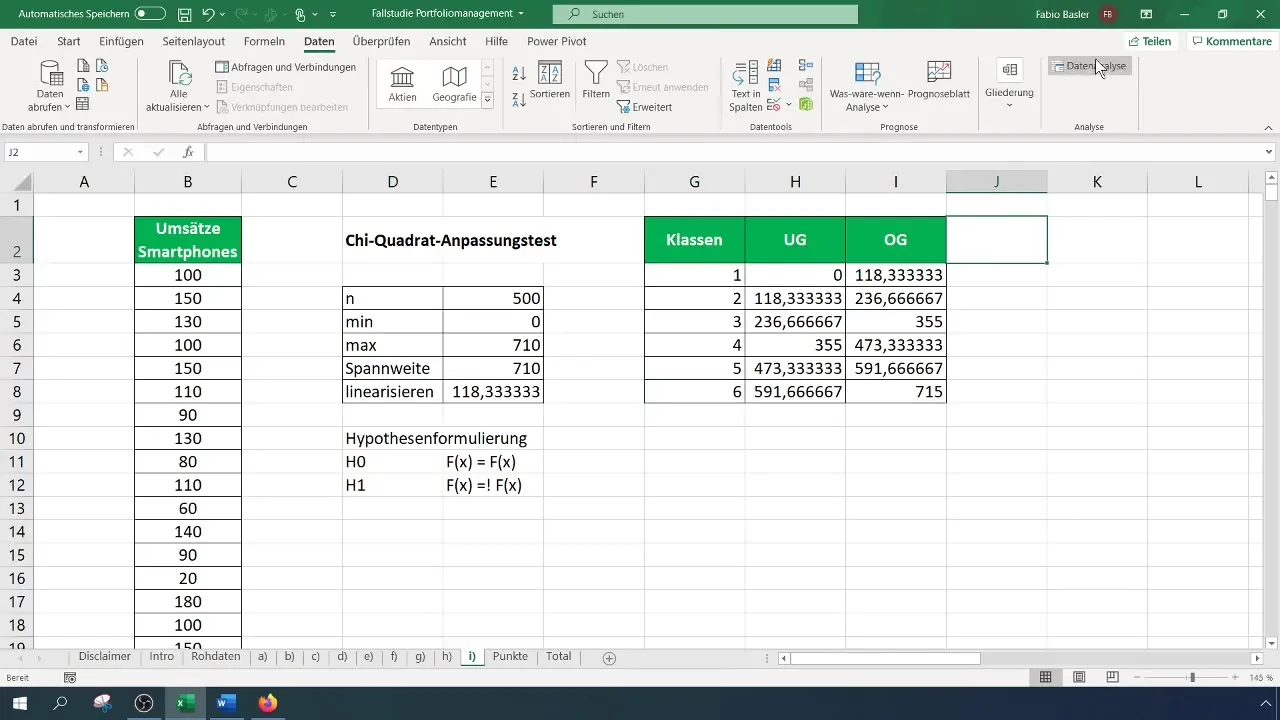
For the Chi-Square test, you need a grouped frequency table. Determine the number of classes for your table – in this case, we are using six classes. Calculate the interval width and create the table accordingly.

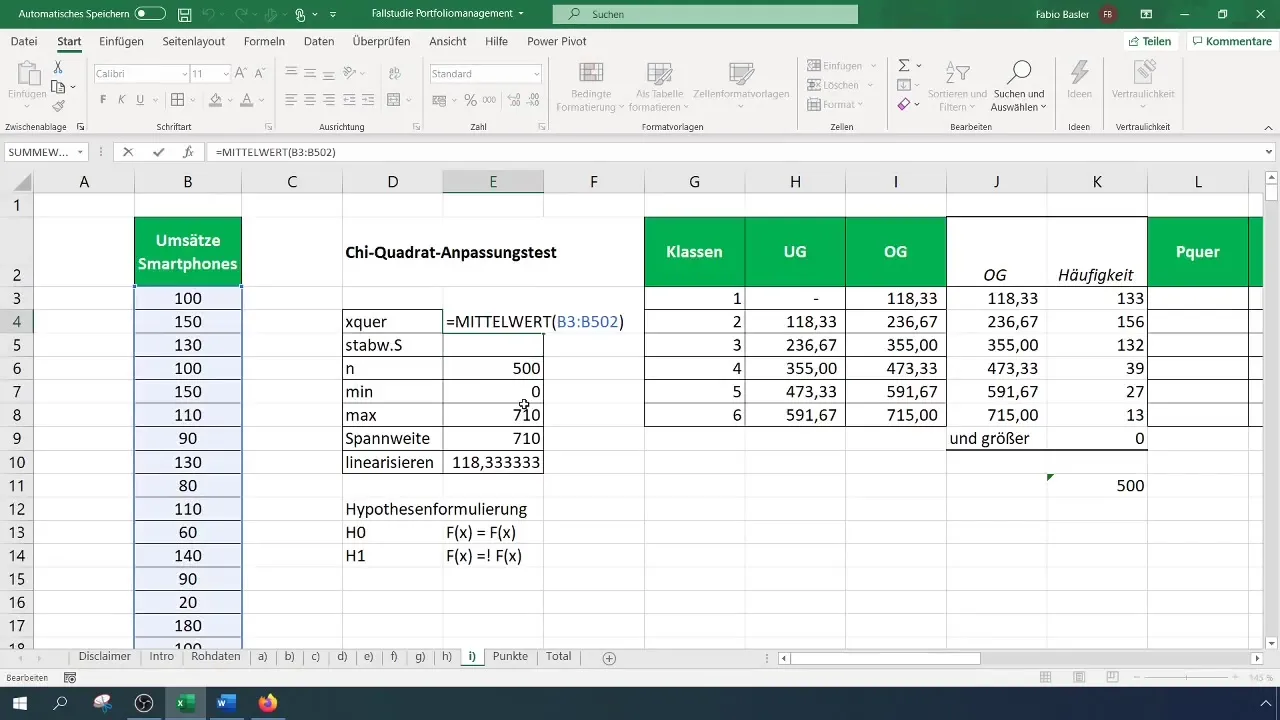
Step 4: Calculate Frequencies
Now, you need to calculate the observed frequencies for each class. Go to "Data Analysis" from the menu and select "Histogram." Choose the input range for your data and the class boundaries. Determine the output range for the frequency table.
Step 5: Calculate Expected Frequencies
To determine the expected frequencies, calculate the probabilities for each class based on the assumed normal distribution. You will need the mean and standard deviation of your data for this computation.
Step 6: Calculate Test Statistic
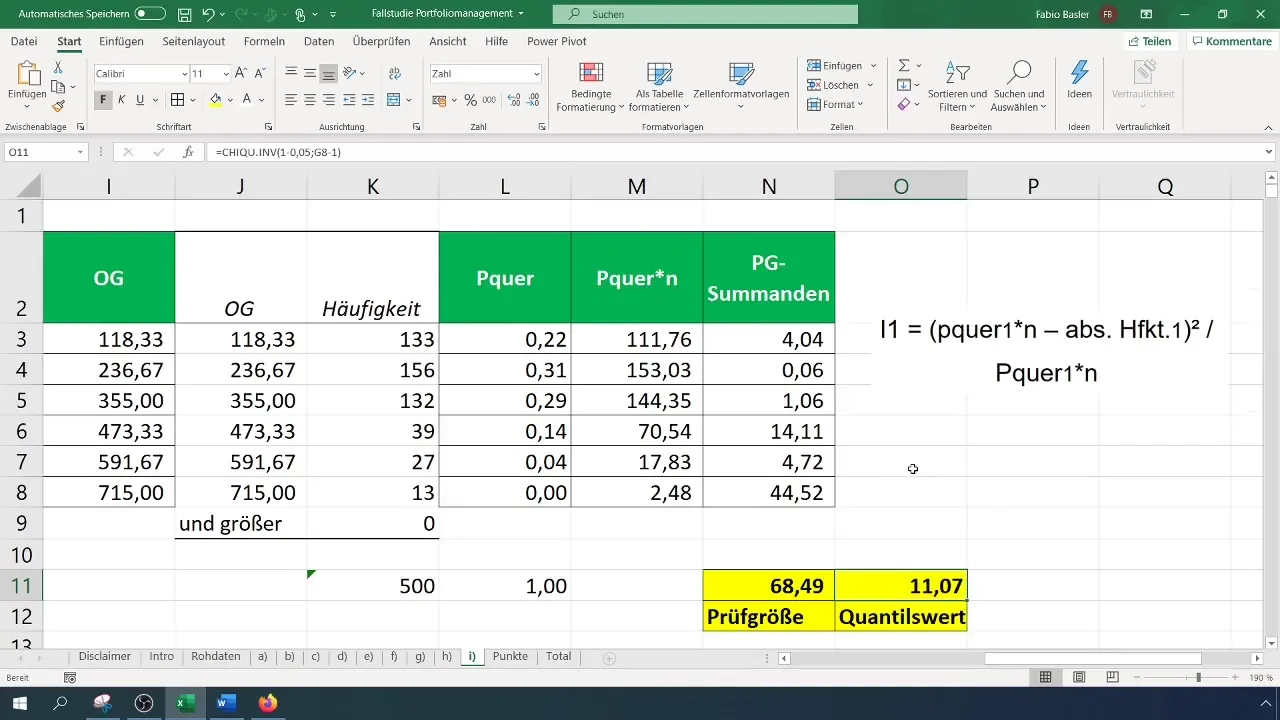
Calculate the test statistic (Chi-Square) using the formula:
[ \chi^2 = \sum \frac{(O_i - E_i)^2}{E_i} ]
where (O_i) are the observed frequencies and (E_i) are the expected frequencies. You can perform this calculation in Excel by storing the individual components in separate cells.

Step 7: Calculate Critical Value
To evaluate the test statistic, you need to calculate the critical value ( \chi^2 ) for your confidence level and the degrees of freedom. The degrees of freedom for the Chi-Square test is (k - 1), where (k) is the number of classes.
Step 8: Check Hypotheses
Compare your calculated test statistic with the critical value. If the test statistic is greater than the critical value, reject the null hypothesis, indicating that the data is not normally distributed. Otherwise, accept the null hypothesis.

Step 9: Summarize Results
Record your results and expand them with graphical data and hypothesis testing. Don't forget to check your histogram to visually confirm that the distribution is not normal.

Summary
Throughout this guide, you have learned how to perform the Chi-Square Goodness-of-Fit Test in Excel to analyze the normal distribution of your smartphone sales. The steps include creating a grouped frequency table, calculations for the expected frequencies, the test statistic, and finally comparing them with the critical value.
Frequently Asked Questions
What is the Chi-Square Goodness-of-Fit Test?The Chi-Square Goodness-of-Fit Test checks whether the observed frequency distribution matches a normal distribution.
How many classes do I need for the frequency table?Typically, a minimum of 5 to 10 classes is recommended to analyze the data effectively.
What should I do if the null hypothesis is rejected?If you reject the null hypothesis, it means that the data is not normally distributed.
How do I calculate the critical Chi-Square value?The critical value is obtained by reading a Chi-Square distribution table based on the degrees of freedom and desired significance level.


