Statistical tests are an essential tool in data analysis and interpretation, especially in areas such as biotechnology, where accurate results are crucial. In this tutorial, I will show you how to perform a one-sample test for the proportion value in Excel. This method is particularly useful for testing whether the proportion of approved active ingredients in a newer study is significantly higher than in the past. Let's get started!
Main Insights
- You will learn how to conduct a one-sample test for a proportion value.
- We will use Excel to analyze and visualize the data.
- The test shows whether the proportion of approved active ingredients has significantly improved.
Step-by-Step Guide
Step 1: Overview of the Task
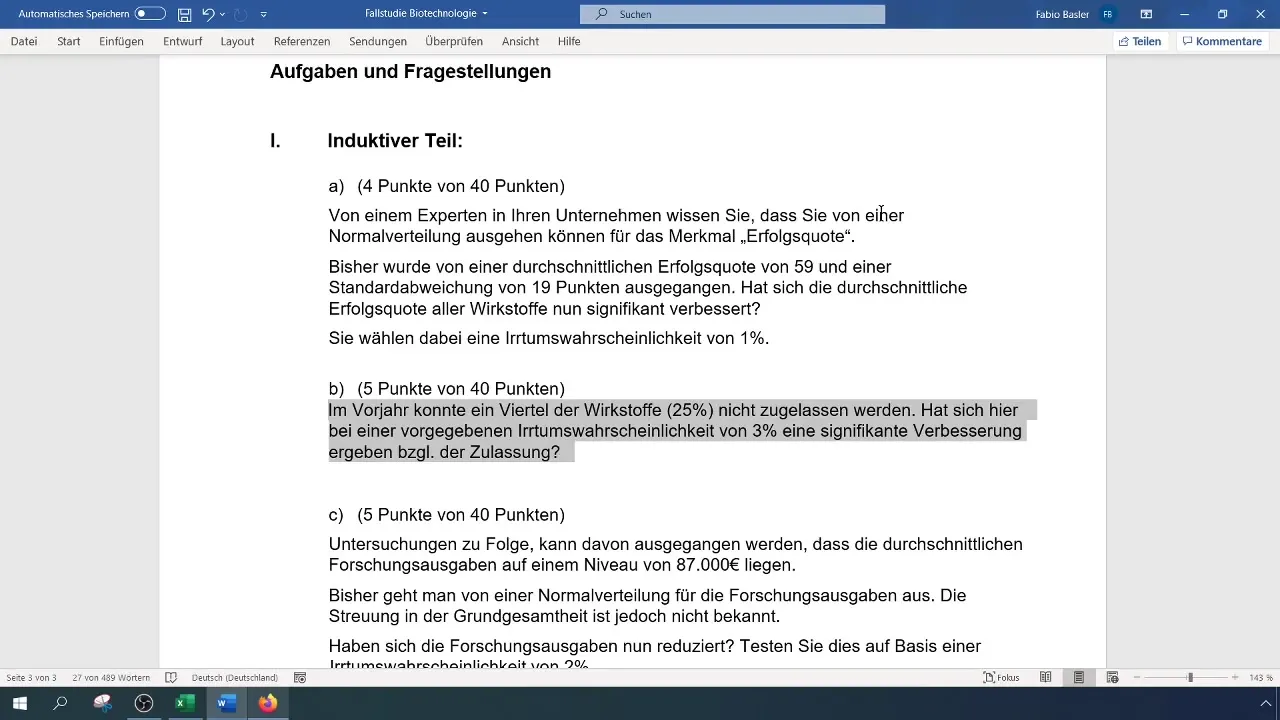
Start by reading the task description carefully. We have a situation where 25% of active ingredients were not approved last year. The goal is to test whether this proportion has significantly decreased with a given error probability of 3%.

The focus is on determining the new proportion value from the current data.
Step 2: Enter Data into Excel
First, you need to enter the relevant data into an Excel table. Copy the relevant values into the cells. A clear structure is essential to easily analyze the data later.
Ensure that you have recorded all necessary values, especially the number of approved and non-approved active ingredients.
Step 3: Calculate the Success Rate
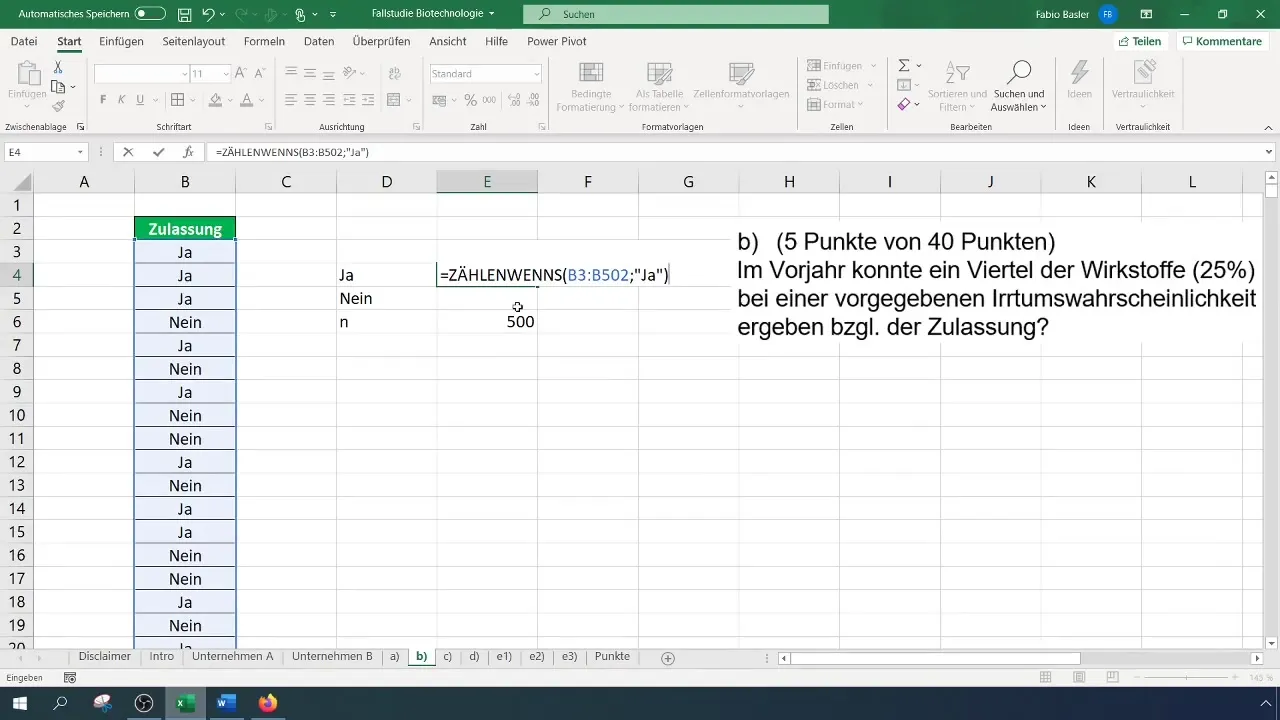
In the next step, you can calculate the success rate. Use the "COUNTIF" function to determine how many of the active ingredients were approved or not approved. This is done by counting how many "Yes" or "No" are present in your data series.
The result of this calculation will give you the proportion of approved active ingredients based on your sample.
Step 4: Formulate Hypotheses
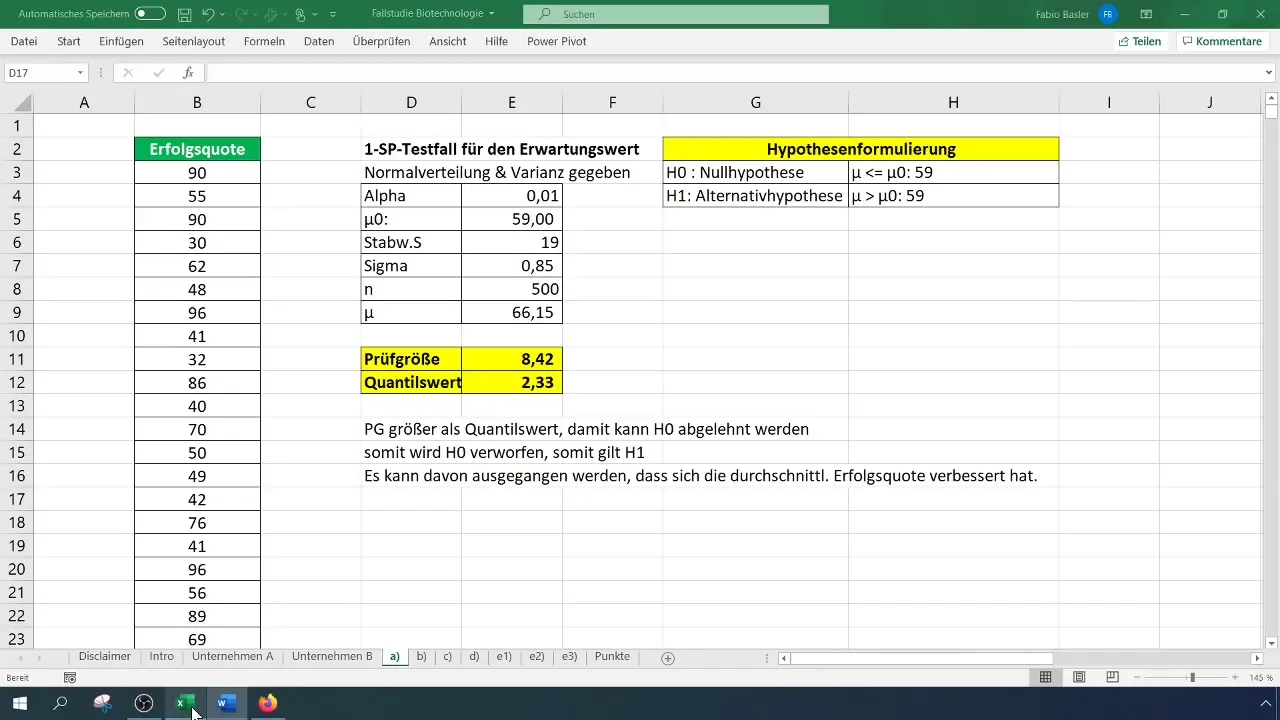
Now formulate your hypotheses. The null hypothesis (H0) is: The proportion of approved active ingredients is equal to 25% (Theta_0 = 0.25). In contrast, the alternative hypothesis (H1) states that the proportion of approved active ingredients is less than 25%.
These hypotheses are crucial for conducting the hypothesis test.
Step 5: Checking for Normal Distribution
To ensure that the normal distribution applies to your data, calculate the criterion ( n \cdot TH_0 \cdot (1 - TH_0) ). This criterion must be greater than 9 to assume normal distribution.
If it meets this criterion, you can proceed with the test.
Step 6: Calculating the Test Statistic
Now it gets a bit more technical. The test statistic is calculated by determining the difference between the current proportion value and the expected proportion value and dividing it by the sigma value.

The calculation of the sigma value is done by the square root of ( \frac{TH_0 \cdot (1 - TH_0)}{n} ). Ensure that all calculations and formulas are entered correctly.
Step 7: Determining the Quantile Value
The next step is to determine the quantile value to assess the significance of your results. An α error of 3% means that you need a quantile value of -1.88 or lower to reject the null hypothesis.

Use the normal distribution table for this calculation.
Step 8: Testing the Hypothesis
Now that you have calculated all values, you can perform the test. Compare the test statistic with the calculated quantile value. If the test statistic is less than the quantile value, you can reject the null hypothesis.
If you reject the null hypothesis, this means that the proportion of approved active ingredients has significantly decreased.
Step 9: Interpreting Results
After testing the hypothesis, it is important to interpret the results. A significant result indicates that the proportion of approved active ingredients has increased.

This is of great importance for biotech companies, as it reflects the success of their products and a higher approval rate.
Summary
In this guide, you have learned how to conduct a one-sample test for the proportion in Excel. You have followed the steps from data entry to hypothesis formulation, calculation of the test statistic, and testing the hypothesis itself. This process is crucial for evaluating the approval rate of active ingredients and can provide significant insights into product development.
Frequently Asked Questions
How do I perform a one-sample test in Excel?You enter the data in Excel, formulate the hypotheses, calculate the test statistic, and compare it with the critical value.
What is a null hypothesis?The null hypothesis is an assumption that states that there is no significant difference.
How do I calculate the sigma value?The sigma value is calculated as the square root of ( \frac{TH_0 \cdot (1 - TH_0)}{n} ).
What does it mean to reject the null hypothesis?This means that the proportion of approved active ingredients is significantly lower than expected.
What is the difference between the null hypothesis and the alternative hypothesis?The null hypothesis assumes no difference, while the alternative hypothesis postulates a difference.


