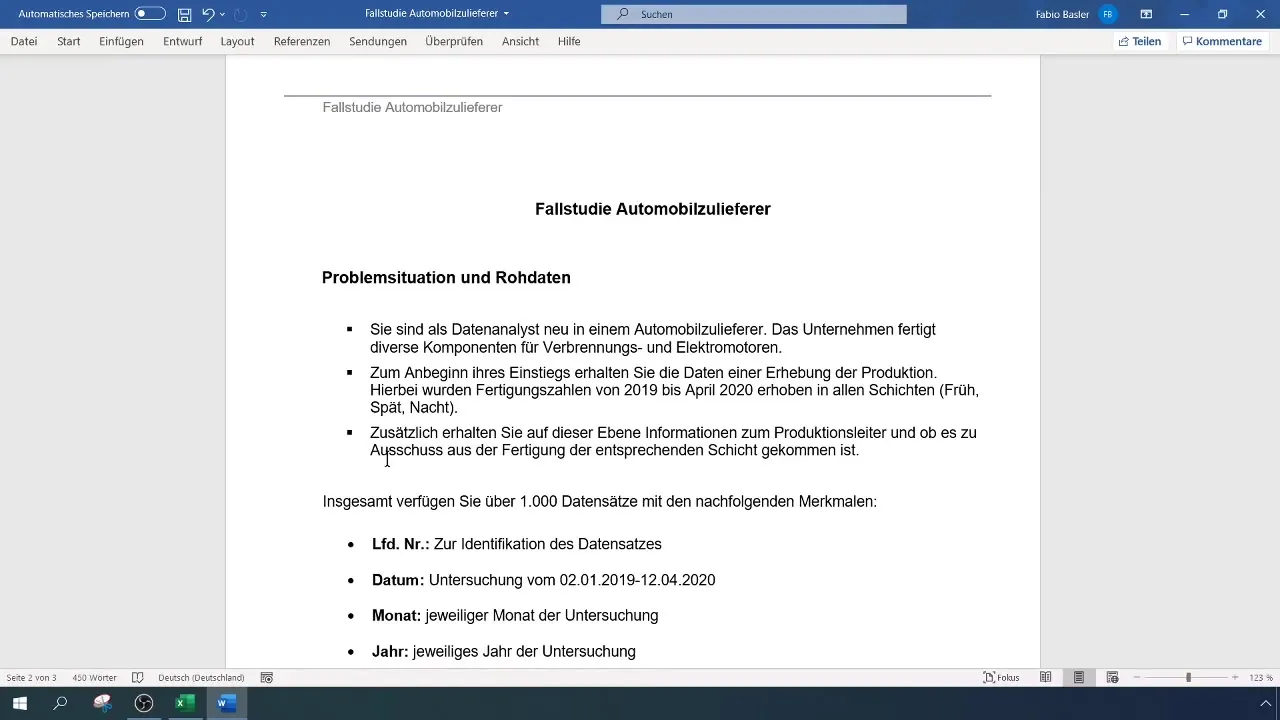
You are right in the middle of an exciting case study focusing on the analysis of production data in the automotive supplier industry. The company where you work as a data analyst manufactures various components for combustion and electric motors. In this guide, you will learn how to analyze relevant data to gain valuable insights and identify trends.
Key Insights
This case study revolves around the raw production data representing a time series of manufacturing figures over a specific period. You will be able to discover patterns and relationships between shifts, production managers, and the scrap rate. Based on this data, you can draw valuable conclusions about production processes and potential optimization approaches.
Step-by-Step Guide
Understanding the Data Structure
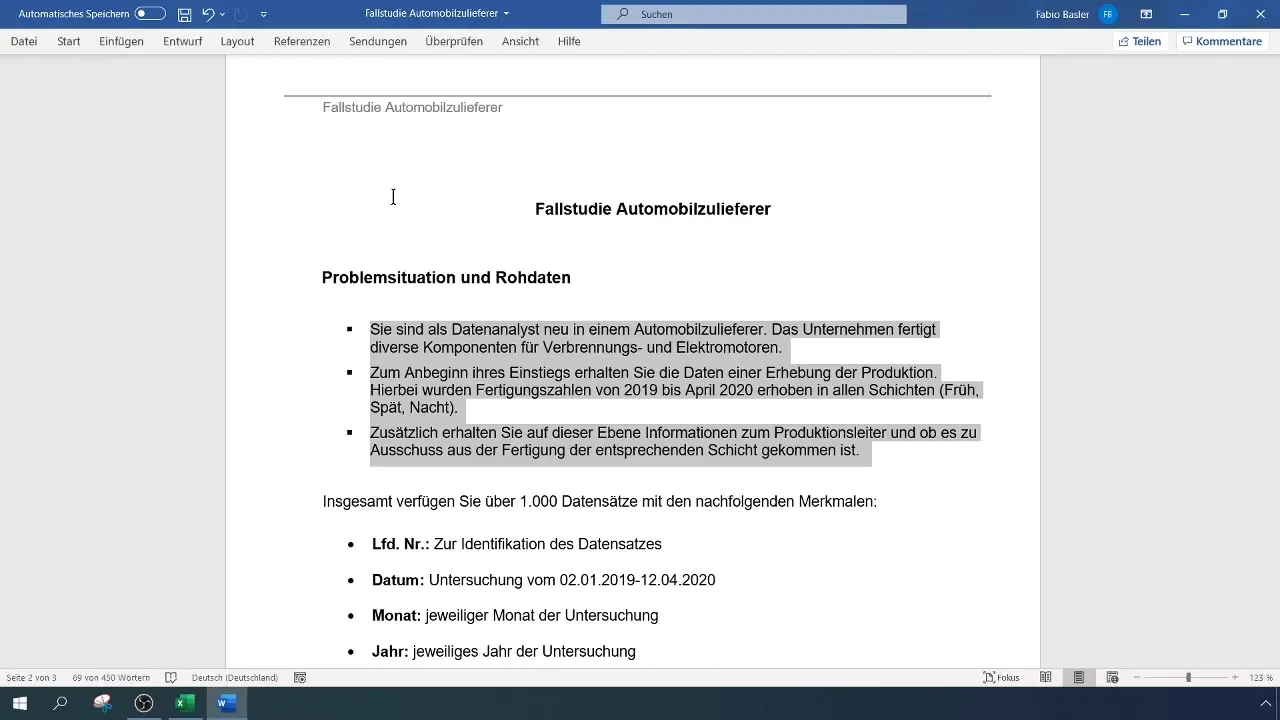
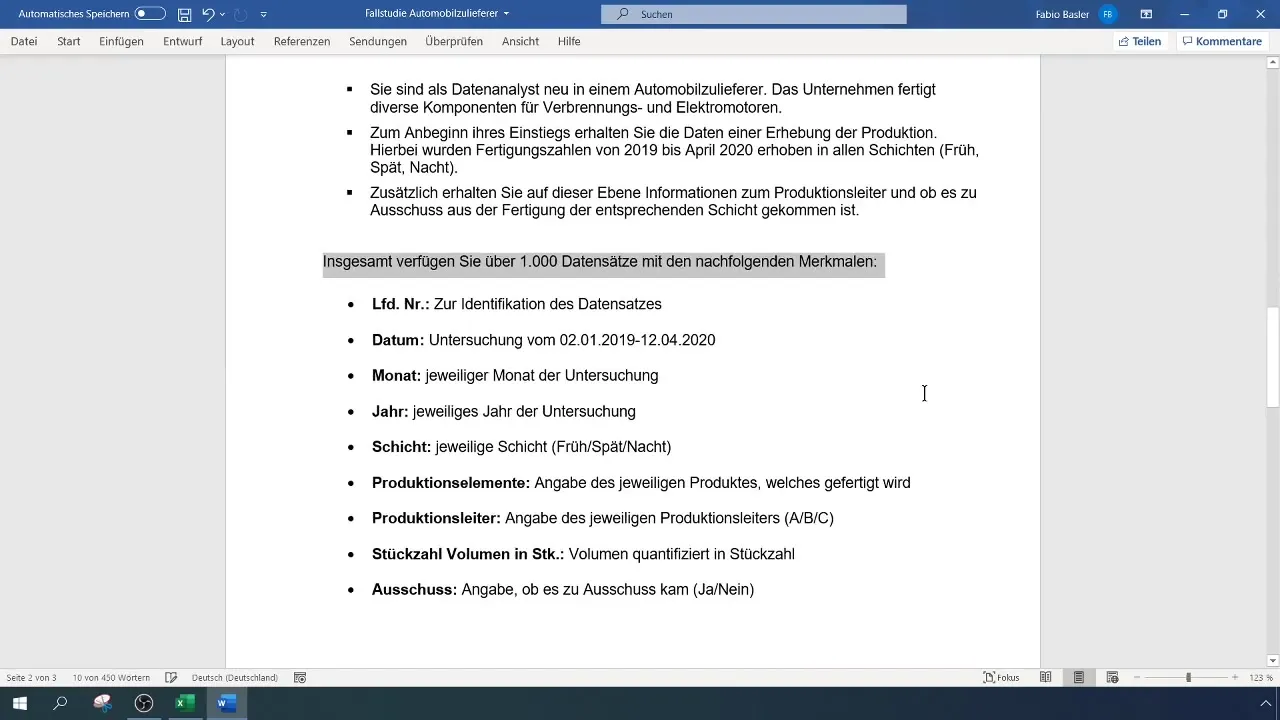
Before you start the analysis, it is crucial to understand the structure of the available data. In total, you will have over 1,000 data records containing the following features:
- Running Number: A reference number from 1 to 1000 for identifying each data record.
- Date and Time: The data was collected from January 2, 2019, to April 12, 2020.
- Month and Year: These details help contextualize the data temporally.
- Shift: Production follows a three-shift model (morning, afternoon, and night shifts).
- Product: Various products such as sealing elements or safety elements are manufactured.
- Production Manager: Each data record is assigned to a production manager (A, B, C).
- Quantity: This refers to the number of parts produced.
- Scrap: This indicator shows whether scrap production occurred in the respective shift.
Preparation in Excel
Before starting the analysis, open Excel and load the raw data available to you. These data are essential for visualizing and evaluating specific information. Ensure all columns are correctly named and individual data points are entered accurately. You will do this to create a clear and organized working environment before commencing the analysis.
Checking Quantity Data
Once the data is loaded in Excel, it is useful to perform an initial check of the quantity data. You can do this by applying a simple sum function to see if the total sum of produced quantities is realistic. This is your first step to identify discrepancies early and exclude incorrectly entered values.

Analysis of Shift Data
A crucial point in your analysis will be comparing production by shifts. Since each shift is assigned different production managers, you can aggregate the data to determine the overall production for each shift. This helps you visualize differences or patterns in production that may be attributed to external factors or internal processes.
Examination of Production Managers
In the next phase of analysis, you should examine the influence of individual production managers. Analyze how productivity varies among different production managers and if there are significant differences in the scrap rate. This information is crucial to evaluate the production team's performance and identify areas where optimizations may be necessary.
Creating Time Series Analysis
Now, it's time to analyze and visualize the time series. Use charts in Excel to track producer activity over the period. You can use various graphs to identify trends in production and depict seasonal fluctuations or anomalies. This is crucial for generating forecasts for future production periods.
Formulating Forecasts
With your time series analysis in hand, you can now formulate forecasts. Use Excel tools like trend analysis to make predictions based on the data collected so far. Ensure you apply these methods to various time intervals to generate more accurate forecasts.
Summary of Findings
After you have completed the necessary steps for analysis, you should take the time to summarize your findings. Reflect on the data you have gathered and the patterns you have identified. This will help you formulate recommendations for production optimization and possibly contribute to improving production processes in the company.
Summary
By conducting a structured analysis of production data in Excel, you can gain valuable insights into the efficiency of different production shifts. A solid understanding of the various influencing factors will help you make meaningful optimizations and improve the quality of production.
Frequently Asked Questions
How many records are included in the case study?There are a total of 1,000 records available.
What time period do the data cover?The data was collected from January 2, 2019, to April 12, 2020.
Which model is used in production?The company operates on a three-shift model.
Are there different production supervisors?Yes, the data is assigned to production supervisors A, B, and C.
How can I compare production by shifts?You can aggregate the data and calculate totals for each shift.


