Statistical analyses can be a crucial factor for success in financial sales. In this guide, you will learn how to use Excel to examine the revenues of an international investment bank control team. The goal is to analyze the data collected over the past 100 calendar weeks and derive valuable insights about the sales. Prepare to use descriptive and inductive statistics and delve into correlational relationships as well as regression analyses. The focus is on practical applications that can be implemented directly in Excel.
Key Findings
- Using Excel for comprehensive data analysis in financial sales
- Conducting descriptive and inductive statistical analyses
- Importance of selecting and filtering data to avoid errors in calculations
- Creating separate Excel worksheets for different tasks for better clarity
Step-by-Step Guide
Step 1: Preparing the Excel File
To effectively work with the case study, you should prepare your Excel file accordingly. Create a new Excel workbook and set up separate worksheets for each part of the case study. This will facilitate clarity and task management.
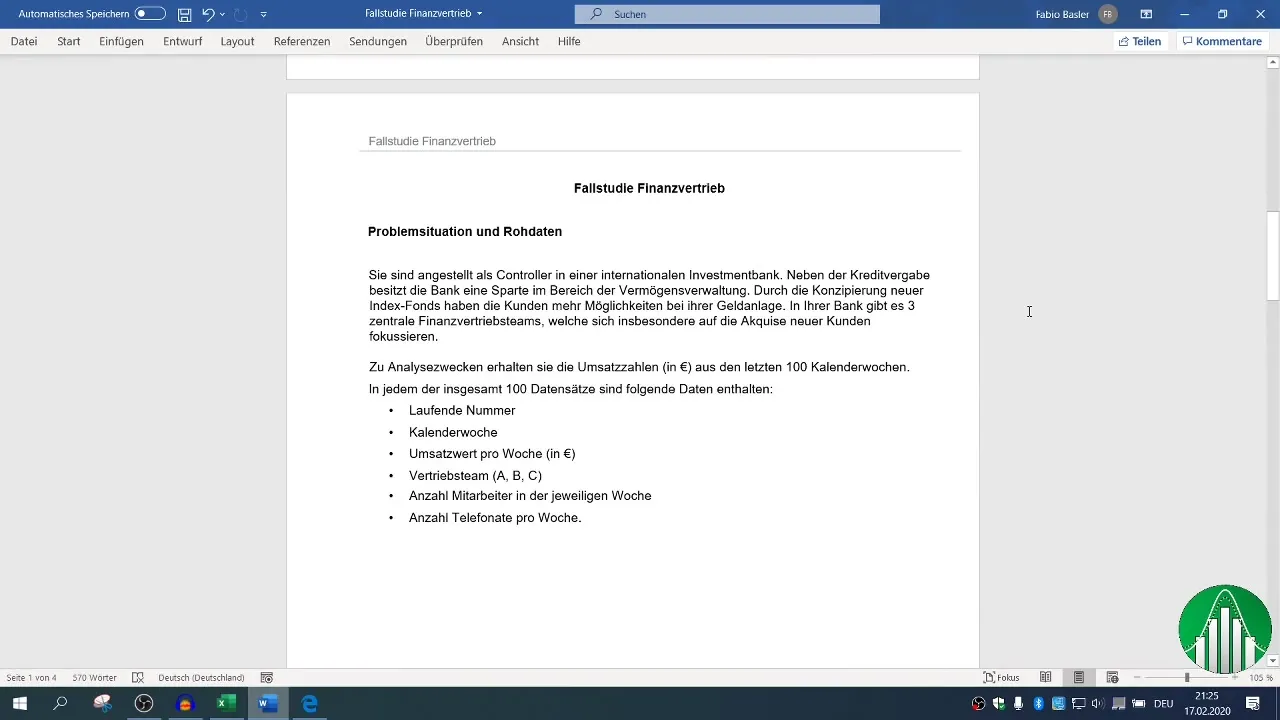
You can easily automate this process by using the keyboard shortcut "Shift + F11" to create a new worksheet. Remember to name the sheets according to the respective tasks for quick access.
Step 2: Understanding the Data Structure
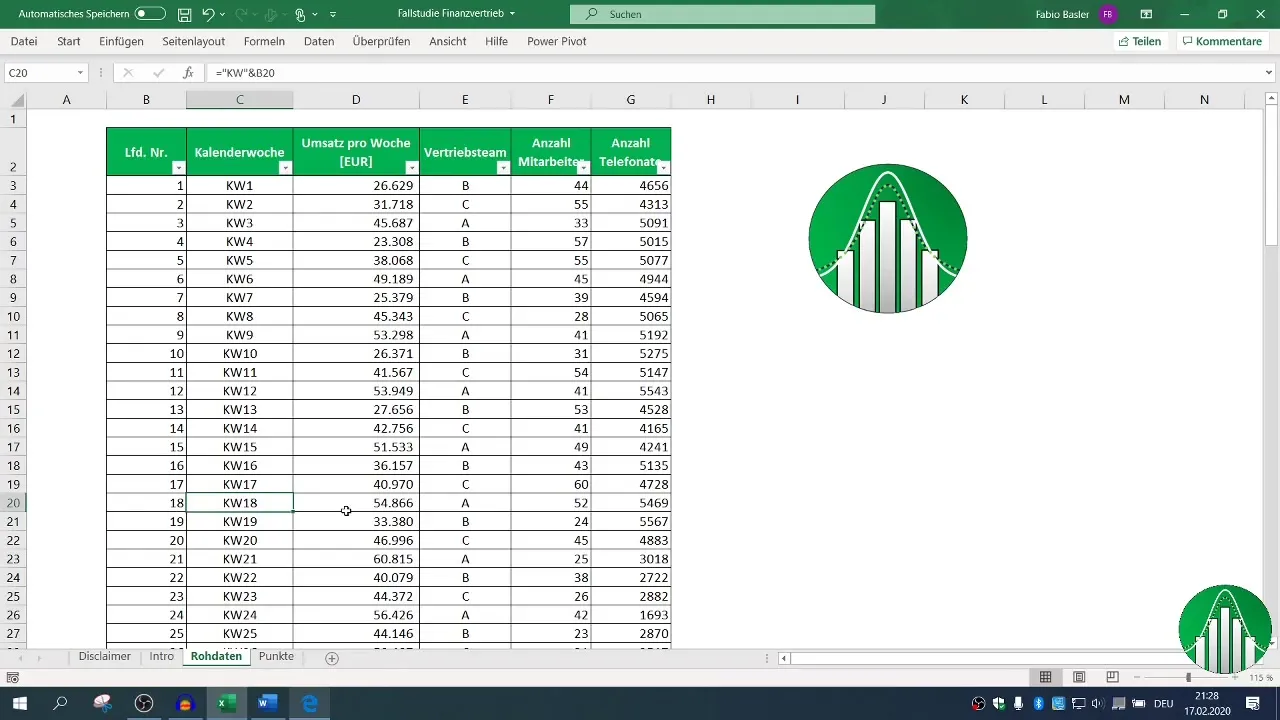
Before starting the analysis, carefully examine the structure of the available dataset. The data includes several features such as calendar week, revenue value, sales team, number of employees, and number of weekly phone calls.
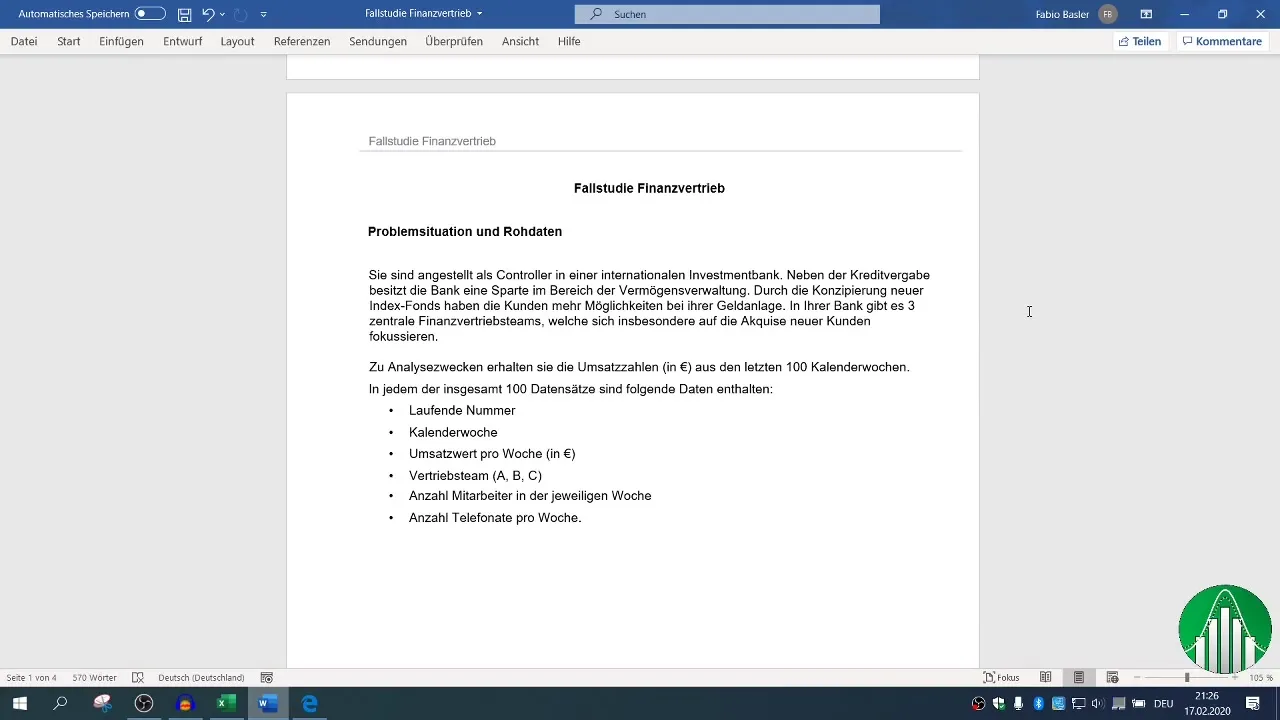
Ensure you have all the necessary information and that the data is correct and complete. It is recommended to copy the data to a separate worksheet before starting the analysis to avoid accidental destruction of the original data.
Step 3: Inclusion in Descriptive Statistics
Once you have prepared the data, you can start the descriptive part of the case study. Focus on initial tasks that will help you determine the basic indicators of revenue development.
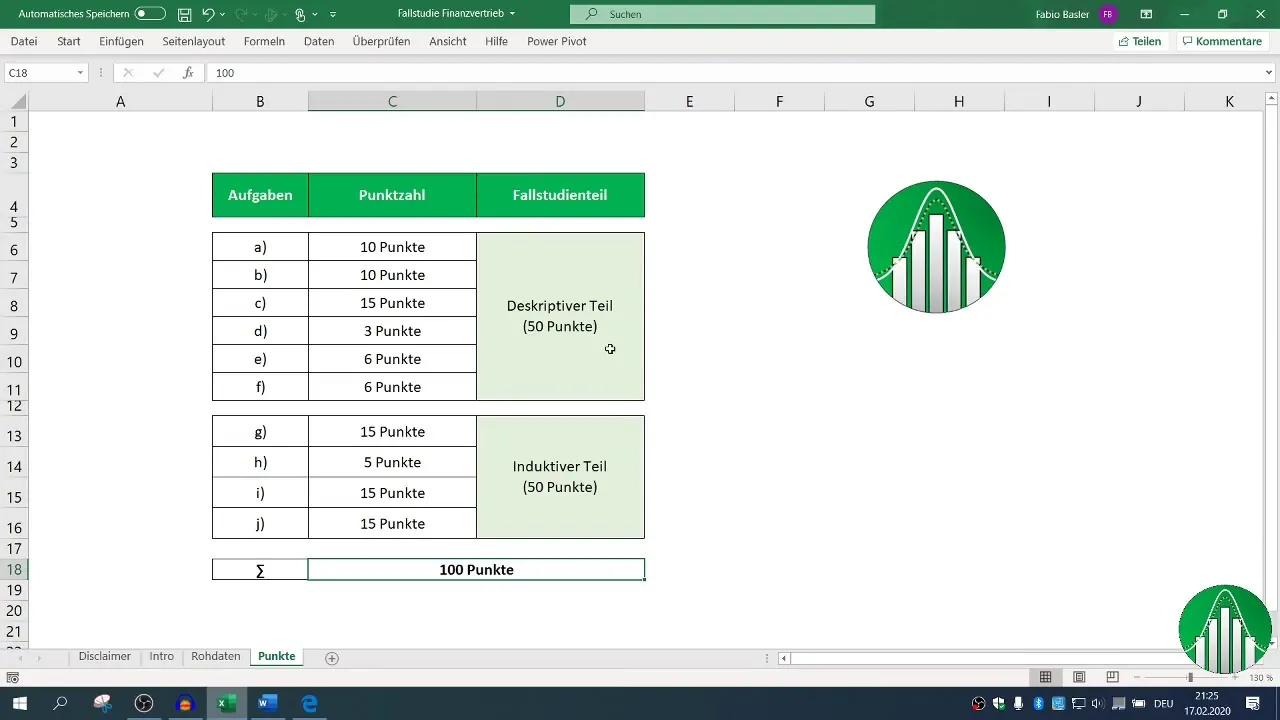
Utilize Excel functions such as "Mean," "Median," and "Standard Deviation." These indicators provide valuable insights into monthly revenue development and help identify trends.
Step 4: Revenue Analysis
It is now time to conduct a detailed analysis of revenue for each sales team. Filter the data by sales teams A, B, and C to determine the specific revenues.
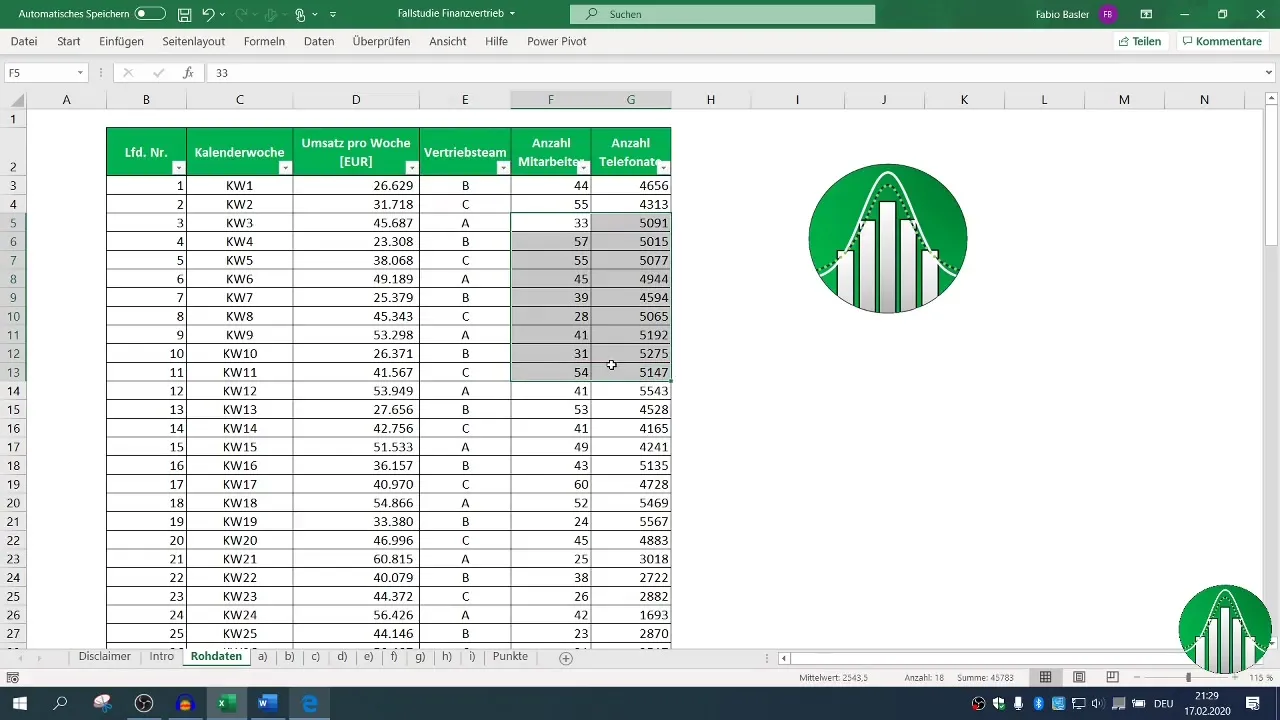
This type of selection is crucial to understand which team was the most successful and what factors contributed to it. Remember to use filtering temporarily to keep the original data unchanged.
Step 5: Conducting a Regression Analysis
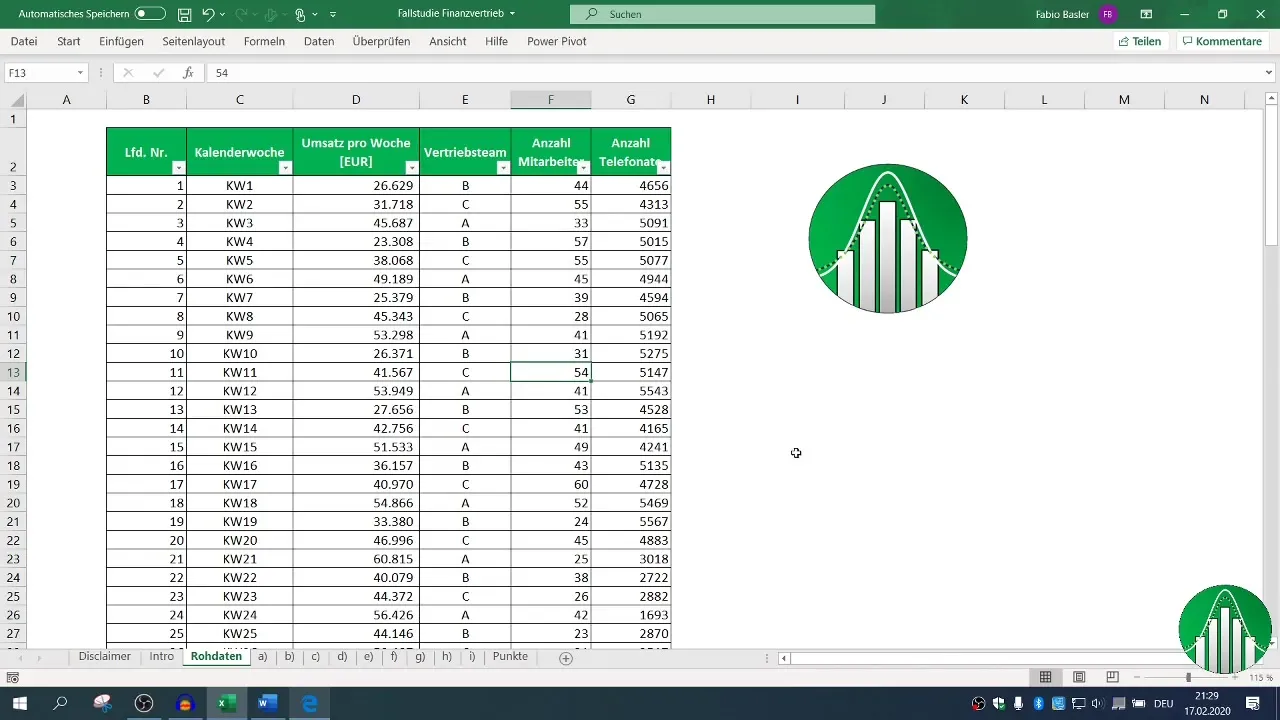
Go beyond basic analysis and perform a regression analysis to examine the relationship between the number of phone calls and revenue values.
Excel provides you with the ability to perform these analyses using integrated tools like the Data Analysis Toolpak. This challenges you to understand the relationships between different variables and what factors influence revenue.

Step 6: Interpreting the Results
The analysis is only complete when you also interpret the results. Consider what the data reveals about customer behavior and team performance. Document your findings and create visualizations, if necessary, to present them vividly.

Afterwards, you can summarize all results in a separate worksheet to have a clear overview.

Summary
Analyzing and interpreting the data of a financial distribution enables you to gain comprehensive insights into the performance of the sales teams. The targeted use of Excel functions helps you not only monitor revenues, but also make strategic decisions for the future.
Frequently Asked Questions
How do I prepare the Excel data for analysis?Create separate worksheets for different parts of the case study and use "Shift + F11" to quickly create new sheets.
Which statistical indicators should I use in the descriptive section?Focus on mean, median, and standard deviation to determine the basic indicators of revenues.
How do I conduct a regression analysis in Excel?Use the data analysis tool pack in Excel and select the regression analysis option to examine relationships between variables.
Why is it important to copy data to separate sheets?This prevents original data from being unintentionally altered and allows for a clean separation of respective tasks.


