Using Excel for conducting data analyses provides you with valuable insights for decision-making in business and sales. After creating basic charts, you will now be able to generate a forecast for future revenue values by applying a linear trend function. This guide will show you how to efficiently use this function to realistically estimate future developments.
Key Findings
- Utilization of Excel tools for calculating and visualizing linear trend functions.
- Conducting revenue forecasts up to the 110th week.
- Graphical representation of trends for easier analysis and decision-making.
Step-by-Step Guide
To implement a trend function in Excel, follow these steps:
Prepare Data
Firstly, it is important to prepare your datasheet accordingly. You already have a time series that includes weekly revenues. Make sure this information is well structured in your Excel table. You can copy the numbers up to the 110th week and paste them into your new task assignment (Task F) to create your forecast.
Freeze Top Row
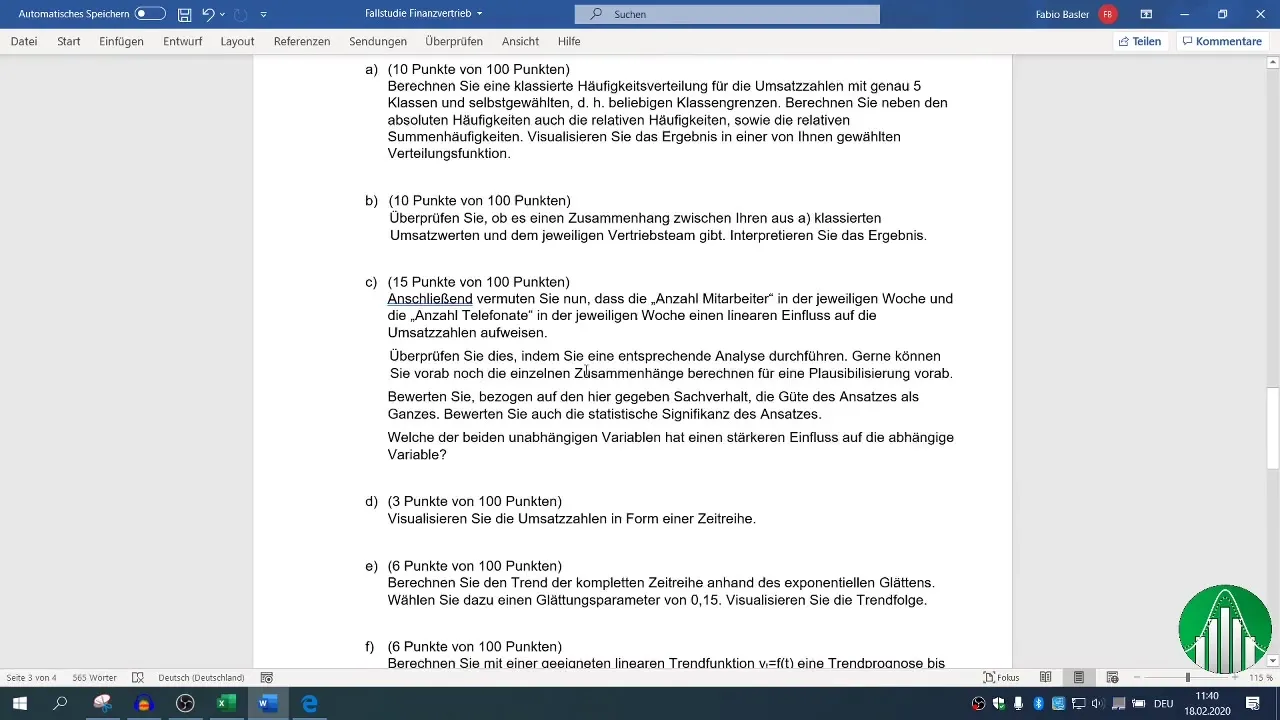
To keep your data organized when creating charts and calculations, you can freeze the top row of your table. Go to "View" and select "Freeze Panes". This is particularly helpful when scrolling through longer datasets, as it keeps the header visible at all times.
Visualize Data
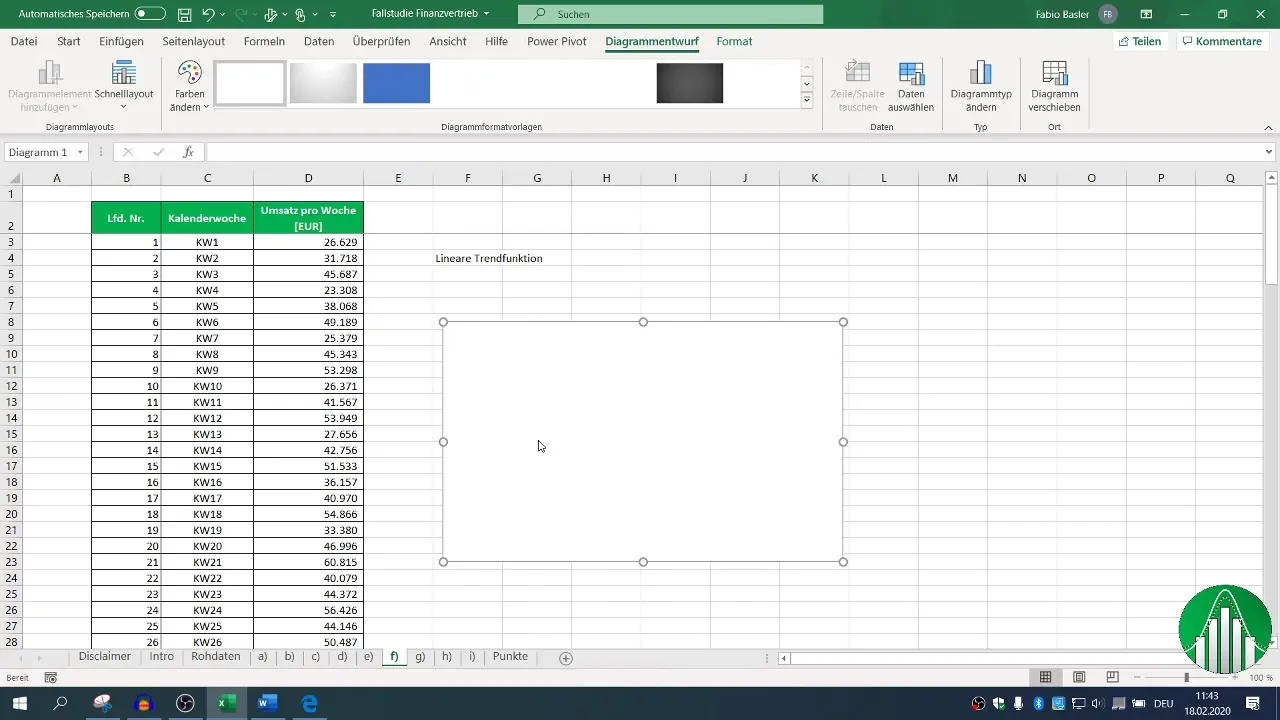
To get a sense of the trend in your weekly revenues, visualize the data in a line chart. Select the relevant data up to the 100th week, go to "Insert," and choose "Line Chart." This will provide you with a graphical representation that helps you identify ups and downs.
Add Trendline
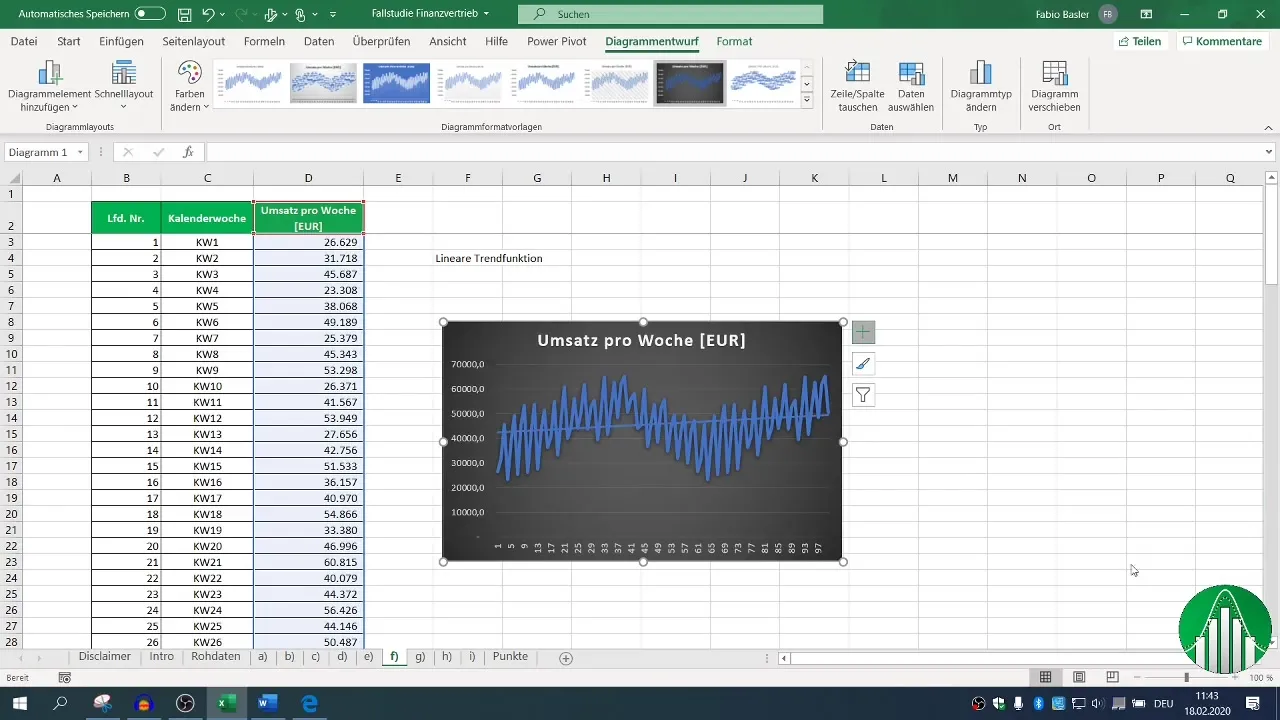
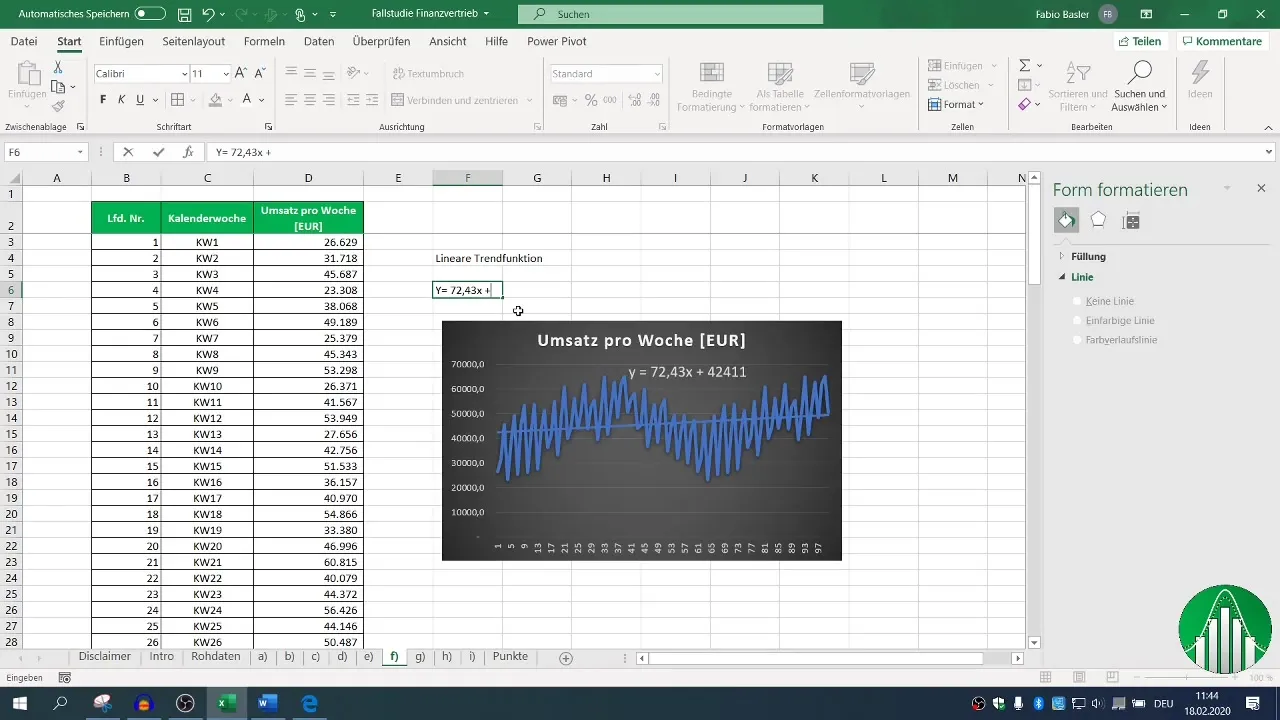
To create a forecast for the upcoming weeks, add a trendline to your chart. Right-click on the chart, select "Select Data Series," and add your revenue data for the first 100 weeks. Then, using the plus sign on the chart, choose and display the trendline.
Determine Trend Formula
Excel can automatically calculate the trend formula to estimate future values. You can record the formula for the trendline, which will look something like this: ( y = 72.43x + 42411 ). The first part describes the slope of the line, while the second part defines the intercept.
Calculate Forecast Values
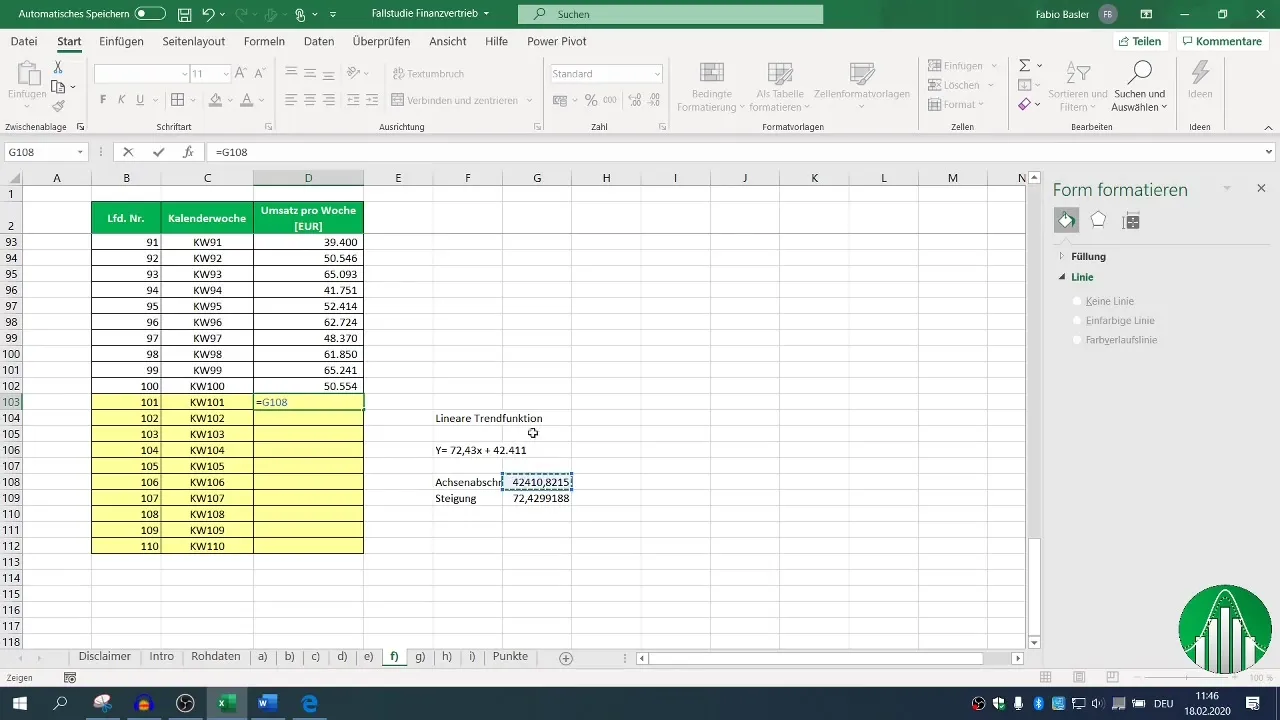
To generate forecasts for future calendar weeks, you can use Excel functions. The intercept and slope play a crucial role here. Enter the formulas for these two values in Excel to calculate the numbers for weeks 101 to 110.
Apply Forecast
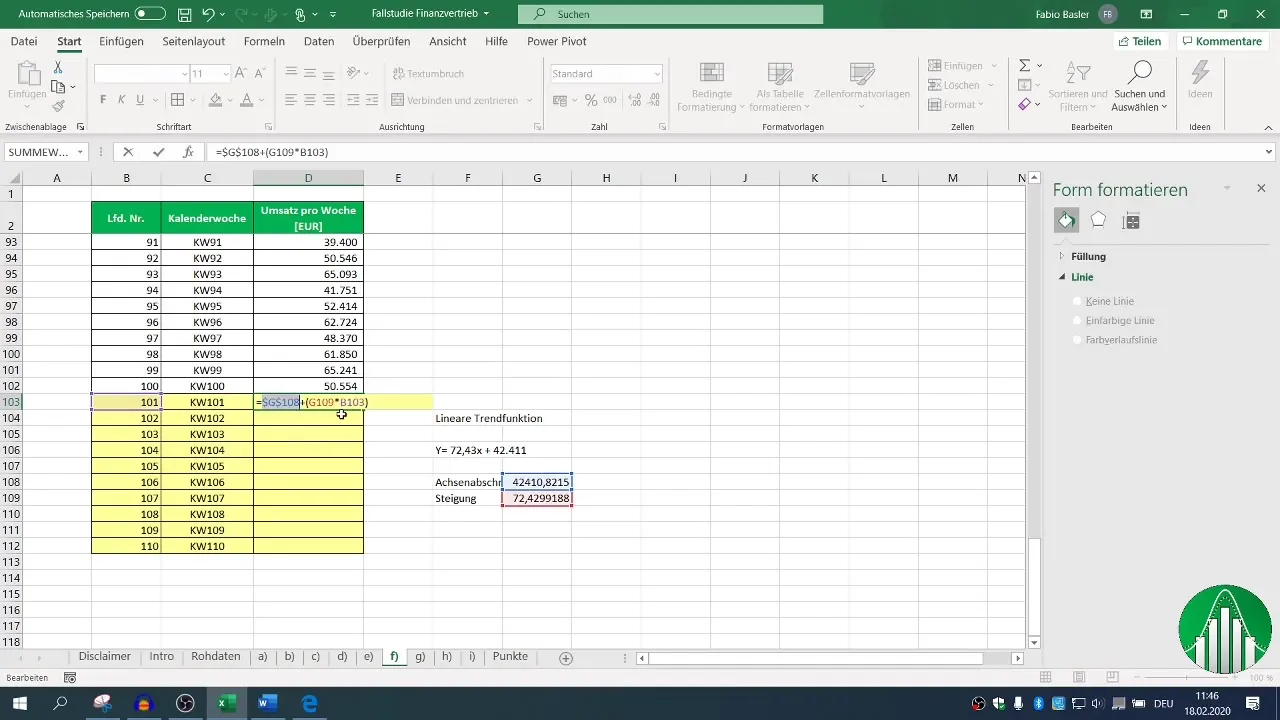
Now apply the calculation and drag the corresponding formulas down to create the forecast for each future week. Make sure to use absolute references (with F4) for the intercept and slope values so that they are not altered when dragged down.
Update Chart
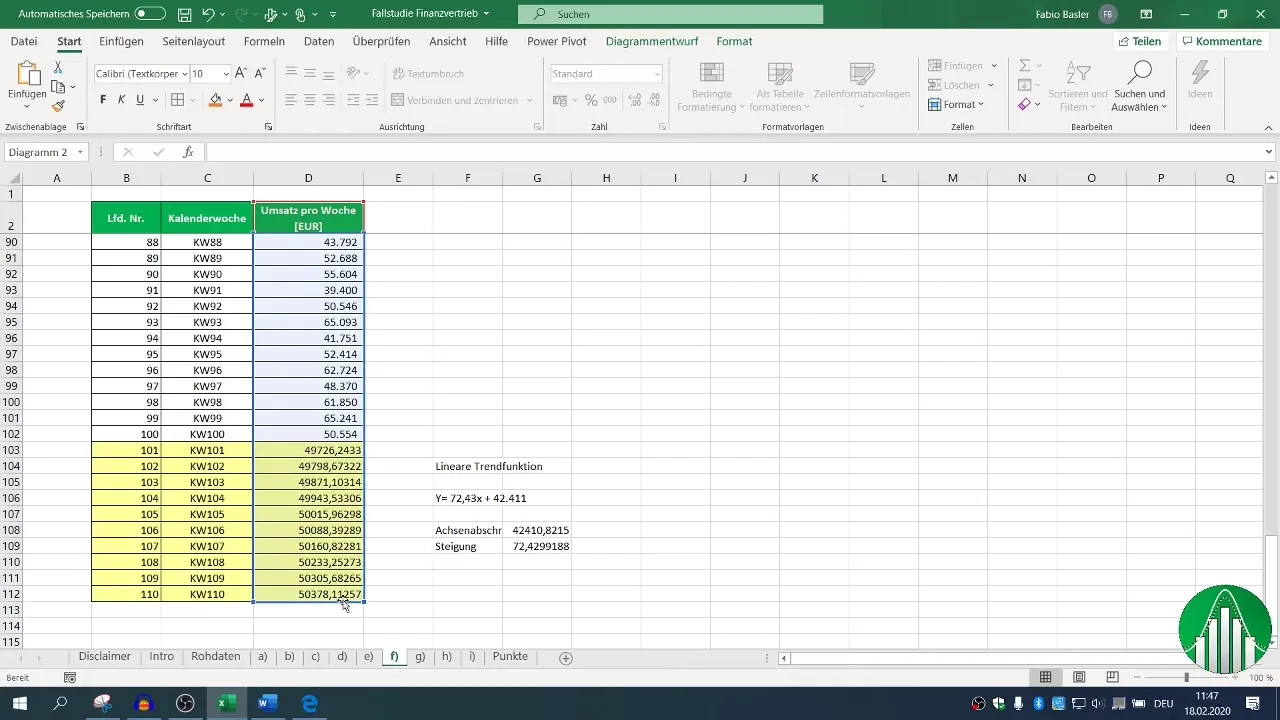
Once all forecasted values are calculated, you should update your original chart to display the new revenue forecasts. Copy the chart and paste it into your worksheet. Drag the data range from the original values to the new ones to adjust the visualization of the forecast data.
Summary
In this tutorial, you have learned how to set up a linear trend function in Excel to forecast future sales values. By applying various functions and tips, you will gain a better understanding of your sales data and its future development.
Frequently Asked Questions
How do I add a trendline in Excel?Right-click on the chart, select "Select Data," and then "Add Trendline."
How do I calculate the slope and intercept?Use the "Slope" and "Intercept" functions in Excel to determine these values from your data.
Can I make predictions for other time periods as well?Yes, you can adapt the calculations and formulas to any time period by simply changing the corresponding data range.
How do I use absolute references in Excel?Place a dollar sign ($) before the column and row to ensure that the reference does not change when you copy or drag the formula.


