Statistical hypothesis tests are an important tool for making decisions based on data. In this tutorial, you will learn how to conduct a 1-sample test for the expected value in Excel to determine whether the average revenue of a company has improved after the introduction of a variable compensation system. By applying this method, you will be able to make data-driven decisions and gain valuable insights into your company's performance.
Main Takeaways
- You will learn how to formulate and test hypotheses.
- The test is conducted in Excel using statistical formulas.
- Interpreting the results allows informed decisions on revenue increases.
Step-by-Step Guide
Step 1: Data Collection and Preparation
You have access to a random sample that includes average weekly revenues over a span of 100 weeks. These data form the basis for your test. Start by entering the relevant information into an Excel worksheet.

Step 2: Determining the Hypotheses
Formulate the null hypothesis (H0) and the alternative hypothesis (H1). In your case, the null hypothesis states that the average revenue is equal to or less than €41,000 (m ≤ 41,000). The alternative hypothesis states that the average revenue is greater than €41,000 (m > 41,000).
Step 3: Calculating the Mean and Standard Deviation
Calculate the mean of the revenues from your sample by using the Average function in Excel. To calculate the standard deviation, use the STDEV.S formula as you are working in inductive statistics and need to reduce the degrees of freedom by one.
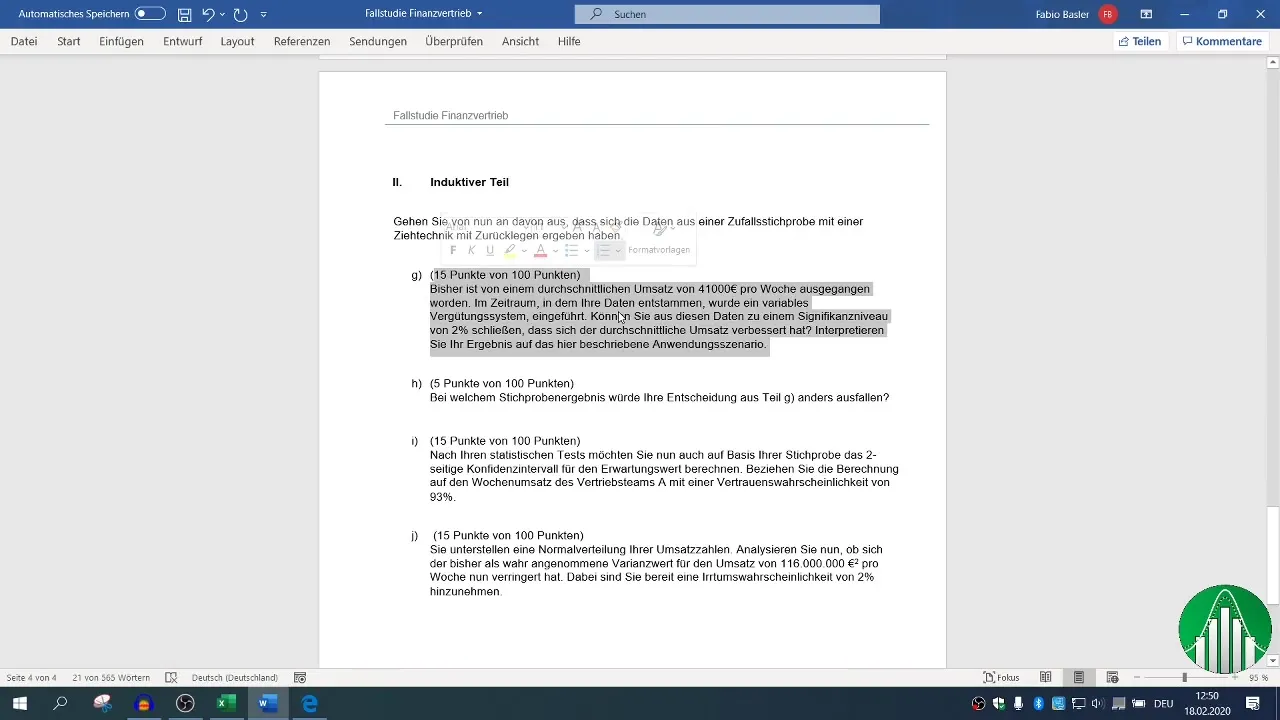
Step 4: Determining the Critical Value
Determine the critical value by using the Excel function NORM.S.INV. Insert 1 - α (0.98) in the arguments. The significance level for your test is 2%.
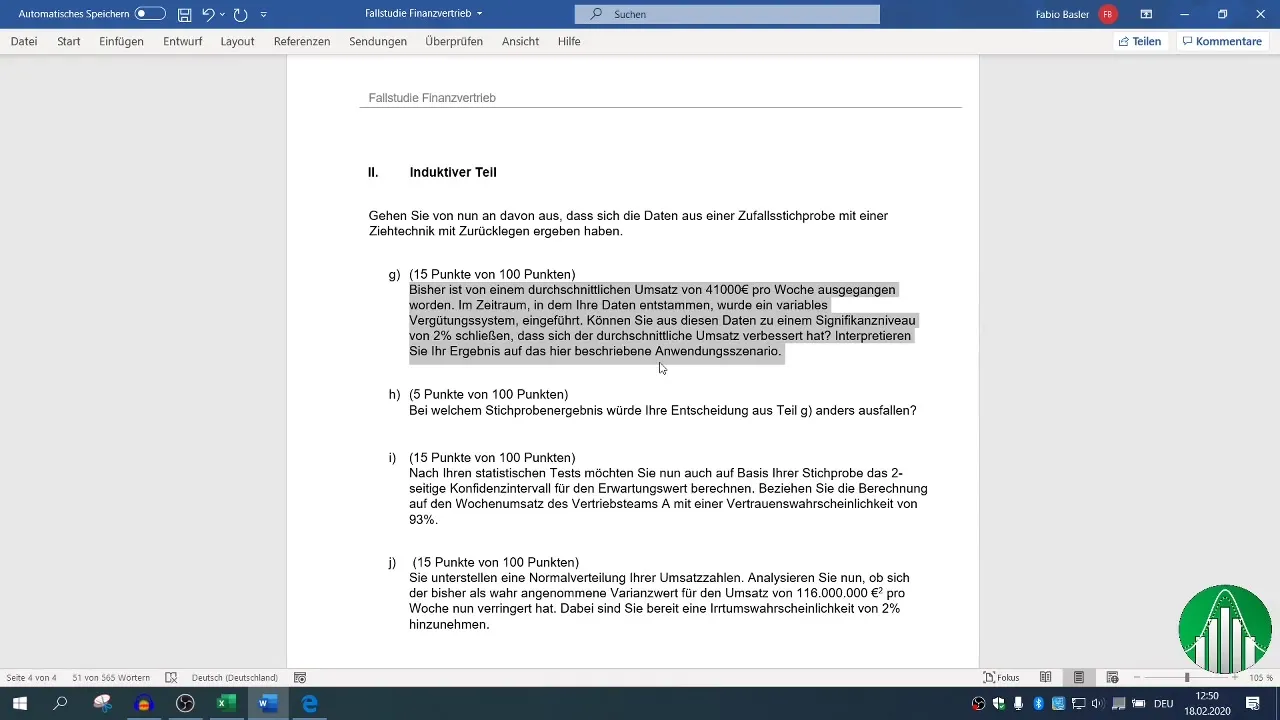
Step 5: Comparing the Test Statistic with the Critical Value
Now compare the calculated test statistic with the critical z-value. If the test statistic is greater than the critical z-value, you can reject the null hypothesis.
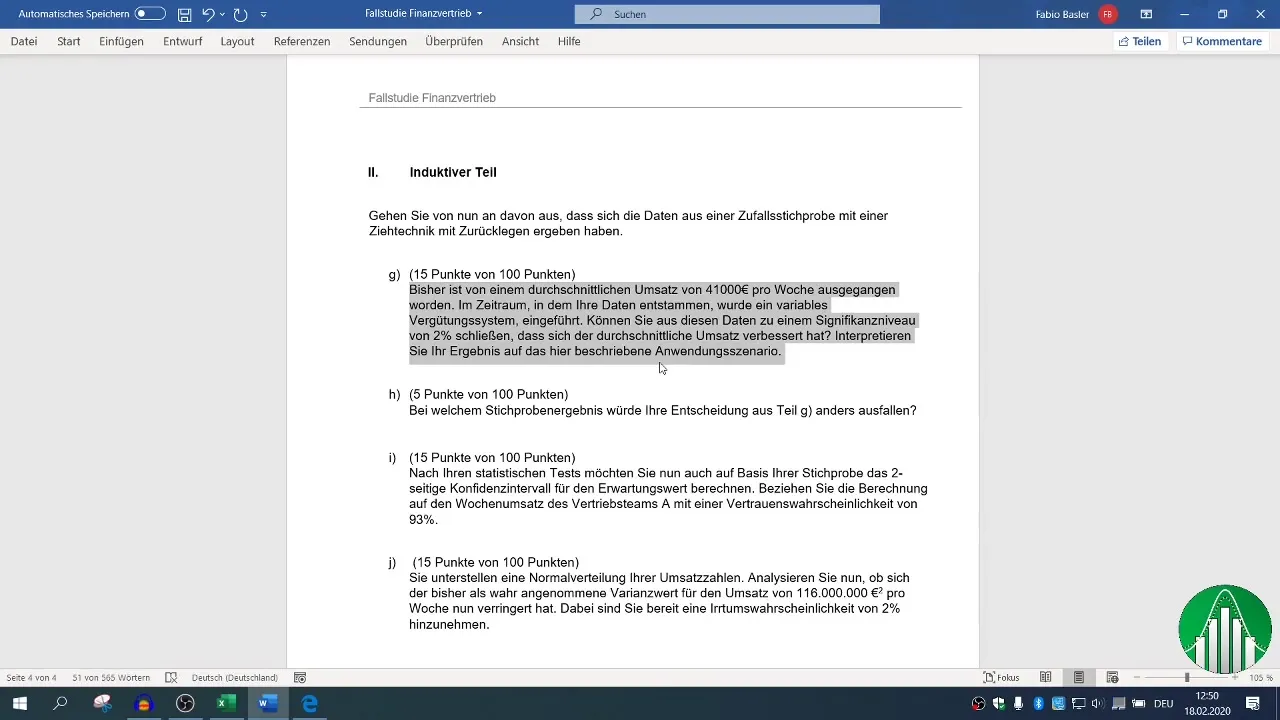
Step 6: Decision on the Hypothesis
If the test statistic is above the critical value, the null hypothesis is rejected, indicating that you can assume the average revenue has improved. Document this decision in your results.
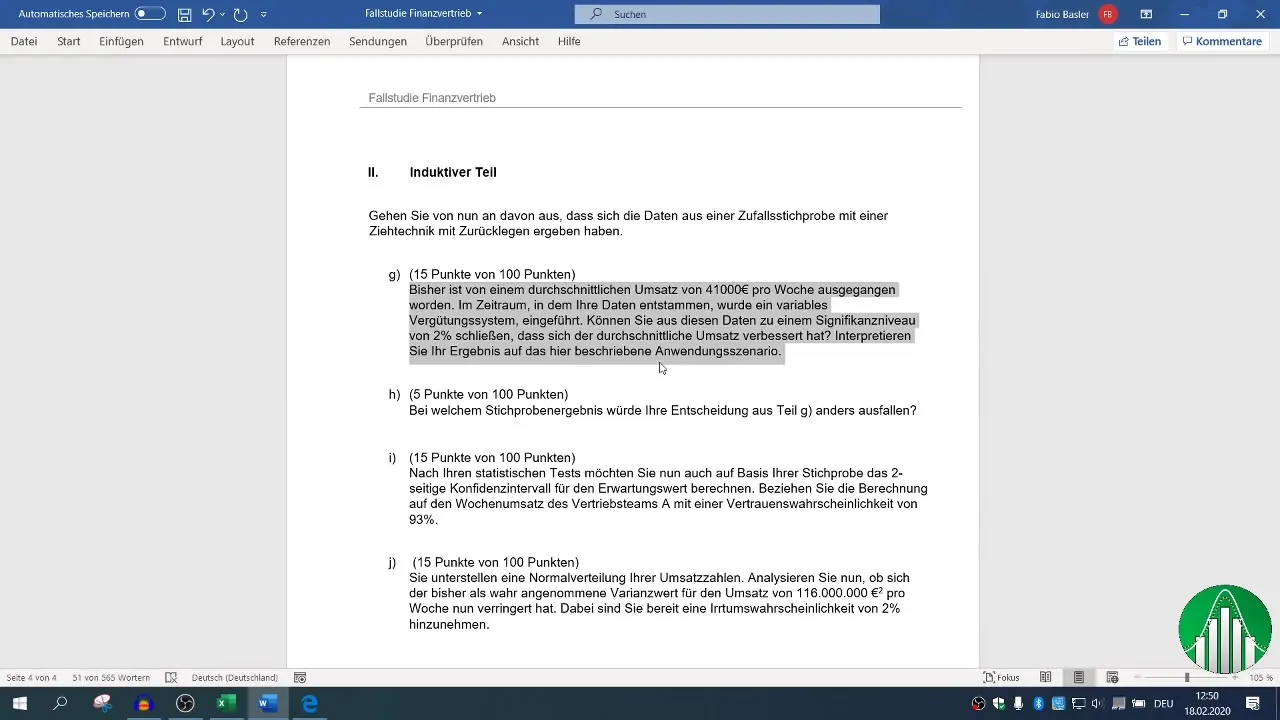
Step 7: Interpreting the Results
Interpreting your results is crucial. You have demonstrated that the new mean is €46,669, which is higher than the previous value of €41,000. This indicates that the revenue situation has improved after implementing the variable compensation system, suggesting a positive impact on employee motivation.
Summary
In this guide, you have learned how to conduct a 1-sample test for the expected value in Excel. From data collection to hypothesis formulation, calculation of mean and standard deviation, and decision-making on the hypothesis—each step was crucial for the correct statistical analysis. With this knowledge, you can make informed decisions in your company.
Frequently Asked Questions
How do I formulate hypotheses?The null hypothesis (H0) represents the status quo, while the alternative hypothesis (H1) postulates a change.
What is the test statistic in a statistical test?The test statistic is used to determine whether the null hypothesis can be rejected.
How do I interpret the comparison between test statistic and critical value?If the test statistic is greater than the critical value, the null hypothesis is rejected.


