Data analysis is a central part of successful business strategies. In this tutorial, I will show you how to construct a one-sided expected value test using Excel and decide how to adjust your sample result so that the null hypothesis is no longer rejected.
Key Insights
- To obtain a significant result, it is important to understand how different variables impact.
- The quantile value remains fixed, allowing you to determine test statistics.
- Through systematic adjustments, you can significantly influence hypothesis decisions.
Step-by-Step Guide
Step 1: Preparations
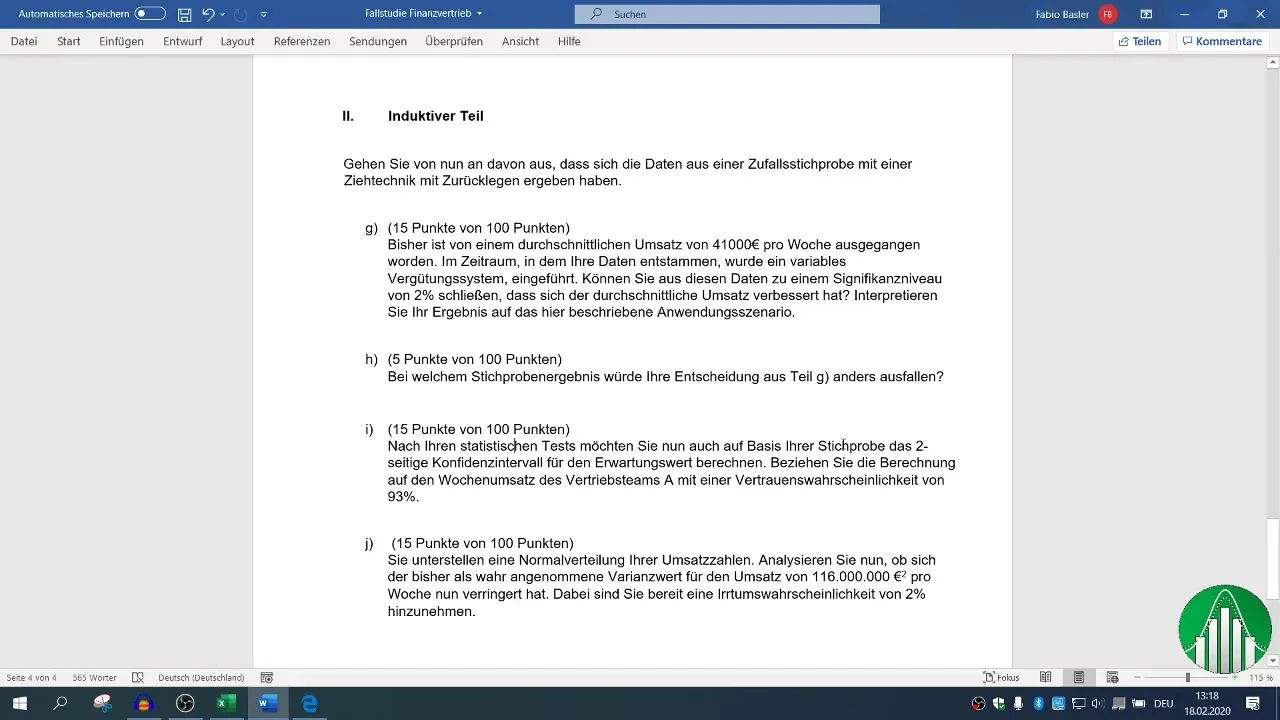
Start by transferring the data from the previous task to Excel. It is important to correctly capture all relevant numbers so that they can be used in the next calculations.
Step 2: Formulate the Equation
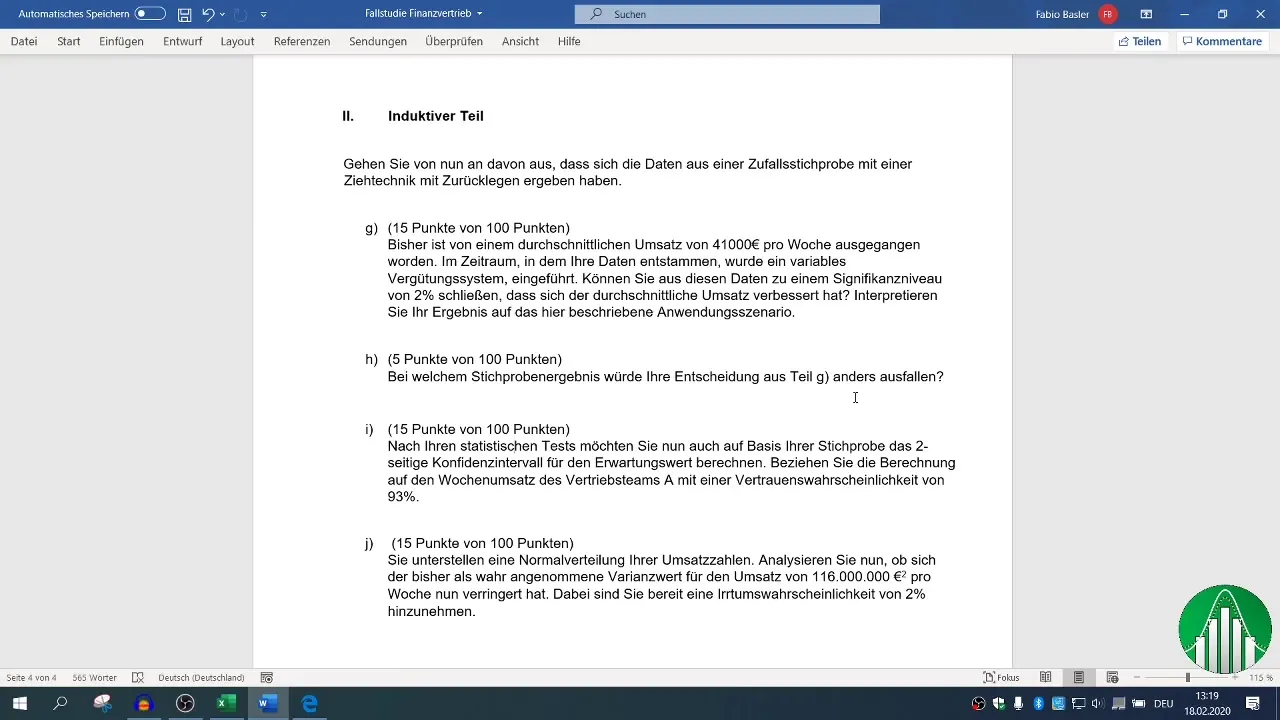
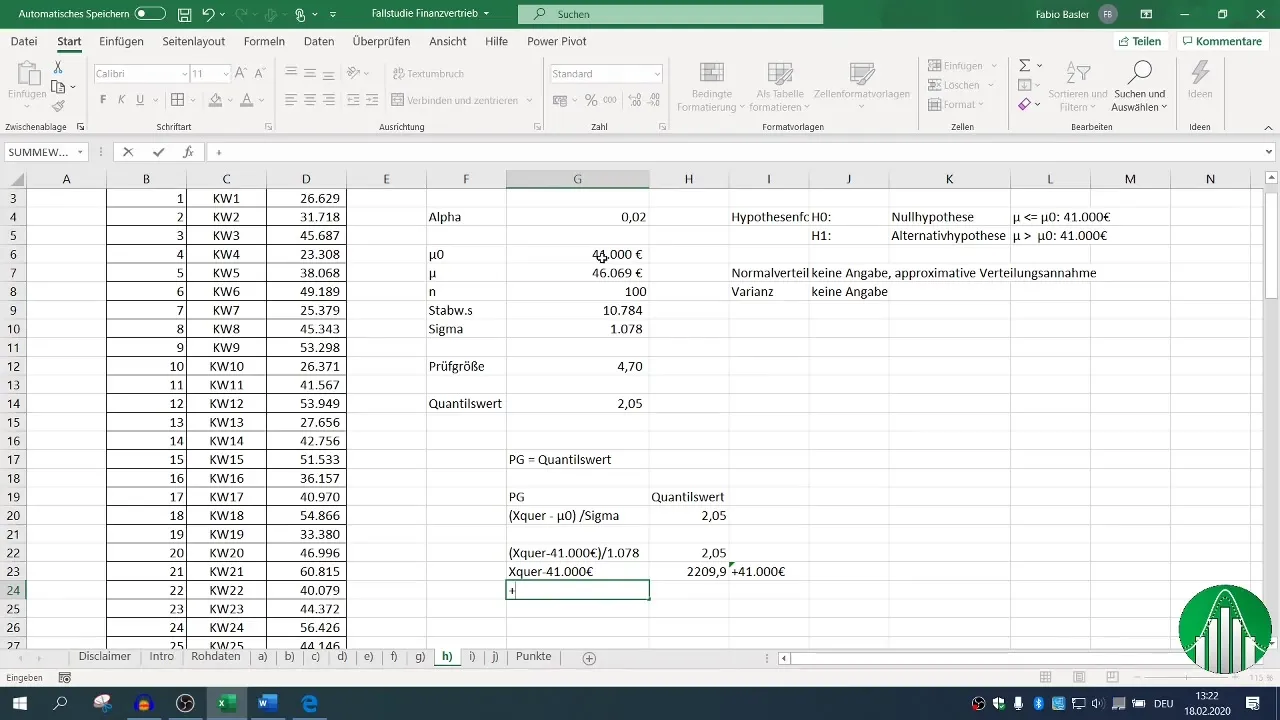
Formulate the equation for the test statistic. The test statistic is derived from the difference between the sample result and a set value, divided by the standard error. This equation will assist you in better controlling future results.
Step 3: Identify the Quantile Value
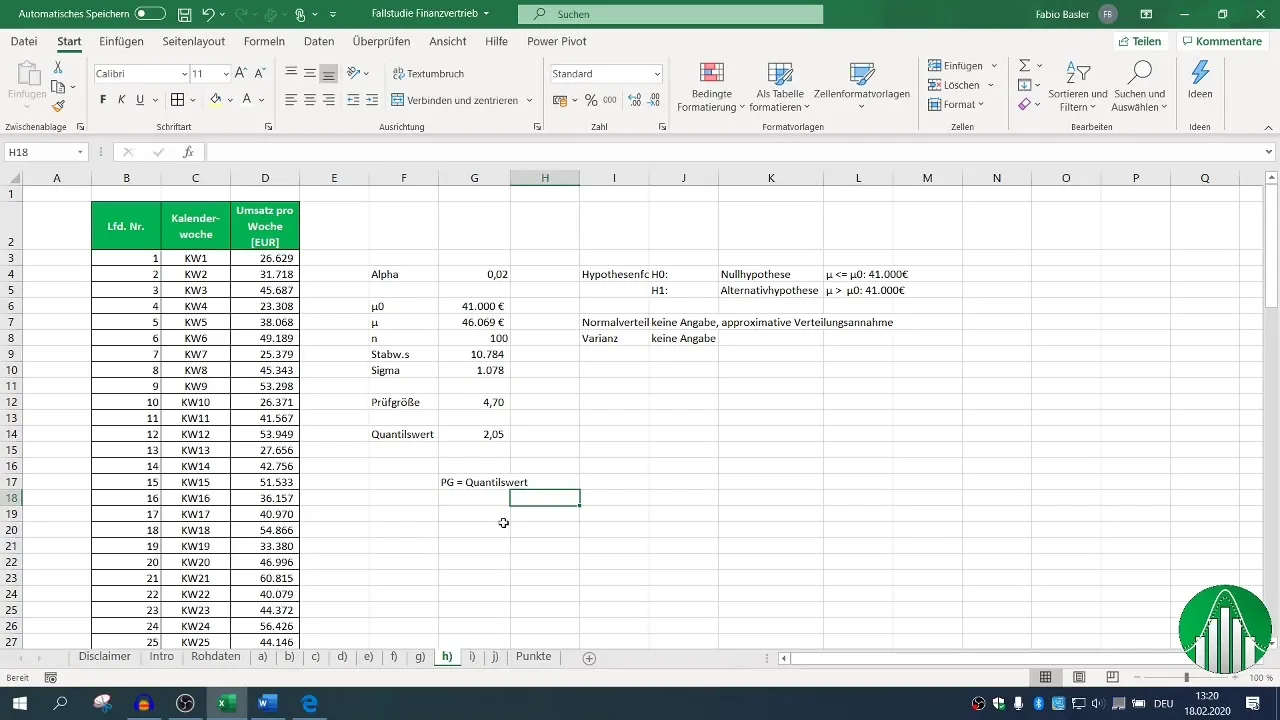
You should note the fixed quantile value of 2.05, as it cannot be changed. It will play a crucial role during the calculations to complete the equation.
Step 4: Calculate the Test Statistic
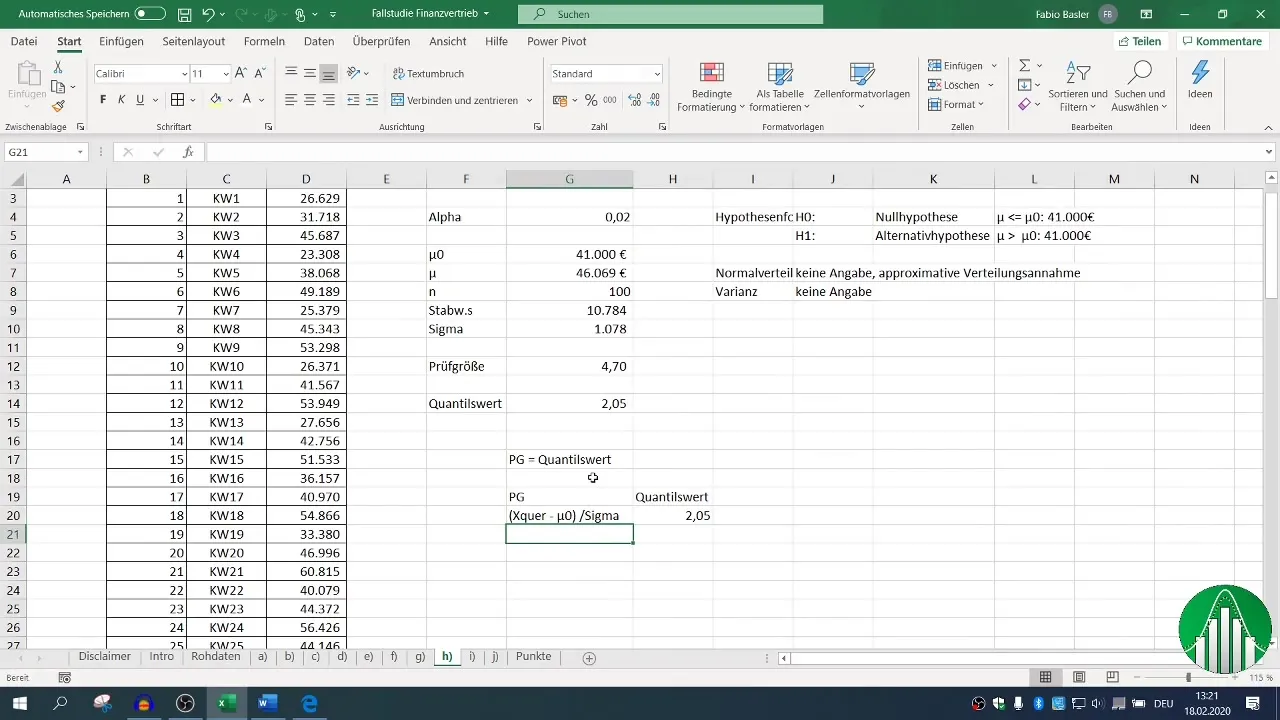
Calculate the test statistic according to your previously established equation. It is essential to use the correct values, especially the standard error, to obtain a precise result.
Step 5: Perform the Calculation
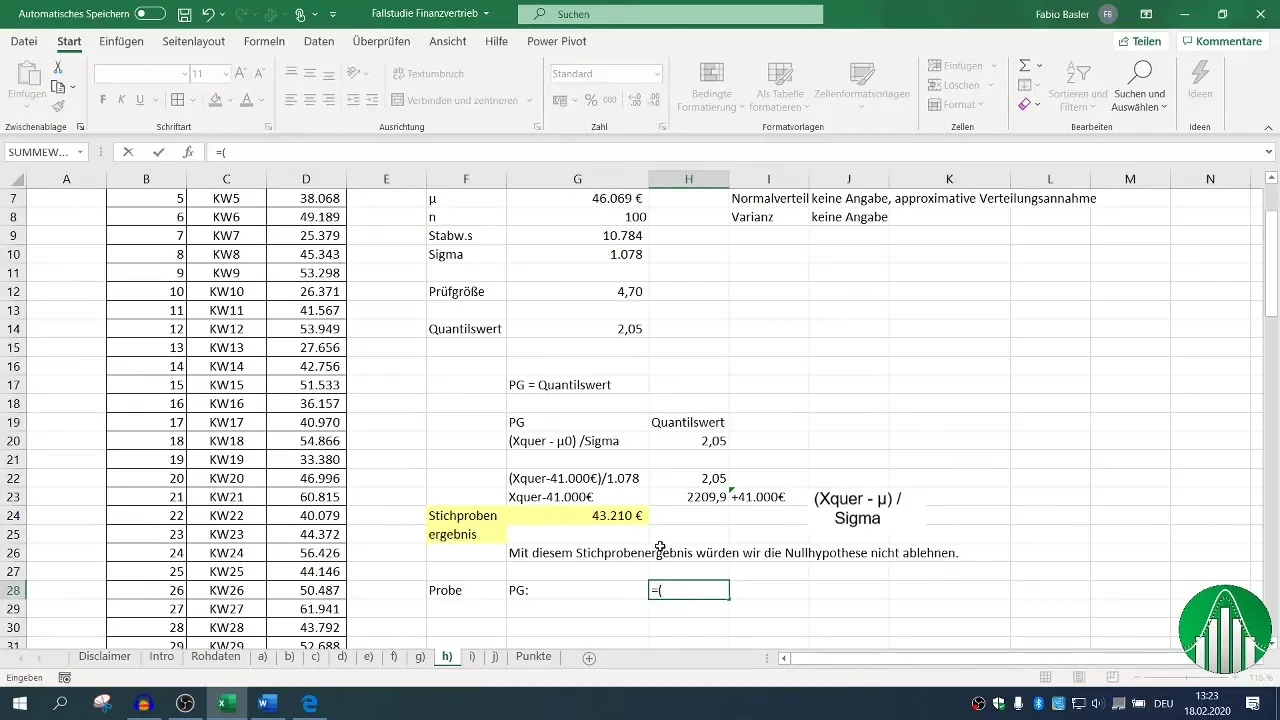
Perform the calculation by arranging the variables according to your equation. Make the addition or subtraction clear to avoid any confusion and ensure that all values are correctly added or subtracted.
Step 6: Verify the Result
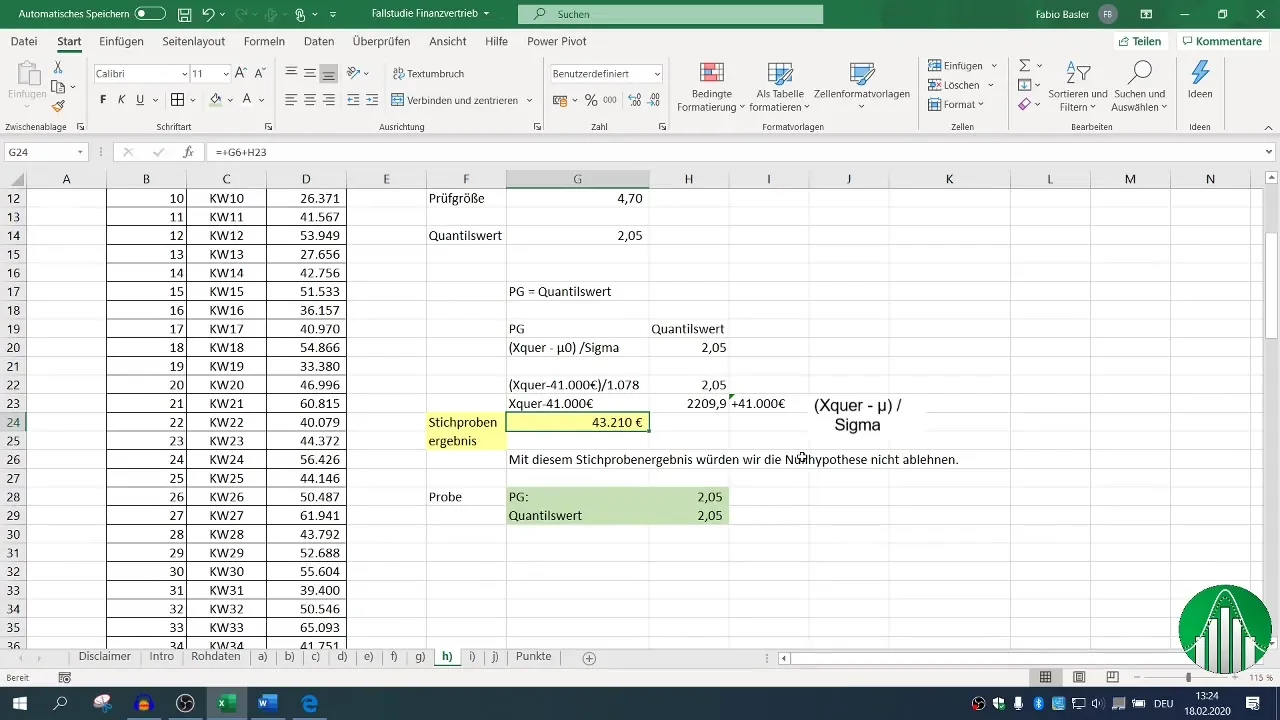
To ensure that your calculations are correct, recalculate the test statistic and substitute the values into the original formula. Check if the result matches your expectations and make sure you correctly reach the sector "2.05."
Step 7: Final Confirmation
Compare the obtained result of your test statistic with the quantile value. If they match, you have determined the necessary sample result at which the null hypothesis is no longer rejected.
Summary
In this guide, you have learned how to conduct a one-sided expected value test and adjust your sample result so that the null hypothesis is no longer rejected. With a systematic approach to data analysis, you can achieve significant changes in decision-making processes and gain valuable insights.
Frequently Asked Questions
How can I better organize my data in Excel?Use table functions and clear labeling to create clarity.
What is the difference between one-sided and two-sided tests?One-sided tests examine only in one direction, while two-sided tests aim at both directions.
How do I choose the right level of significance?The significance level should be chosen based on the specific requirements of your analysis and the risk of making incorrect decisions.


