Data analysis plays a crucial role in the business sector, especially when it comes to identifying relationships between different variables. In this guide, you will learn how to calculate the contingency coefficient in Excel to determine if there is a significant association between revenue values and sales teams in financial sales. We will delve into the use of the Chi² statistic to quantify the association between the variables.
Key Insights
- The contingency coefficient indicates how strong the relationship is between two nominal variables.
- Calculating the expected frequencies is an important step in determining the Chi² value.
- Excel provides effective tools for conducting this statistical analysis.
Step-by-Step Guide
To calculate the contingency coefficient, follow these steps:
1. Understanding Data and Scale Levels
Firstly, it is important to analyze the data structure. The revenue, classified into five categories, and the sales teams, which are nominal features, are the focus of this analysis.

2. Organizing Raw Data in Excel
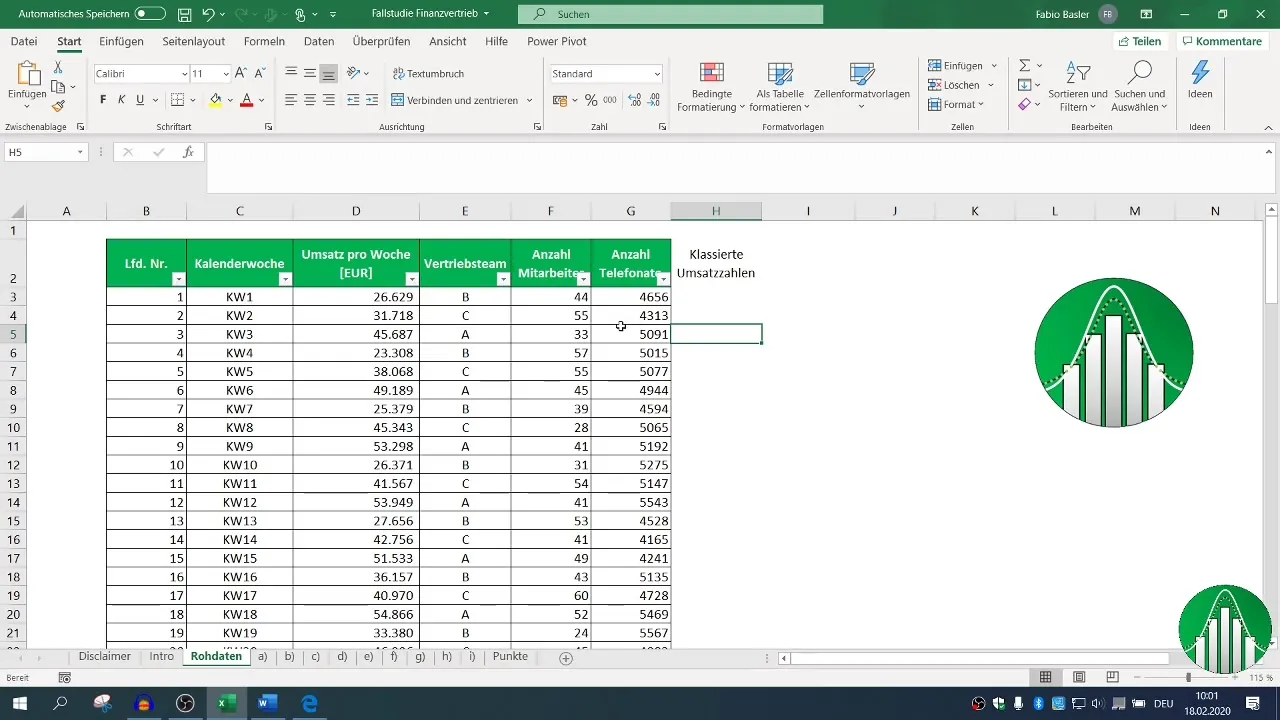
You should prepare the raw data in Excel by creating the feature "Sales Team" in one column and the classified revenue numbers in another column.

3. Adding Classified Revenue Numbers
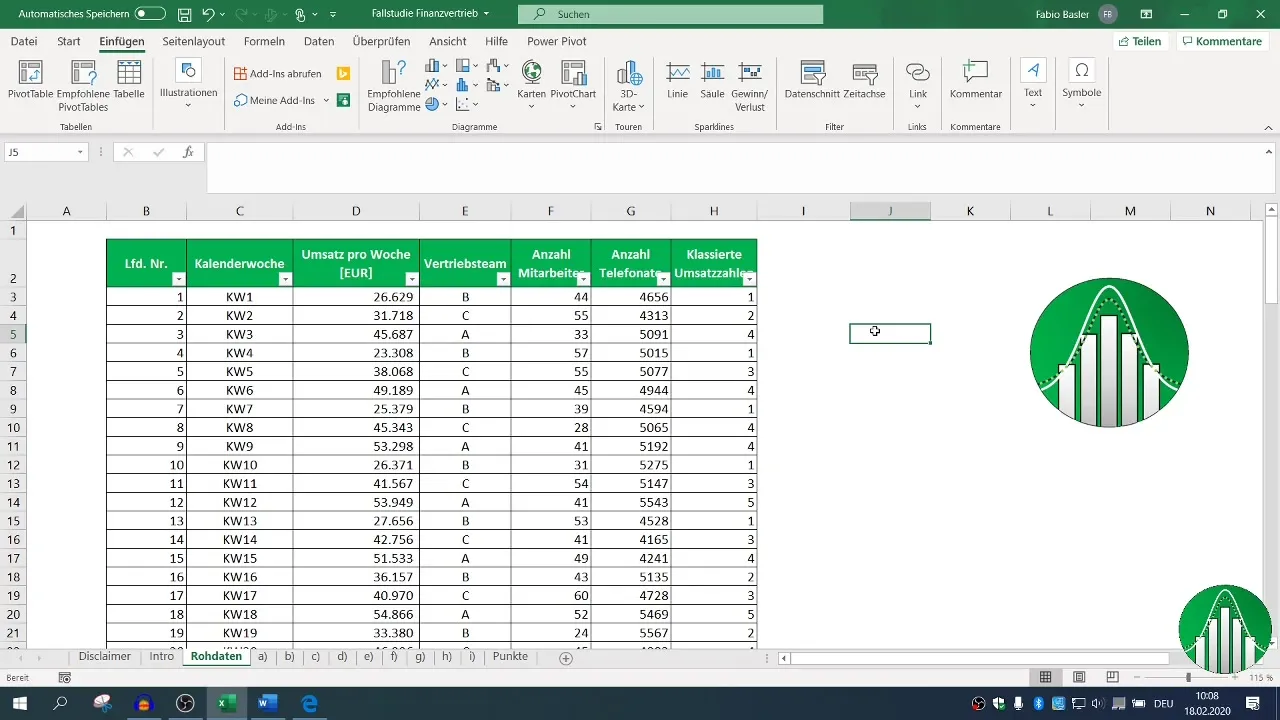
Add a new column in your dataset for the classified revenue numbers. This is done by dividing the revenue into classes to easily create a frequency distribution.
4. Applying Filters in Excel
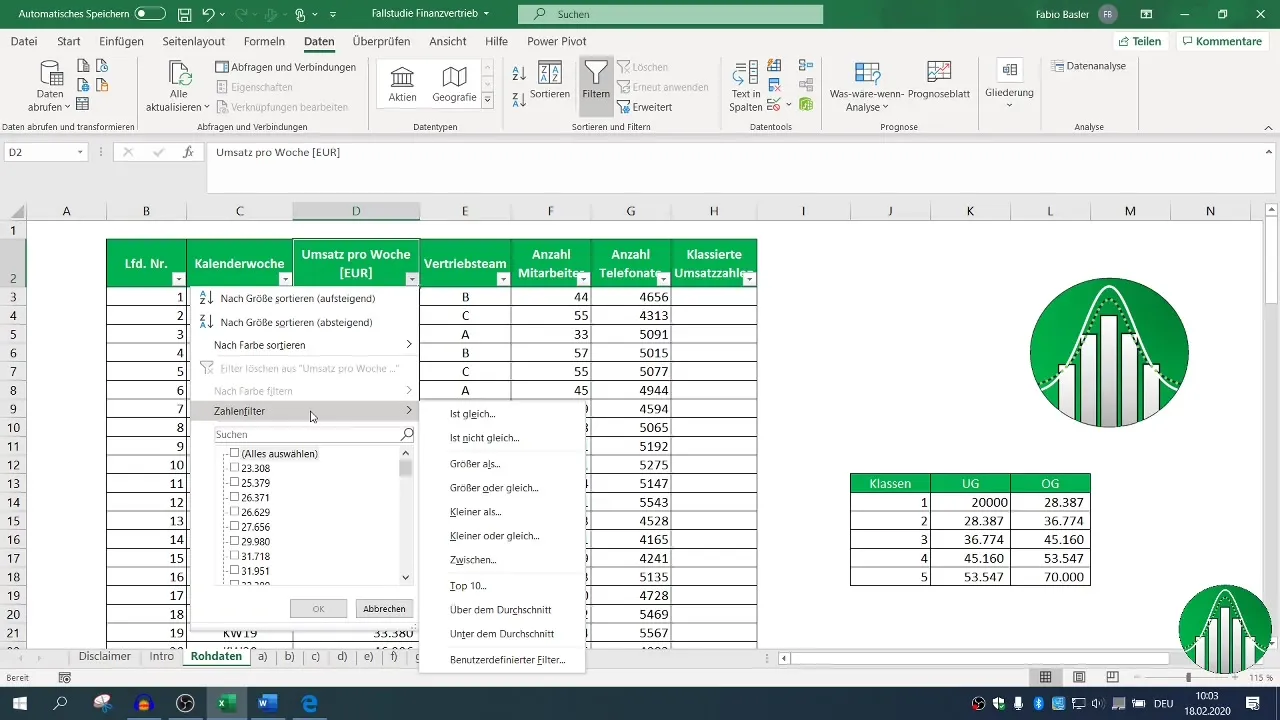
To display the classified revenue numbers for each class, use the filter function in Excel. This allows you to view specific revenue data according to the defined classes. Select the appropriate criteria for each revenue class.
5. Creating Two-Dimensional Frequency Distribution
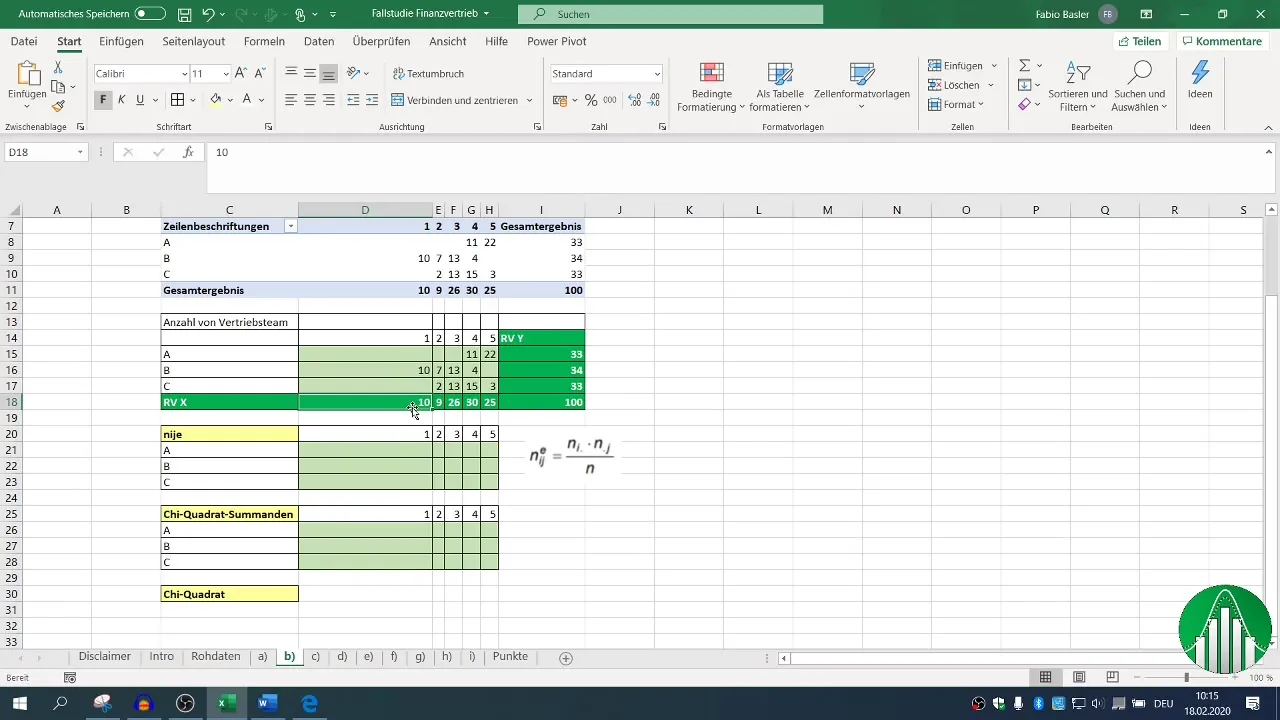
After making all comparisons, create a PivotTable to generate a two-dimensional frequency distribution. Make sure to correctly mark the data before creating the PivotTable.
6. Calculating the Chi² Value
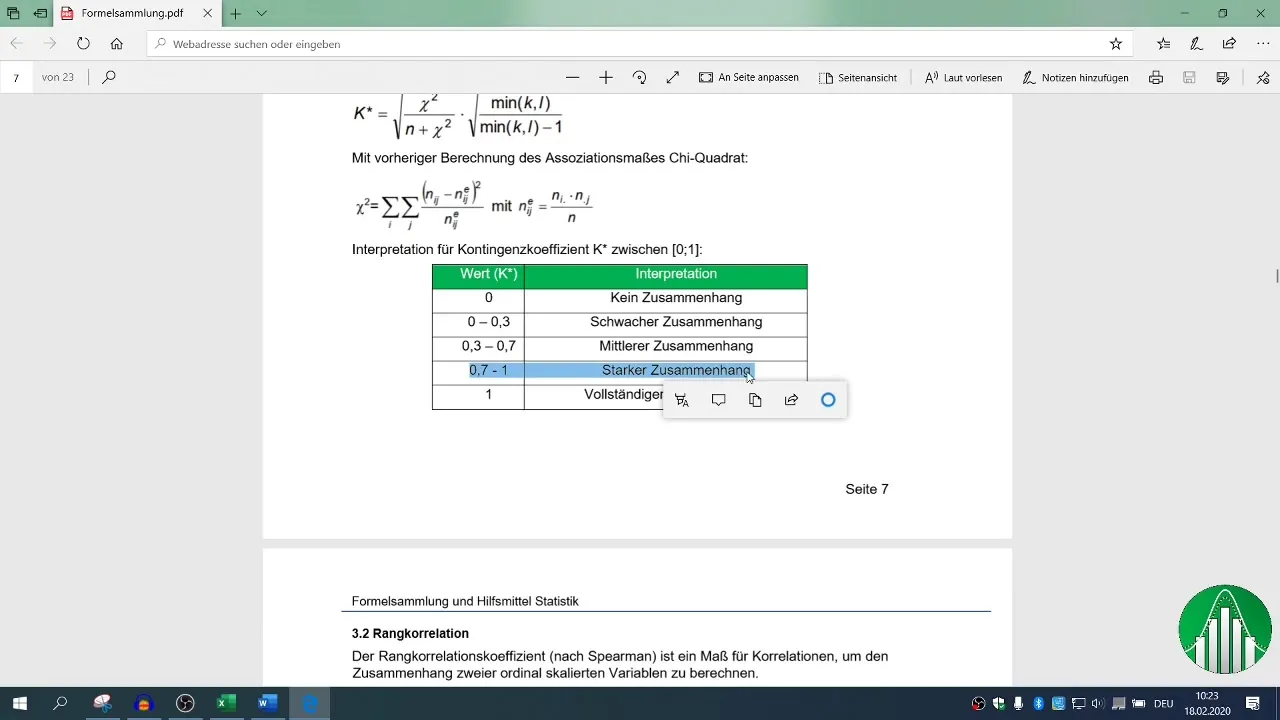
Now calculate the Chi² value needed to determine the contingency coefficient. You can do this in Excel using the formula that deals with total frequencies and expected frequencies.

7. Determining Expected Frequencies
To calculate the expected frequencies, multiply the marginal distributions of the two variables (Sales Team and Revenue Class) and divide by the total number of observations.
8. Determining Sum of Squares
Calculate the sum of squares by squaring the difference between the absolute and expected frequencies. This step is necessary to ensure positive values and perform the division correctly later on.

9. Calculating Contingency Coefficient
Now you can calculate the contingency coefficient. This is done by calculating the square root of the Chi² value divided by the total number of observations, taking into account the smaller number of manifestations of the two variables.

10. Interpreting the Results
The final step is the interpretation of the value of the contingency coefficient. A value close to 1 indicates a strong positive correlation, while a value close to 0 shows no correlation. In your case, a value of 0.82 indicates a strong correlation between the sales team and the revenue classes.
Summary
In this tutorial, you have learned how to calculate the contingency coefficient in Excel to analyze the relationship between sales teams and categorized revenue numbers. By organizing data effectively, using Excel filter functions, and creating a PivotTable, you were able to perform and interpret the necessary statistical calculations.
Frequently Asked Questions
What is the contingency coefficient K?The contingency coefficient K is a measure of the relationship between two nominally scaled variables.
How is the Chi² value calculated?The Chi² value is calculated from the differences between observed and expected frequencies, which are then squared and summed.
Why are expected frequencies important?Expected frequencies are crucial for calculating the Chi² value and hence the contingency coefficient.


