The ability to use data analysis tools in Excel is crucial for success in business and sales. This guide focuses on correlation and regression analysis to determine how the number of employees and the number of phone calls influence sales figures. Conducting both analyses will help you quantitatively evaluate these relationships and make the interpretation of results understandable.
Main Insights
- Difference between correlation and regression: Correlation shows the relationship between two variables, while regression examines the impact of multiple independent variables on a dependent variable.
- Insight into the statistical significance and goodness of fit of the model.
- Quantitative assessment of the importance of regressors.
Step-by-Step Guide
1. Preparations for Data Analysis
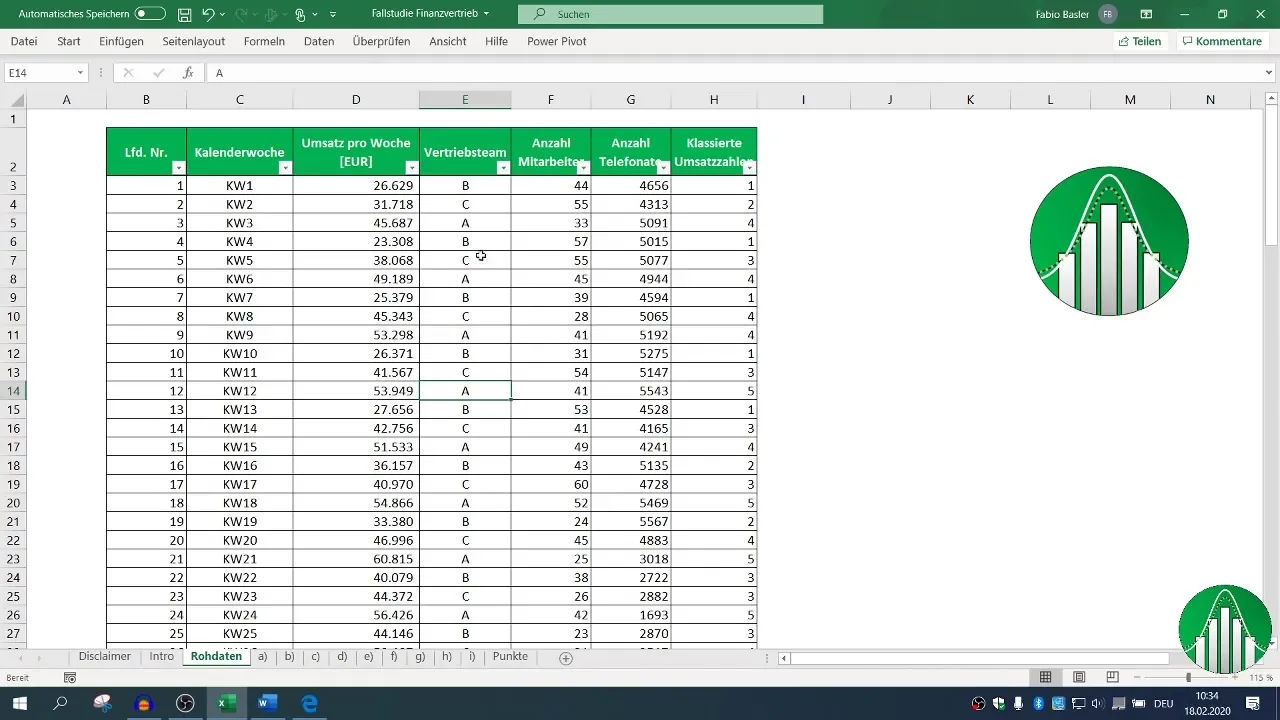
Before you can start the analysis, ensure that your data is correctly formatted in Excel. Import the data on sales, number of employees, and phone calls into an Excel worksheet. Verify that all records are complete and the necessary variables are present.

2. Conducting Correlation Analysis
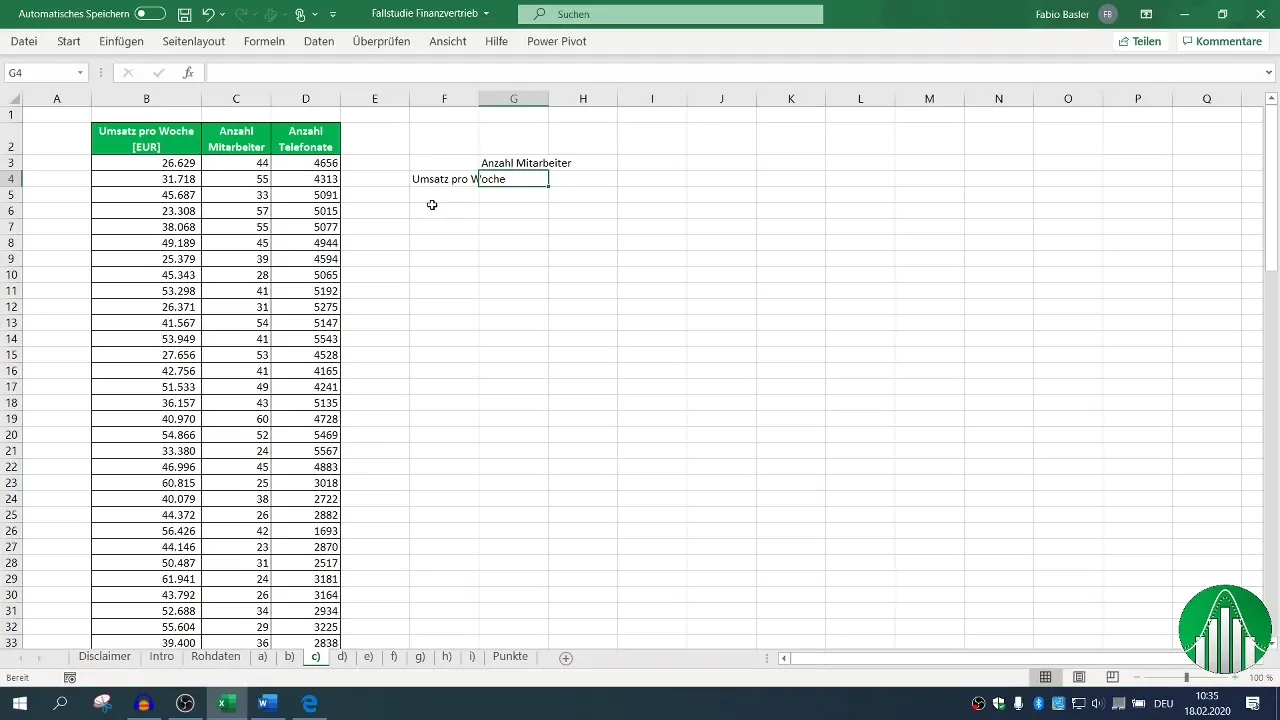
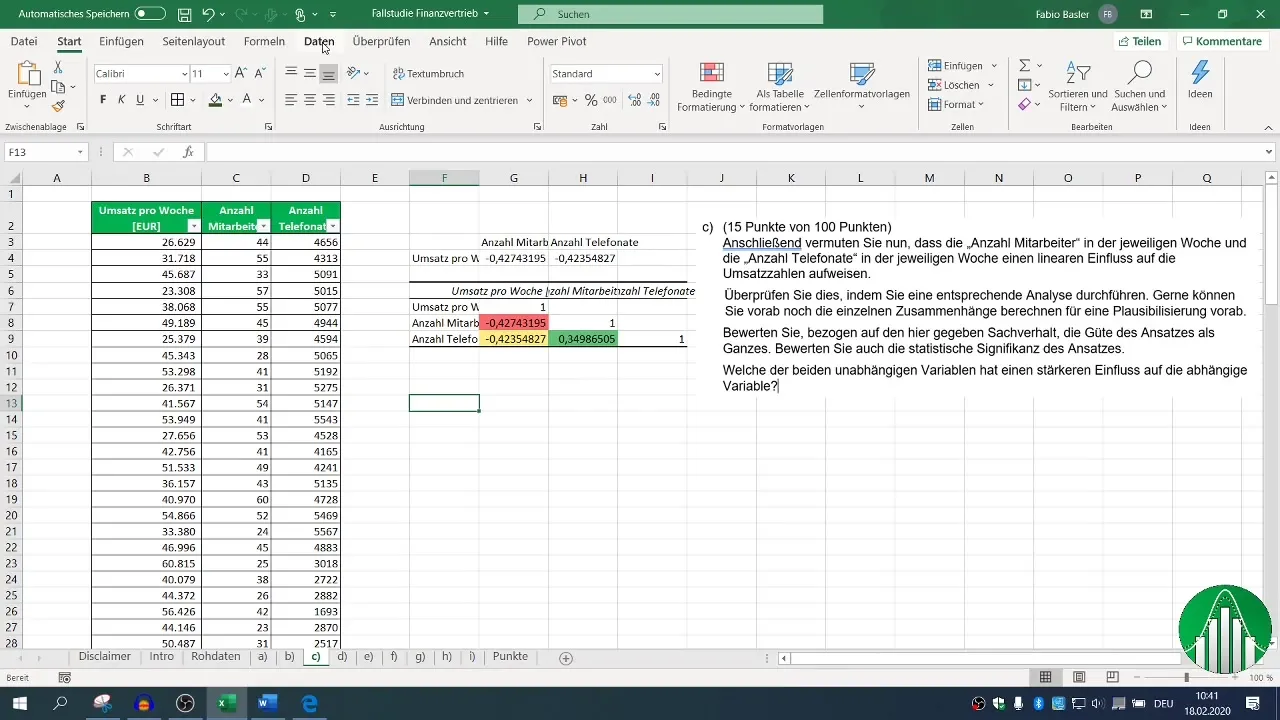
To analyze the correlation between the variables sales, employees, and phone calls, you can calculate the correlation coefficient. For this, use the formula =CORREL() in Excel. To get an overview of all variables, create a correlation matrix.
First, select the corresponding columns for sales and the number of employees. With the formula =CORREL( mark the ranges for sales and the number of employees. The result shows how strong the relationship is.
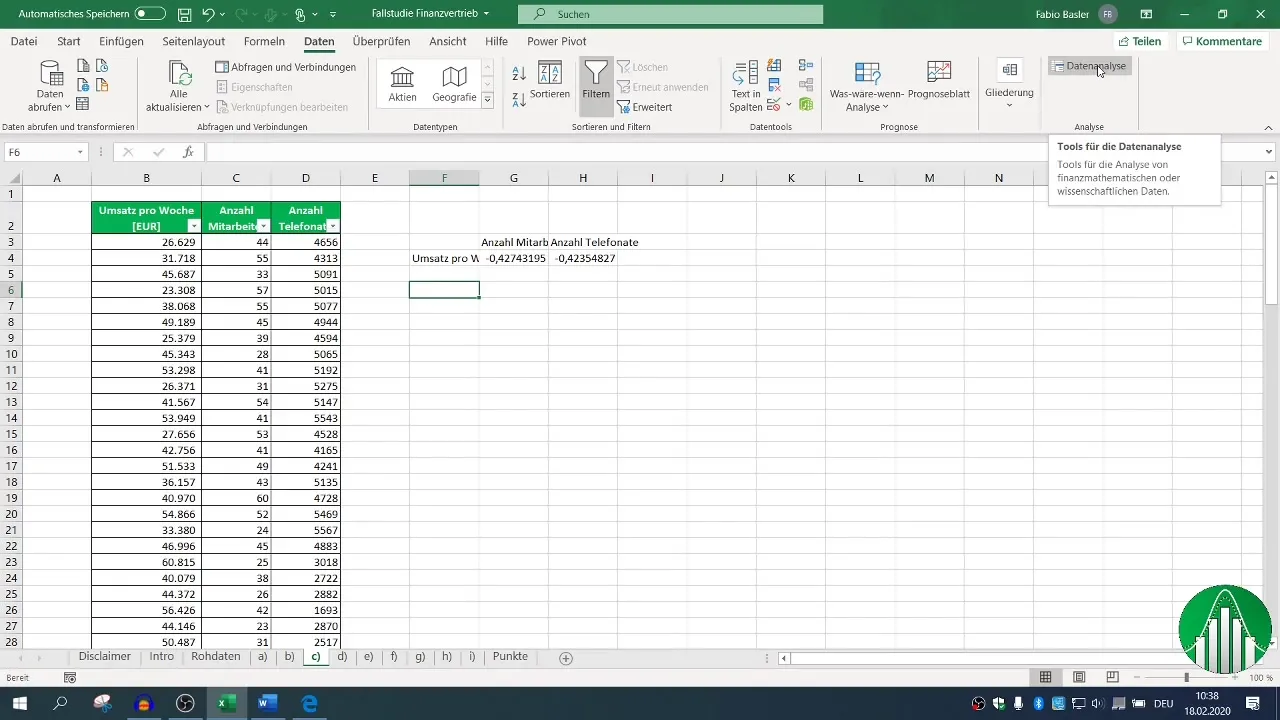
3. Creating a Correlation Matrix
For a more comprehensive analysis, it is recommended to use Excel's data analysis functions. Activate the data analysis function if you have not already done so. Go to the "Data" tab, click on "Data Analysis," and select "Correlation."
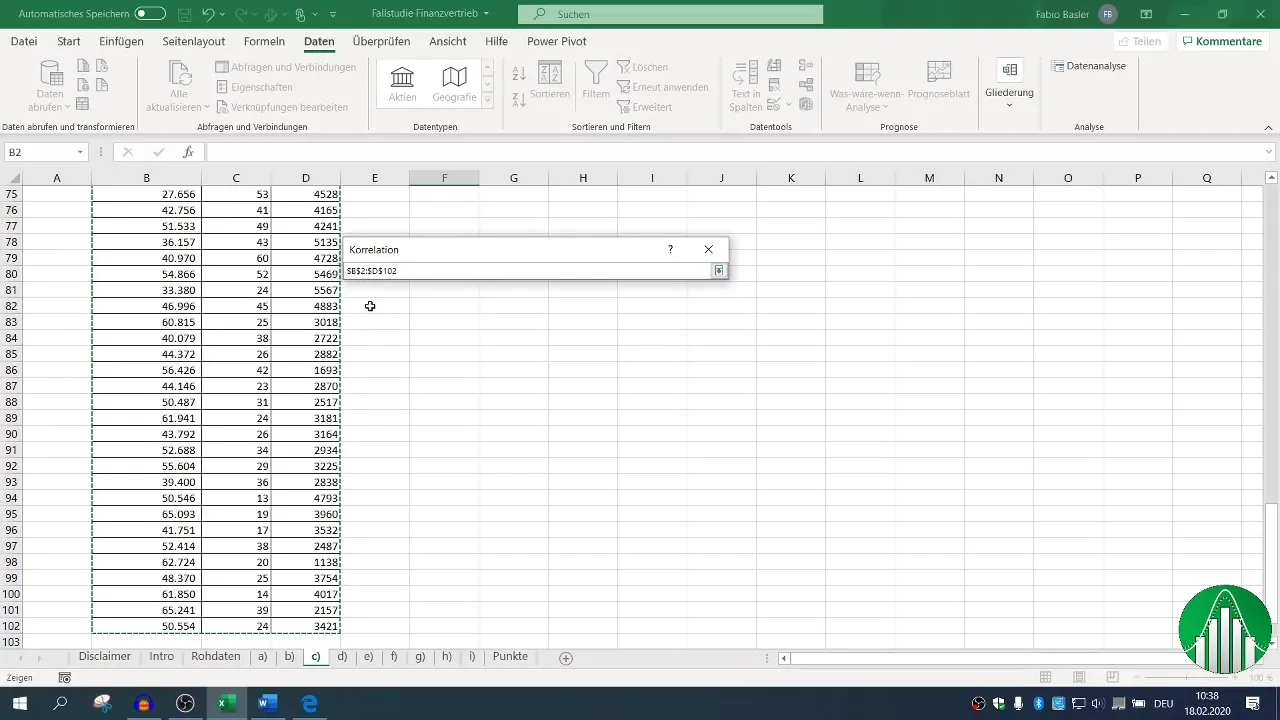
Define the input range for your data and check the box for headers so Excel recognizes the labels correctly. After setting the output range, you can generate the correlation matrix showing all relevant relationships.
4. Visualizing the Correlations
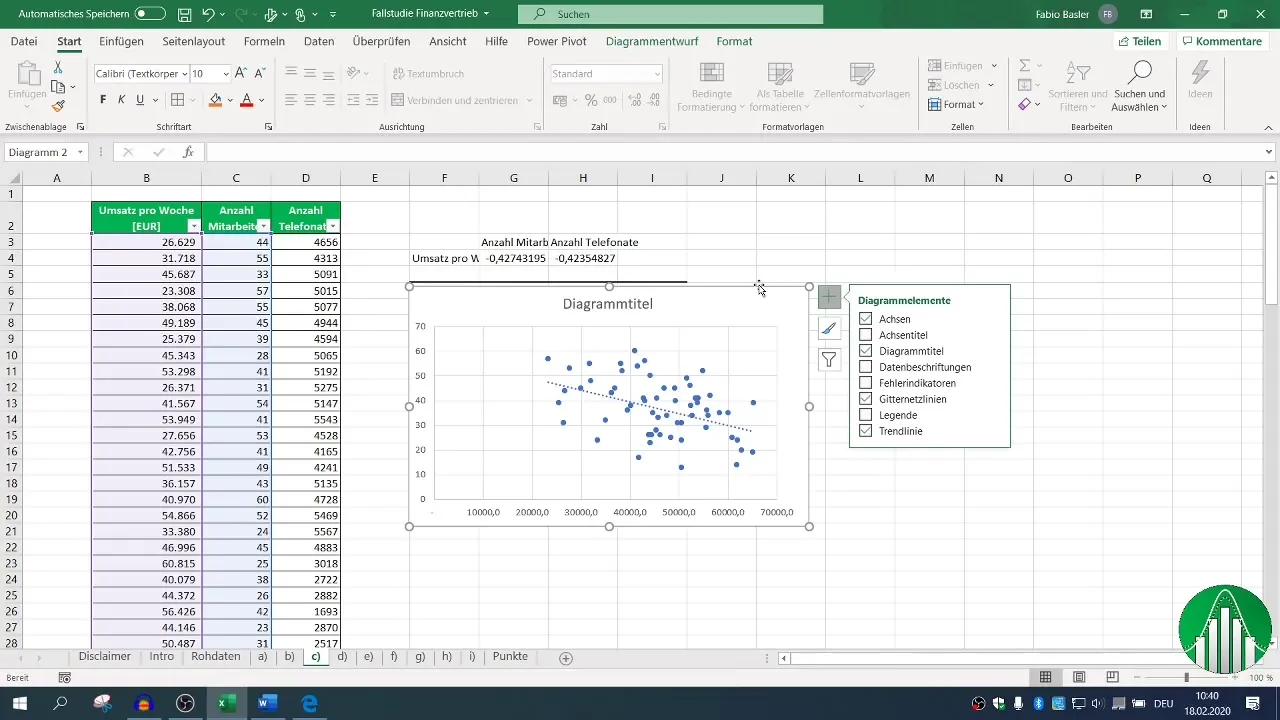
To make the results more illustrative, it may be useful to create a graphical representation through an XY chart. Select your X and Y data and have the scatter plot generated.
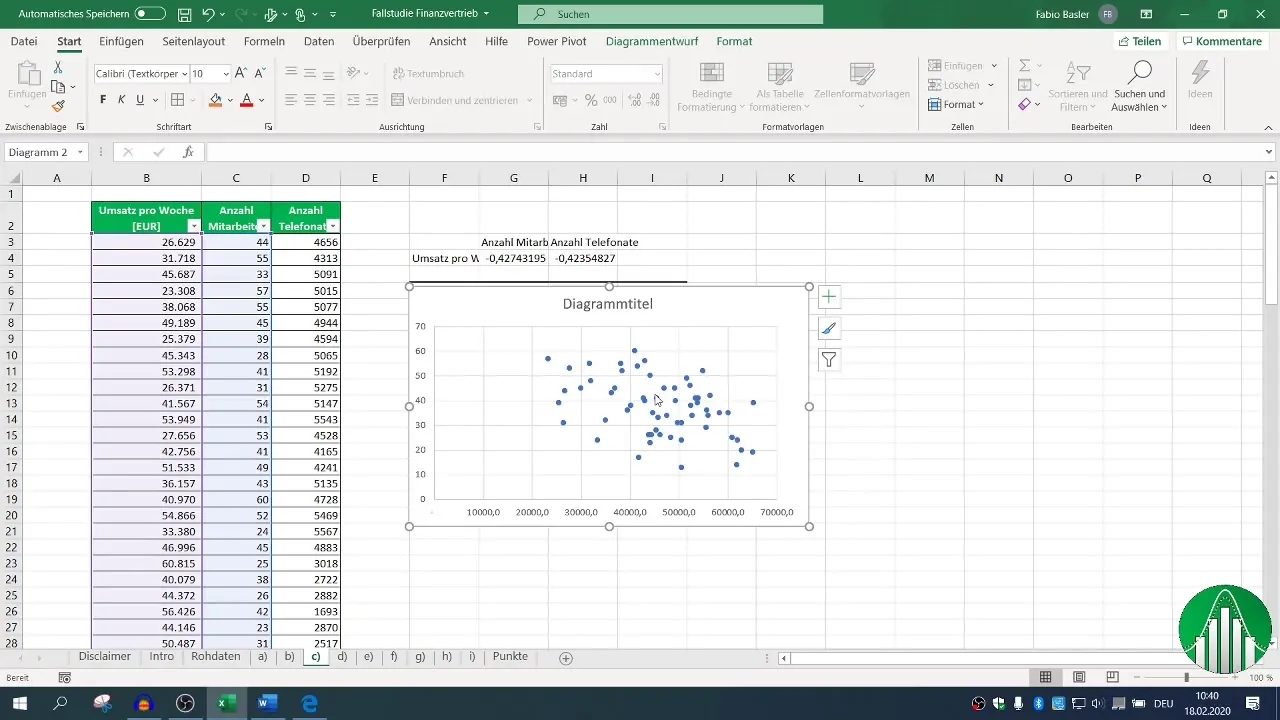
Add a trendline to visually represent the relationship, which can offer a more intuitive insight into the data.
5. Conducting Regression Analysis
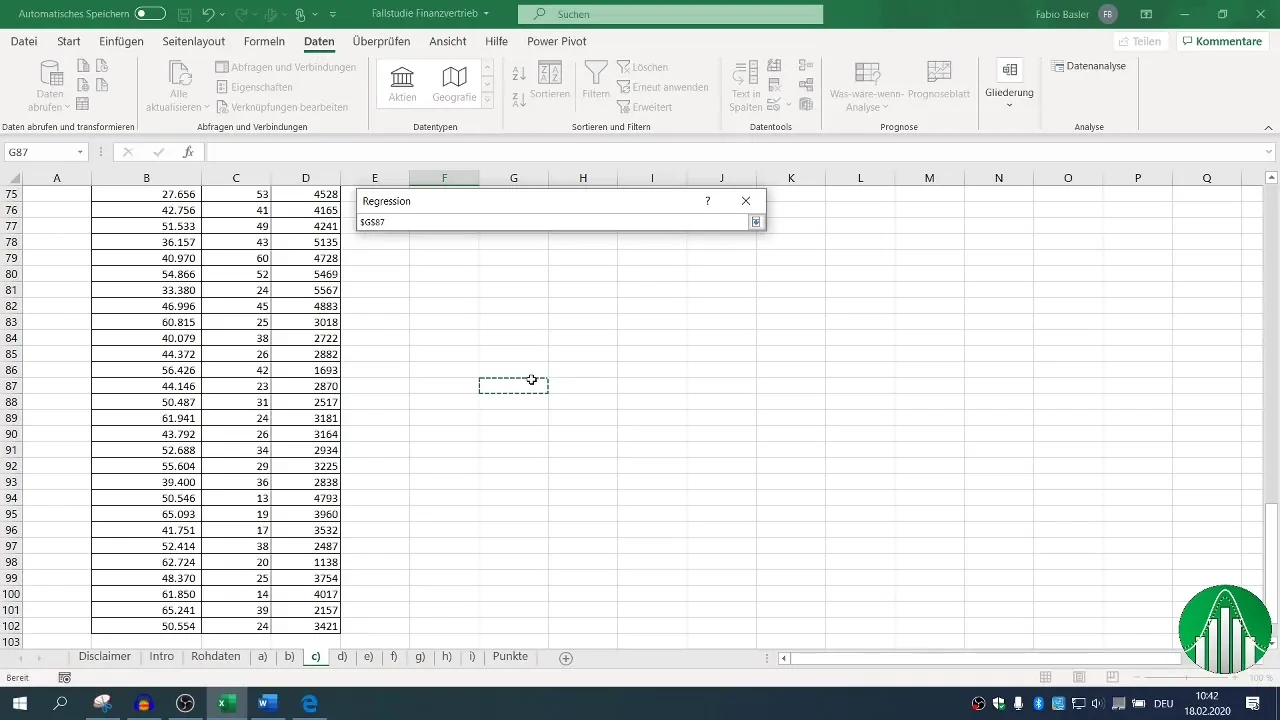
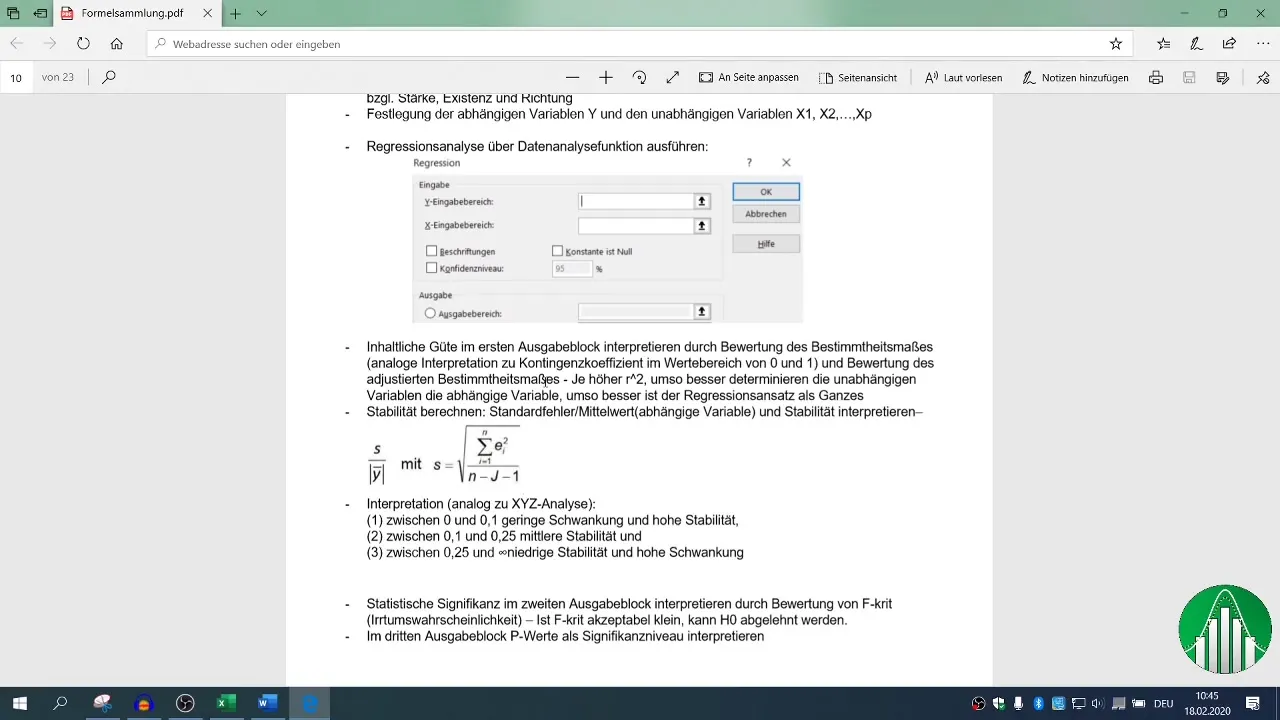
Next is the step for regression analysis. Go to "Data" again, select "Data Analysis," then "Regression." Here, you define the dependent variable (sales) and the independent variables (number of employees and phone calls) for the input range.
Ensure the headers for the values are set and define your output range. The default confidence level is set at 95%, which is sufficient for most analyses.
6. Evaluating Regression Analysis
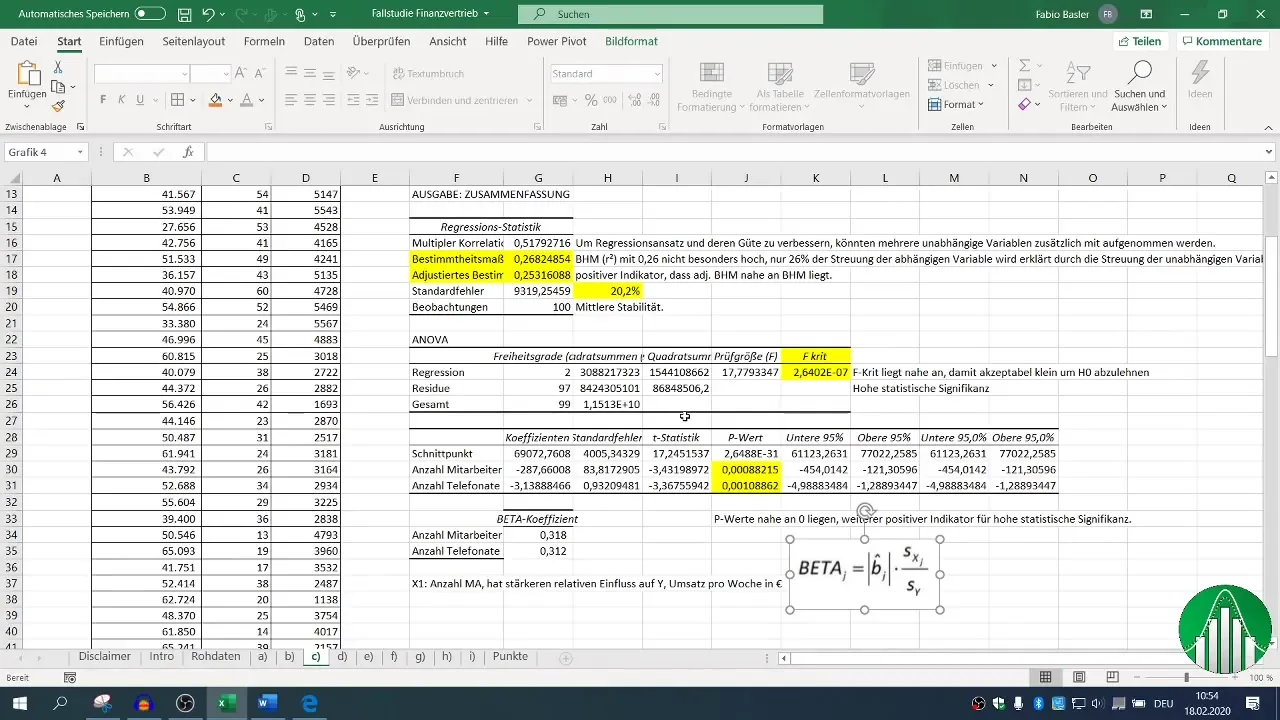
After conducting the regression, various output blocks are available. Focus on the coefficient of determination (R²), which describes the goodness of fit of the model. An R² of 0.26 indicates that only 26% of the variability in sales is explained by the independent variables.
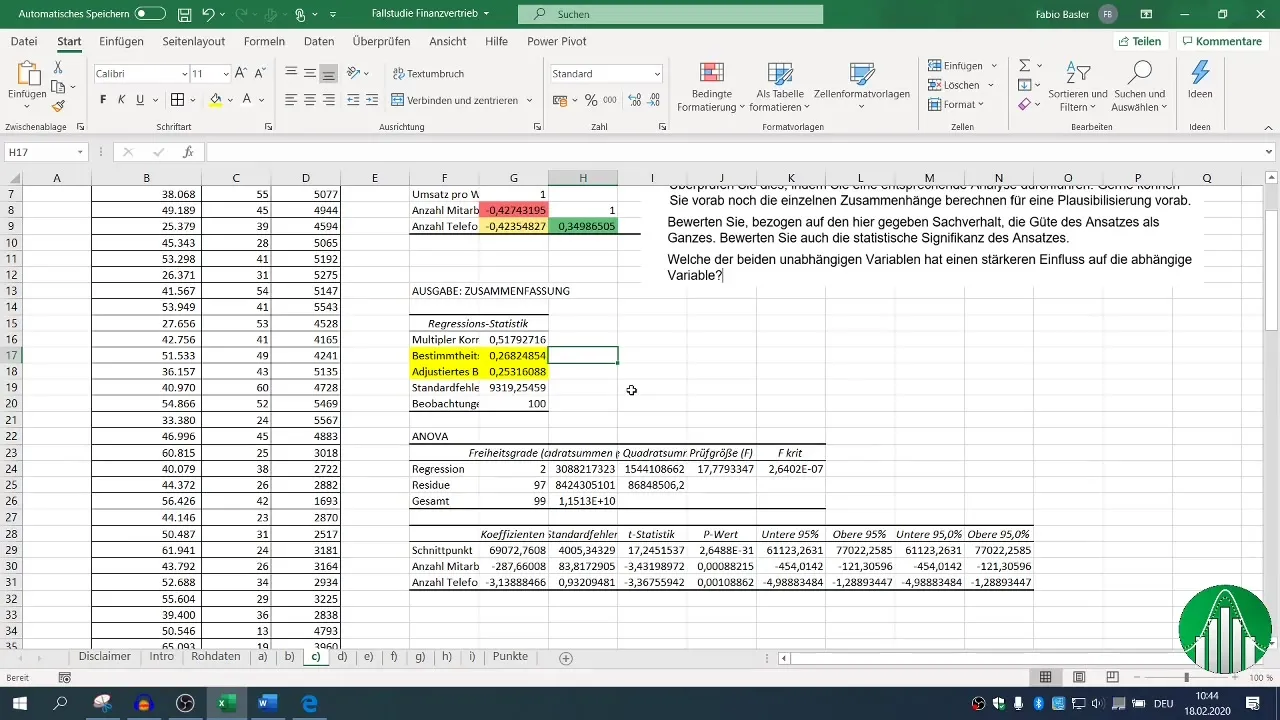
The adjusted coefficient of determination should be close to R², which in this case is a positive indicator.
7. Evaluating Statistical Significance
The F-value and the p-values of the independent variables are crucial to assess the statistical significance of your model. A p-value below 0.05 indicates that the relationship is statistically significant.
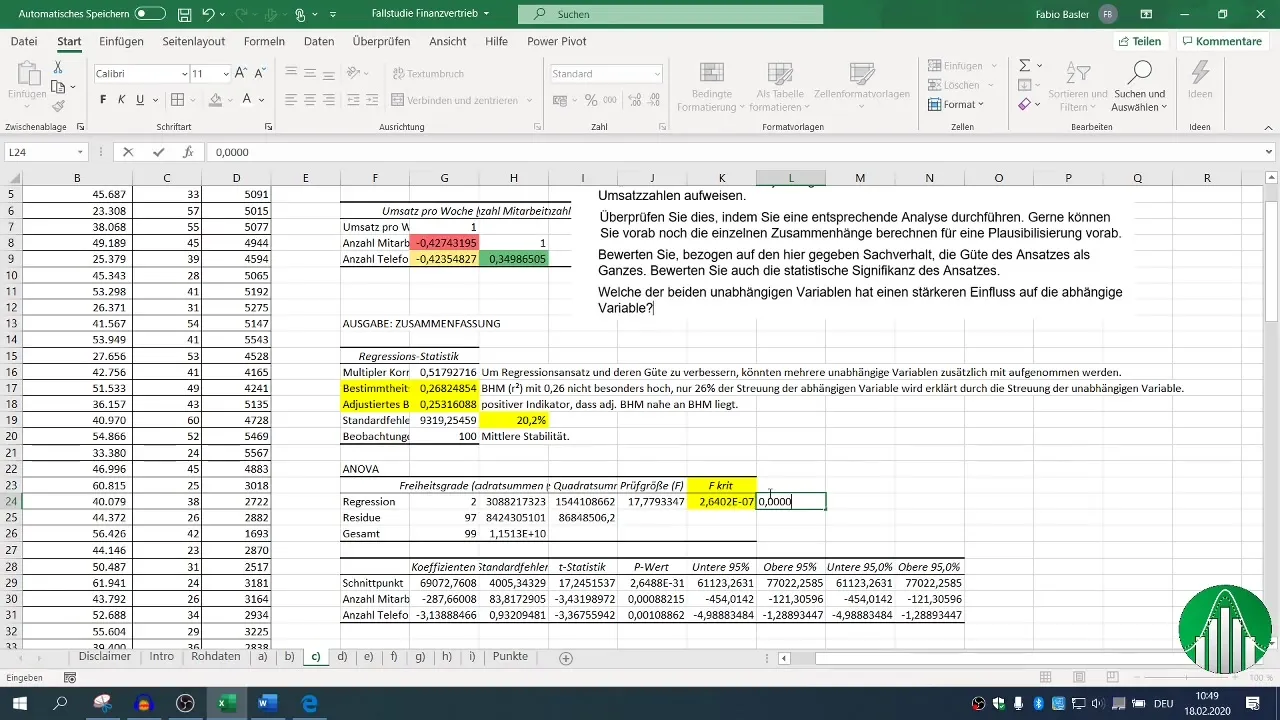
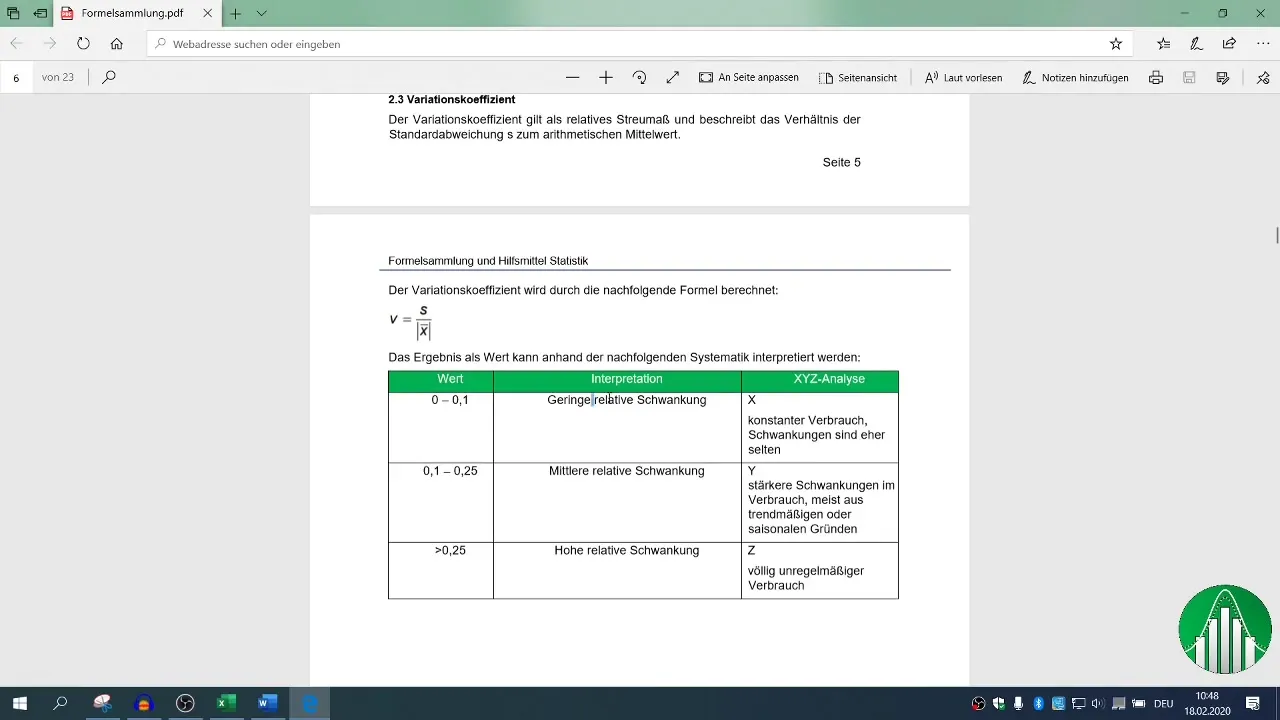
Evaluating these statistical measures in conjunction with R² helps you understand the stability and reliability of your results.
8. Comparing Influential Factors
Ultimately, you are interested in determining which factor - number of employees or phone calls - has a stronger influence on sales figures. You take the beta coefficients into account and compare them.
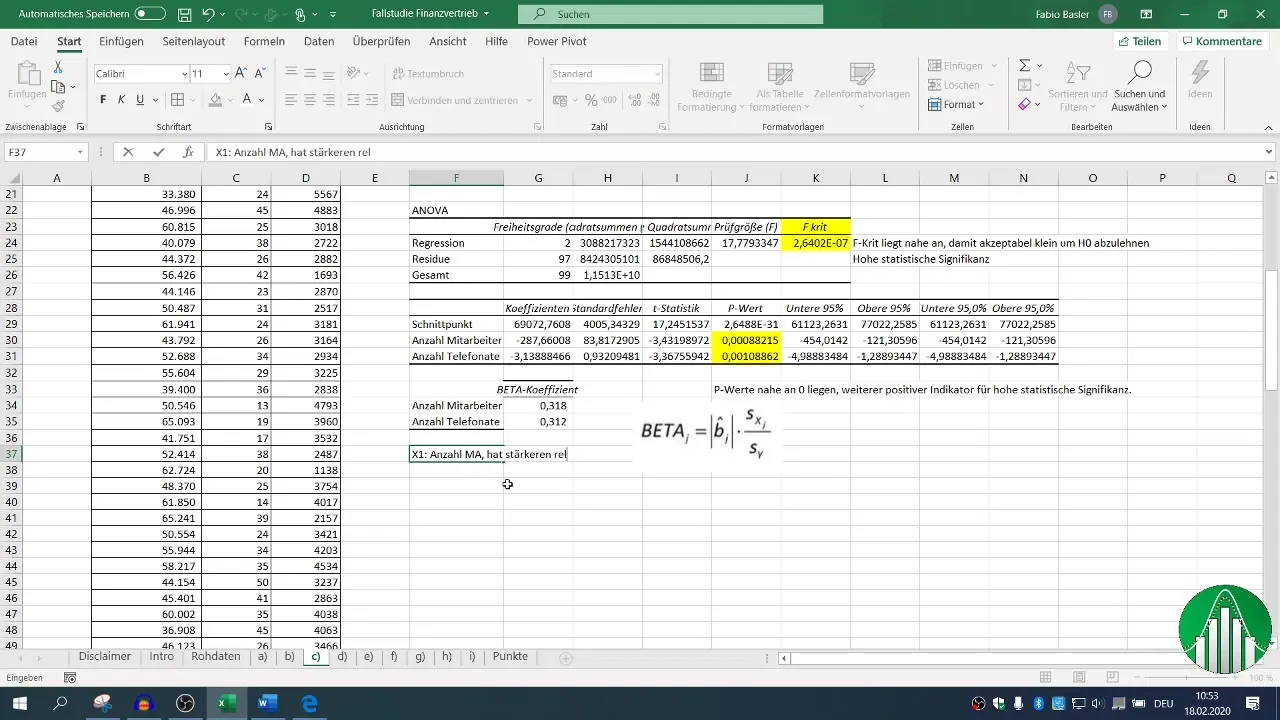
A higher beta coefficient indicates the relative influence; it may turn out that the number of employees has a greater impact on sales than the number of phone calls.
Summary
The preceding analysis has provided valuable insights into the statistical relationships between the variables sales, number of employees, and phone calls. By systematically conducting correlation and regression analyses in Excel, you can make informed decisions based on your findings.
Frequently Asked Questions
Why is a correlation analysis important?A correlation analysis helps to identify the relationship between two variables before a detailed regression analysis is performed.
How do I interpret R² in regression analysis?An R² of 0.26 means that 26% of the variations in the dependent variable (sales) are explained by the independent variables.
What is the difference between correlation and regression?Correlation measures the relationship between two variables, while regression evaluates the impact of multiple independent variables on a dependent variable.
How can I test for statistical significance?You test for statistical significance based on the p-value; p-values below 0.05 are considered significant.
What role do beta coefficients play?Beta coefficients indicate the relative influence of the independent variables on the dependent variable.


