Statistical hypothesis tests are an indispensable tool for companies to make informed decisions. In the following section, we will show you how to conduct a two-sample F-test in Excel to validate your hypotheses regarding the variance of your sales data. This guide will walk you through the process step by step, ensuring that you can confidently apply the learned techniques.
Key Findings
- The two-sample F-test is used to compare the variances of two sets of data.
- The goal is to determine whether the variance of current sales data deviates from an assumed value.
- Excel provides the tools to perform the necessary calculations and comparisons.
Step-by-Step Guide
1. Data Preparation
Before you can begin the test, ensure that your data is prepared. It is important to remove filters to consider all relevant data. Start by selecting the data in the appropriate columns.

2. Setting the Parameters
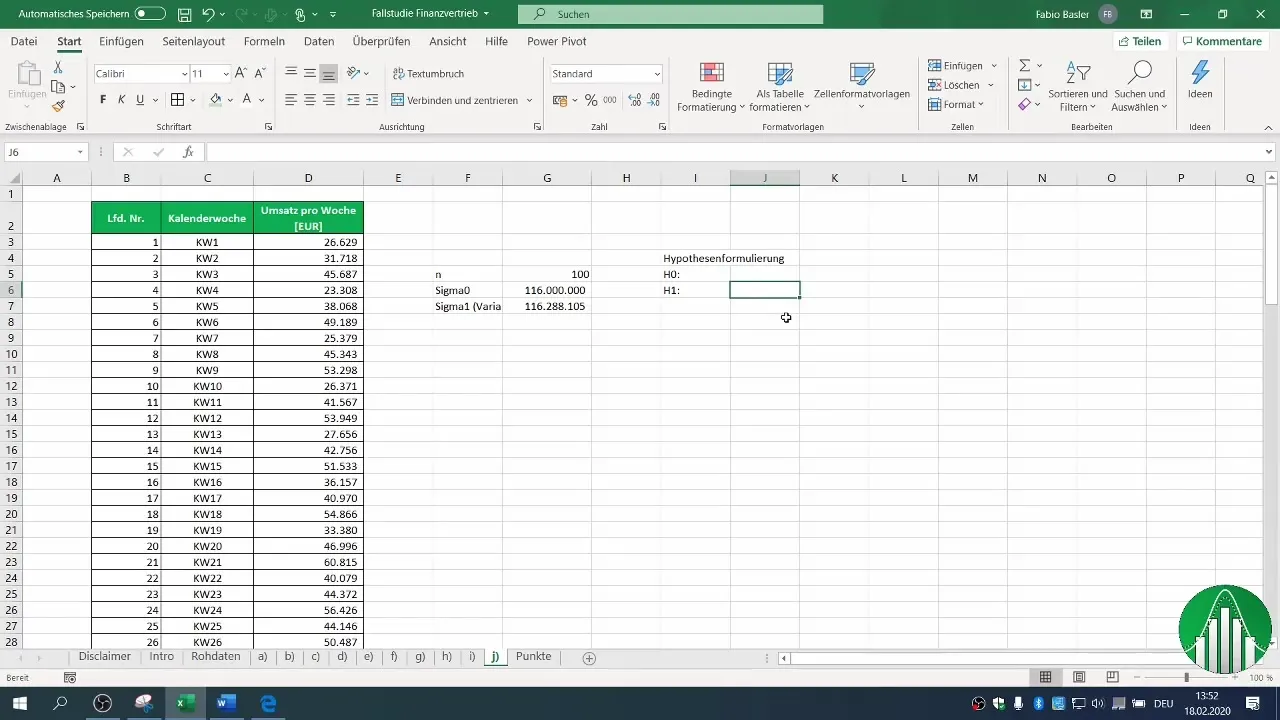
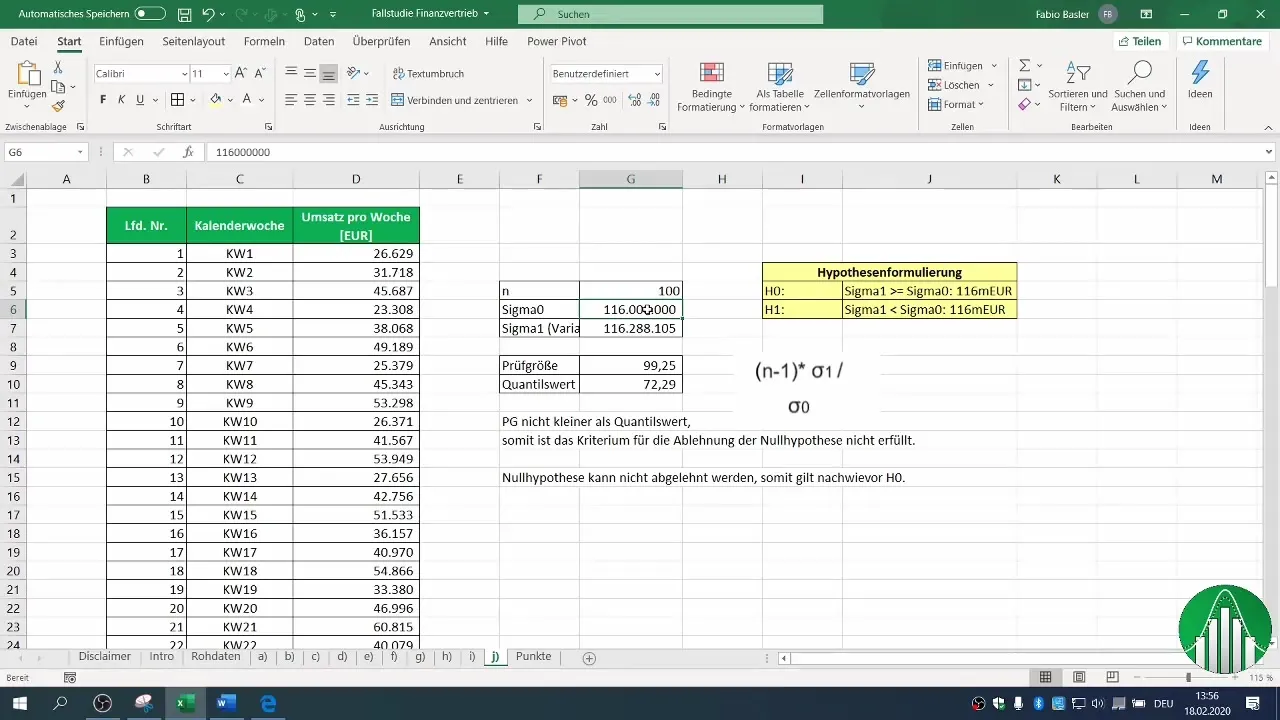
Define the parameters for your test. You should know how many data points you are analyzing. In our example, we assume you have 100 revenue figures that follow a normal distribution.

3. Capturing the Previous Variance Value
The known variance or revenue value from the past plays a central role in your analysis. In this example, the previous value is 116 million euros per week.
4. Formulating Hypotheses
Formulate your null hypothesis (H0) and alternative hypothesis (H1). In this case, the H0 states that the variance remains equal to or greater than 116 million, while the H1 assumes that the variance has decreased.
5. Calculating the Test Statistic
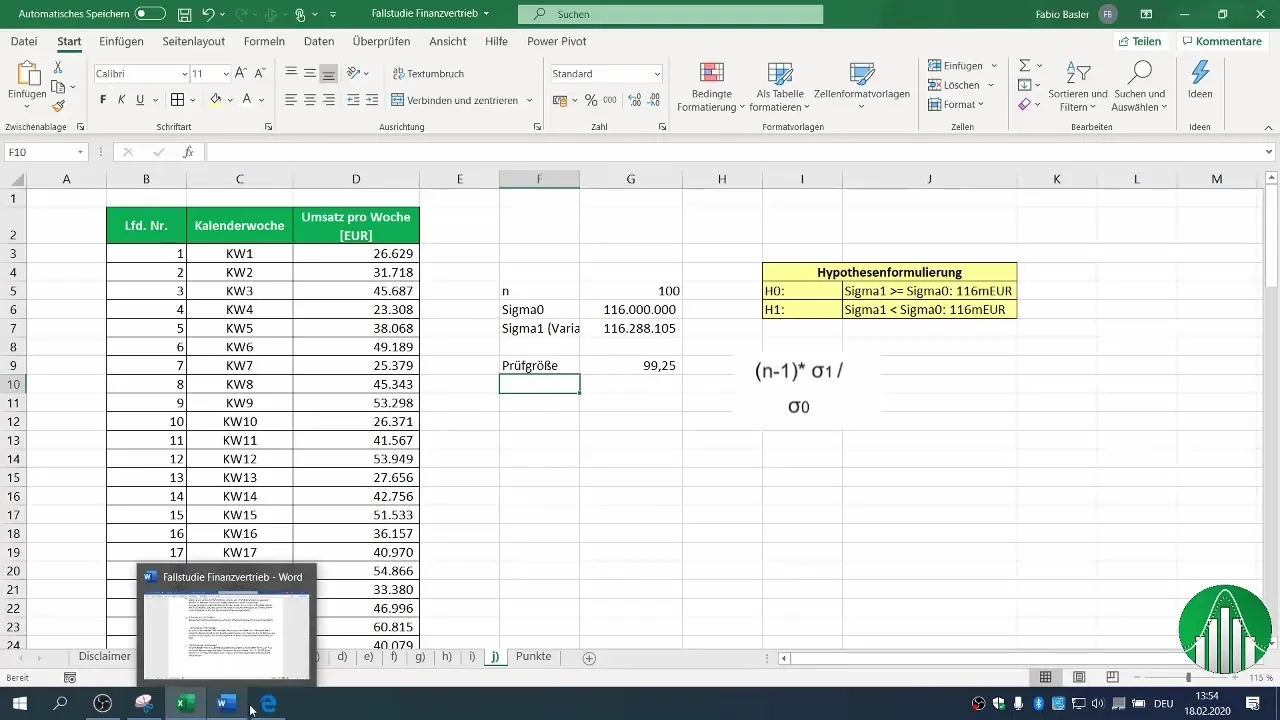
You can calculate the test statistic by using the variance of your sample. Perform the necessary calculations to determine the value for your test statistic. This is calculated by the formula: (n-1) * σ1 / σ0, where σ1 is the variance of your sample and σ0 represents the variance from the past.
6. Determining the Critical Region
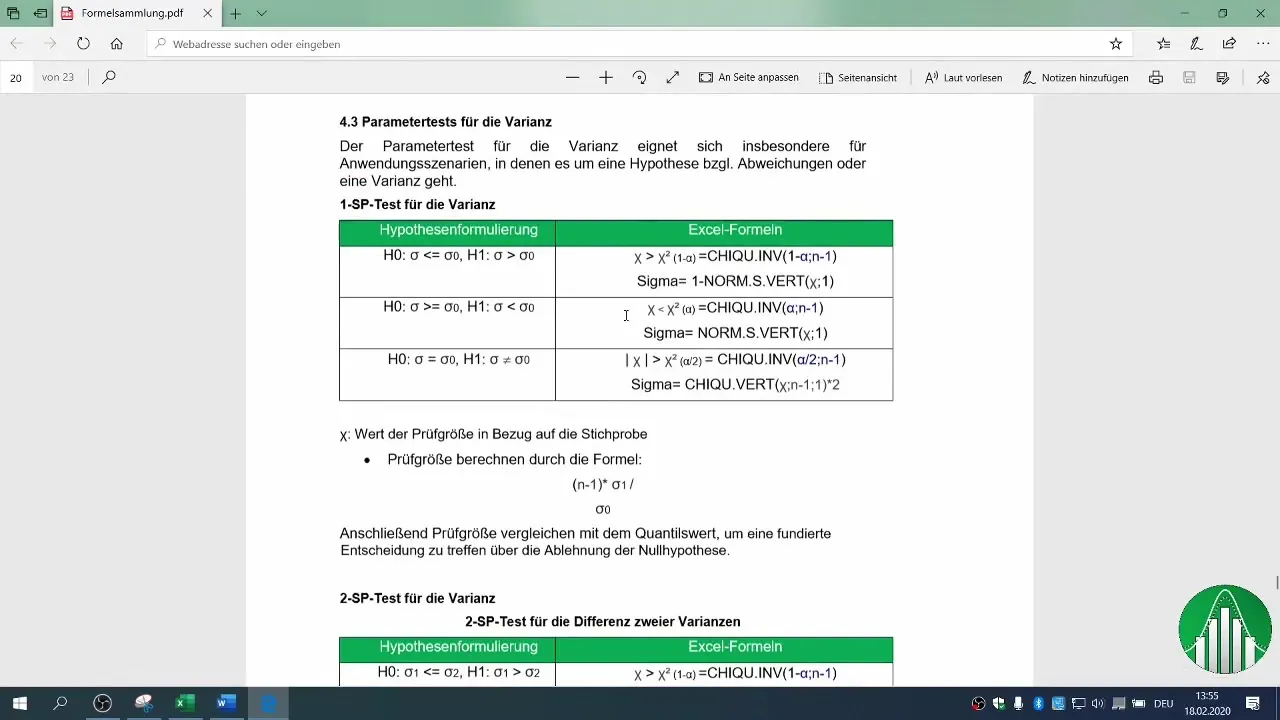
To determine if you can reject the null hypothesis, you need to establish the critical region. Use the chi-square distribution table for your confidence level. In our example, we used a 2% probability of error.
7. Comparing Test Statistic and Critical Value
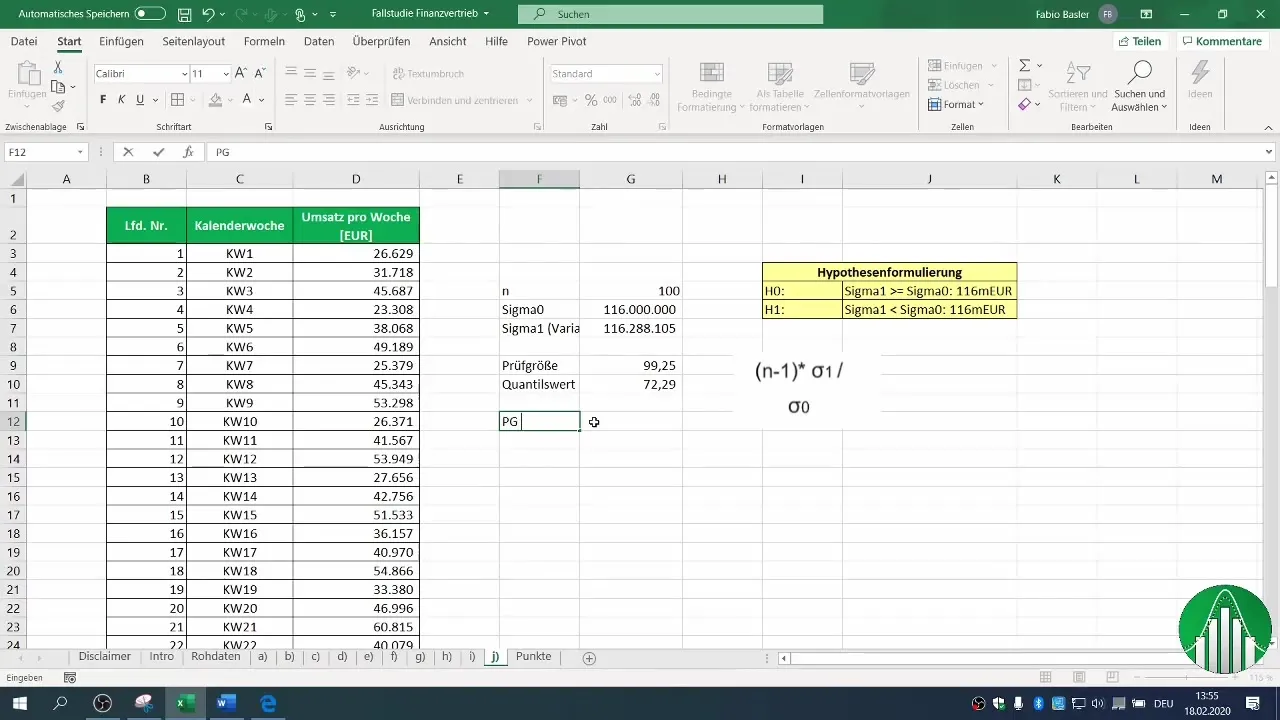
Now, check if your calculated test statistic is less than the critical value. In this case, we found that our test statistic is not less than the critical quantile value.
8. Drawing Conclusions
Based on your comparison, you can now decide whether to reject or not reject the null hypothesis. In our example, we found that the null hypothesis cannot be rejected. This suggests that the variance of your sales data still matches the assumed value or is even greater.
Summary
In this guide, we have extensively covered how to conduct a two-sample F-test in Excel. You have learned how to prepare your data, formulate hypotheses, calculate the test statistic, determine the critical region, and finally draw your conclusions. With these steps, you are well-equipped to independently carry out statistical analyses.
Frequently Asked Questions
What is a two-sample F-test?A two-sample F-test is used to compare the variances of two sets of data.
How do I formulate hypotheses for an F-test?The null hypothesis states that the variance is equal to or greater, while the alternative hypothesis assumes a decrease.
How do I find the critical value for my test?The critical value can be derived using chi-square tables based on the confidence level and degrees of freedom.
What should I do if the null hypothesis cannot be rejected?This means that the data align with the assumed variance value or even show higher fluctuations.
Do I need special software for the test?Excel is sufficient for conducting a two-sample F-test as long as the data is prepared.

