Working with Pivot Tables in Excel can significantly contribute to the analysis and evaluation of sales data. You will be able to not only visualize the data but also create filtering queries that will help you achieve precise results. In this tutorial, I will show you how to effectively utilize timelines and slicer tools to extract and manipulate specific sales data. This is particularly useful if you want to calculate your employees' commissions by individual months, for example.
Key Insights
- Using timelines for quick data filtering by date
- Utilizing slicers for appealing visual data filtering
- The importance of proper arrangement in Pivot Tables to display relevant information
Step-by-Step Guide
1. Creating a Pivot Table
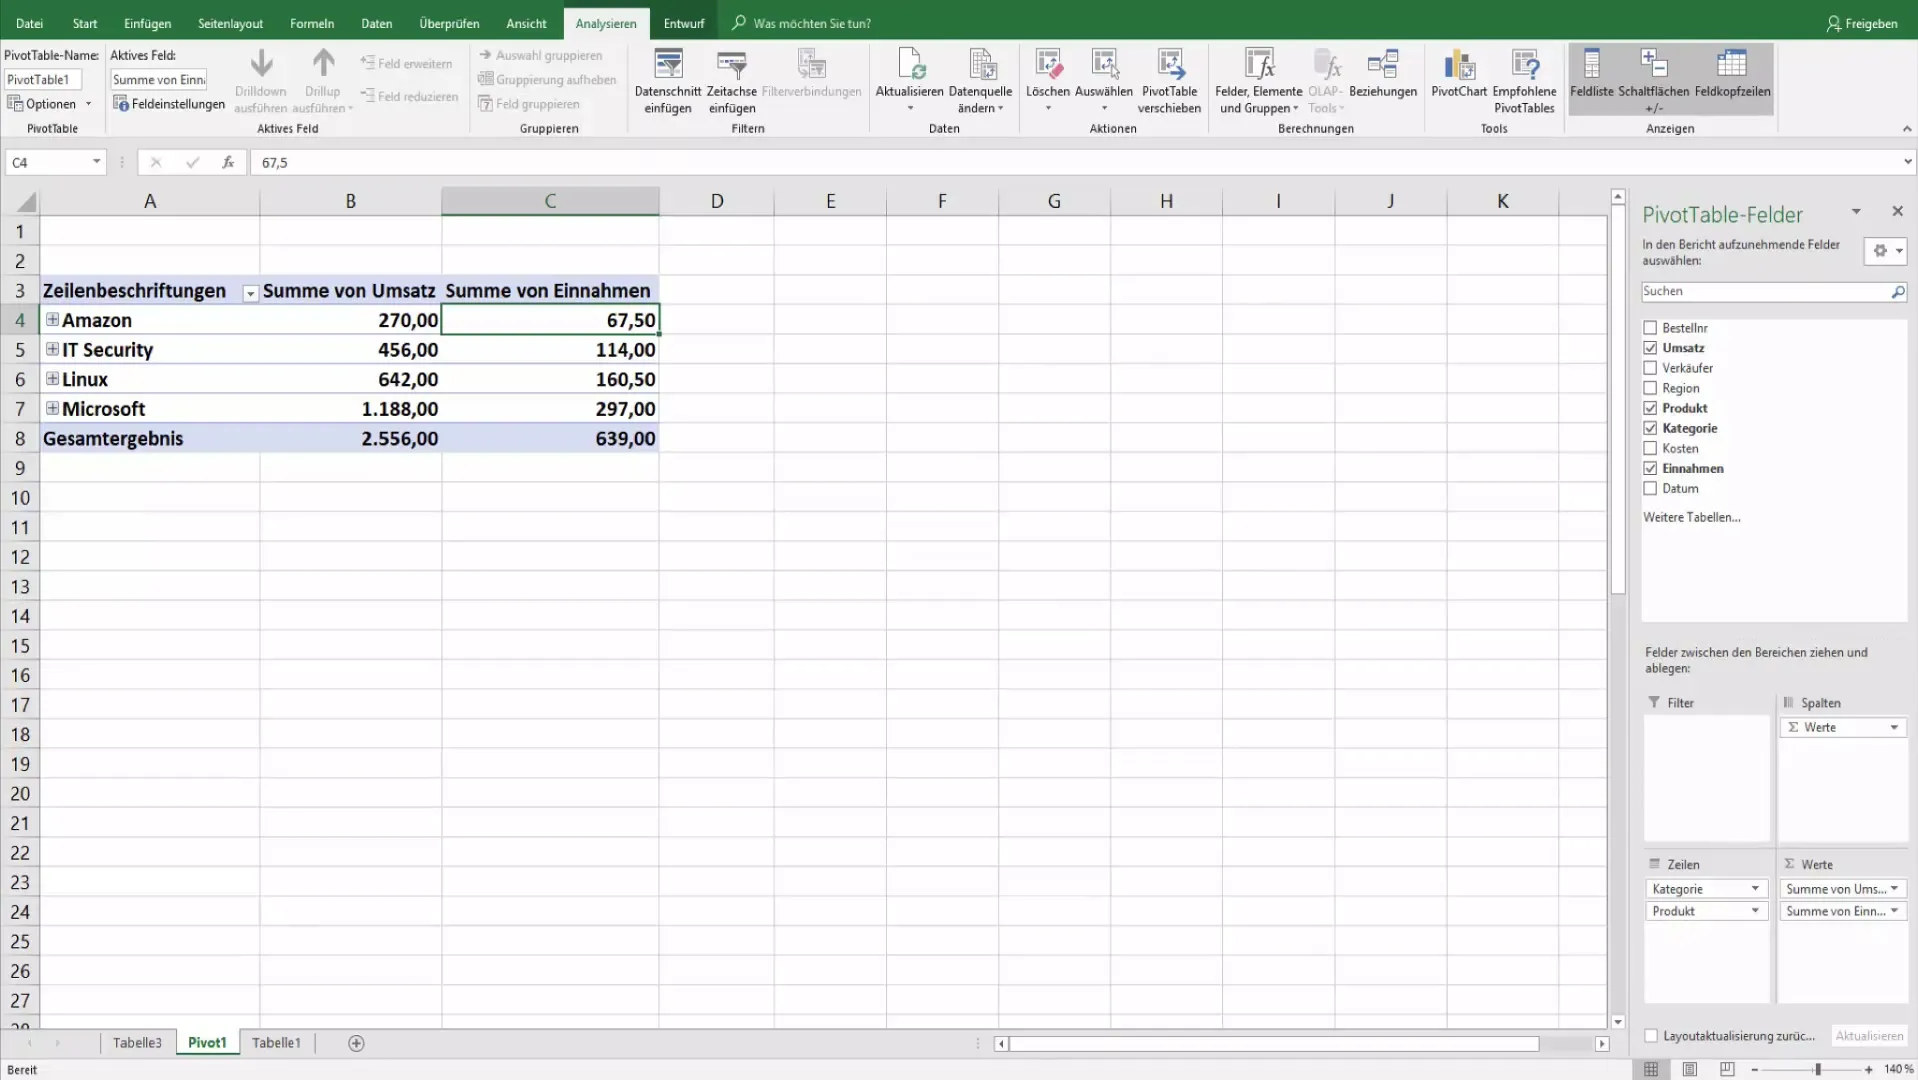
First, you need to convert your data into a Pivot Table. Make sure you have the relevant dates and sales figures. You can do this by selecting the data and choosing the "Pivot Table" option in the "Insert" menu. Ensure that you input the data correctly to avoid errors.
2. Adding the Date Field
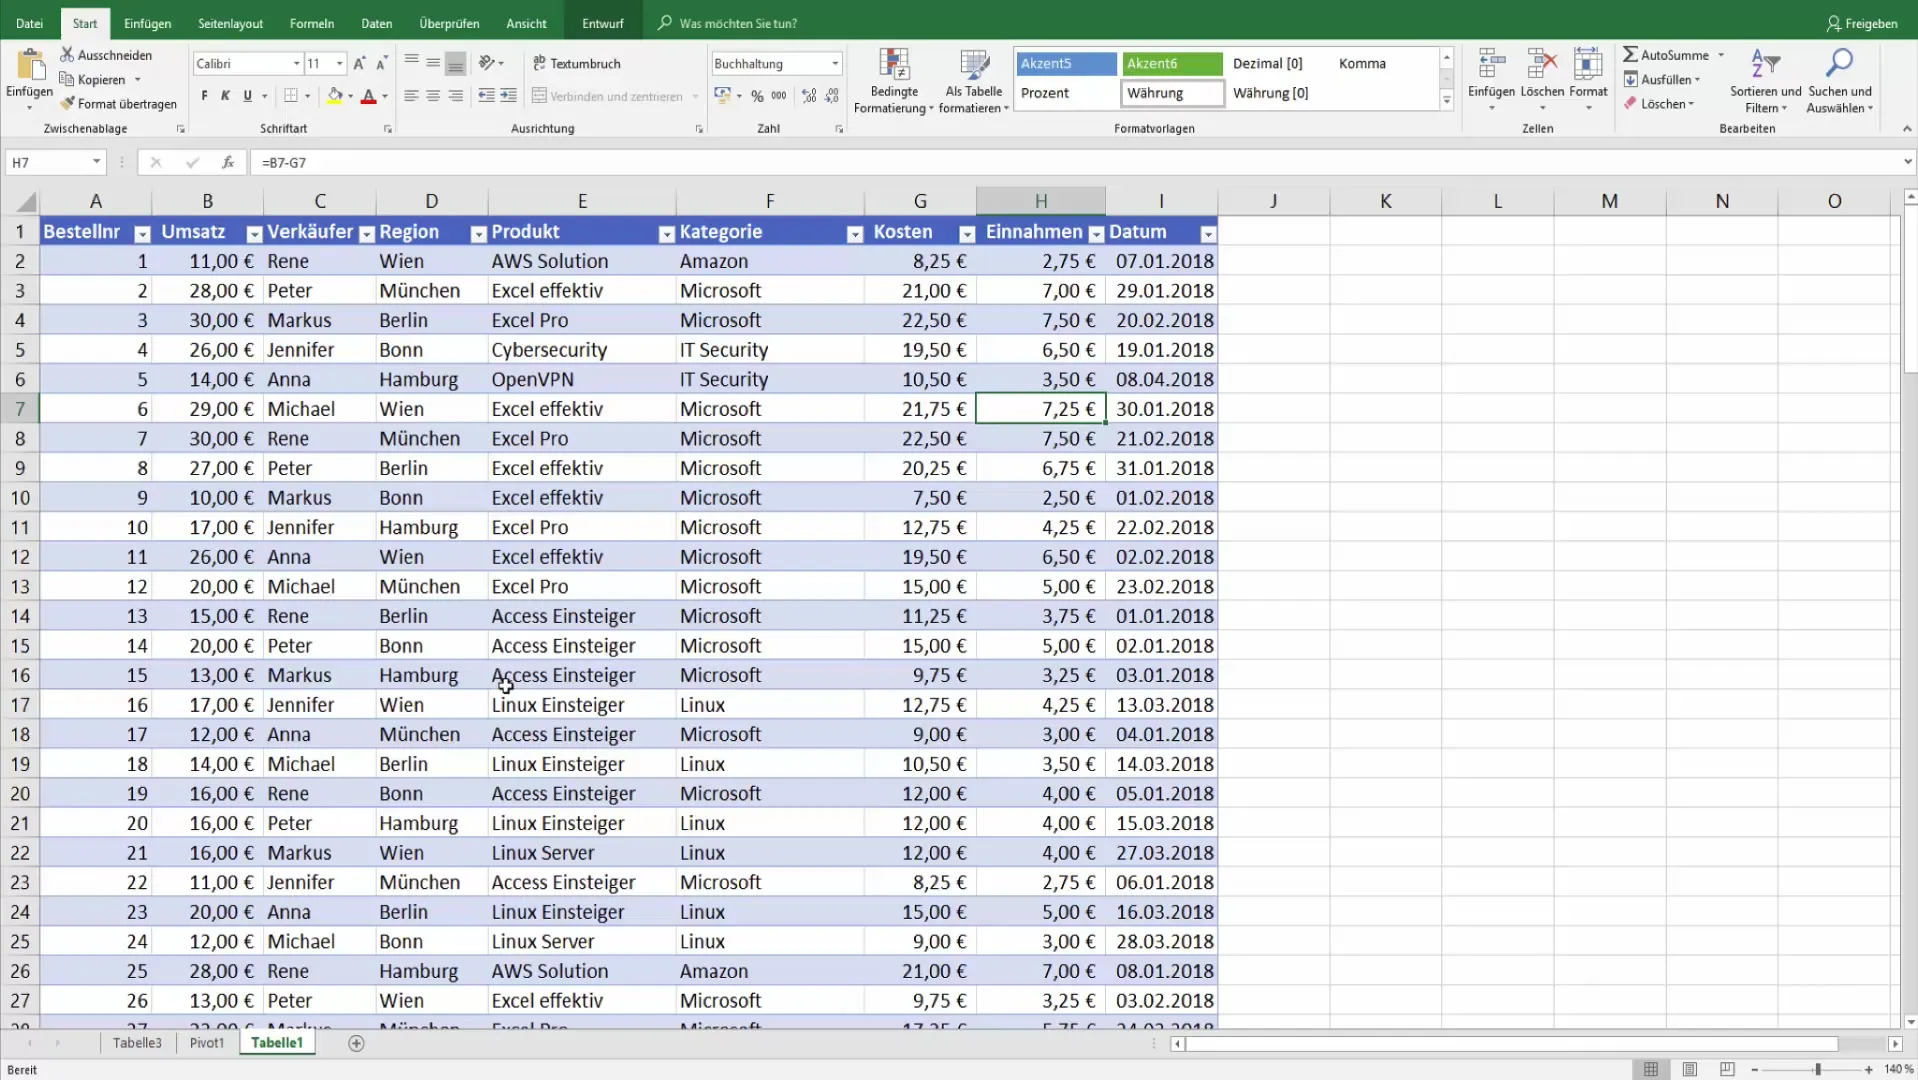
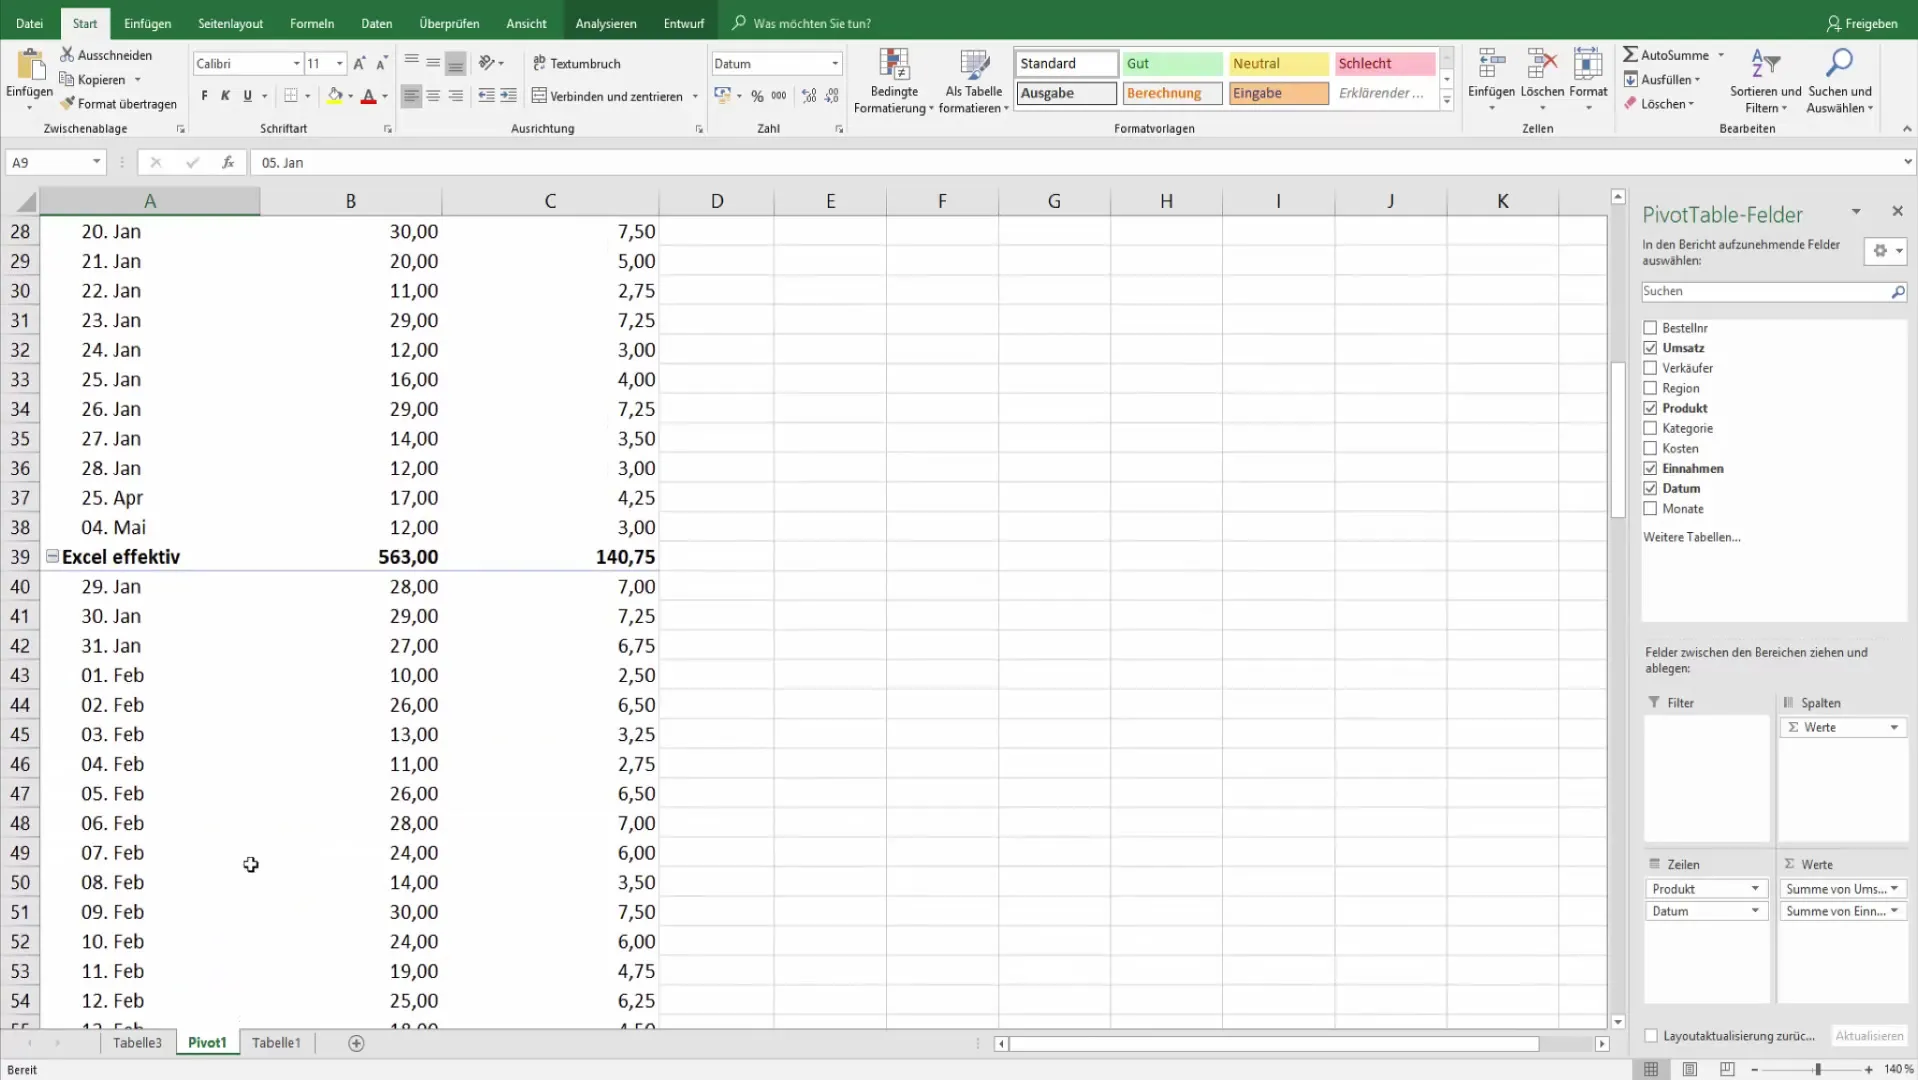
Insert the date field into the rows of the Pivot Table. This will allow you to break down the sales by date. This view will help you later on in filtering the data by specific time periods.
3. Filtering by Specific Months
Now, you can select only the sales for particular months. Remove the product categories if they are not relevant and focus on the sales data you want to filter. To do this, click on the filter option in the Pivot Table and choose the months you want to analyze, such as January and February.
4. Adding the Timeline
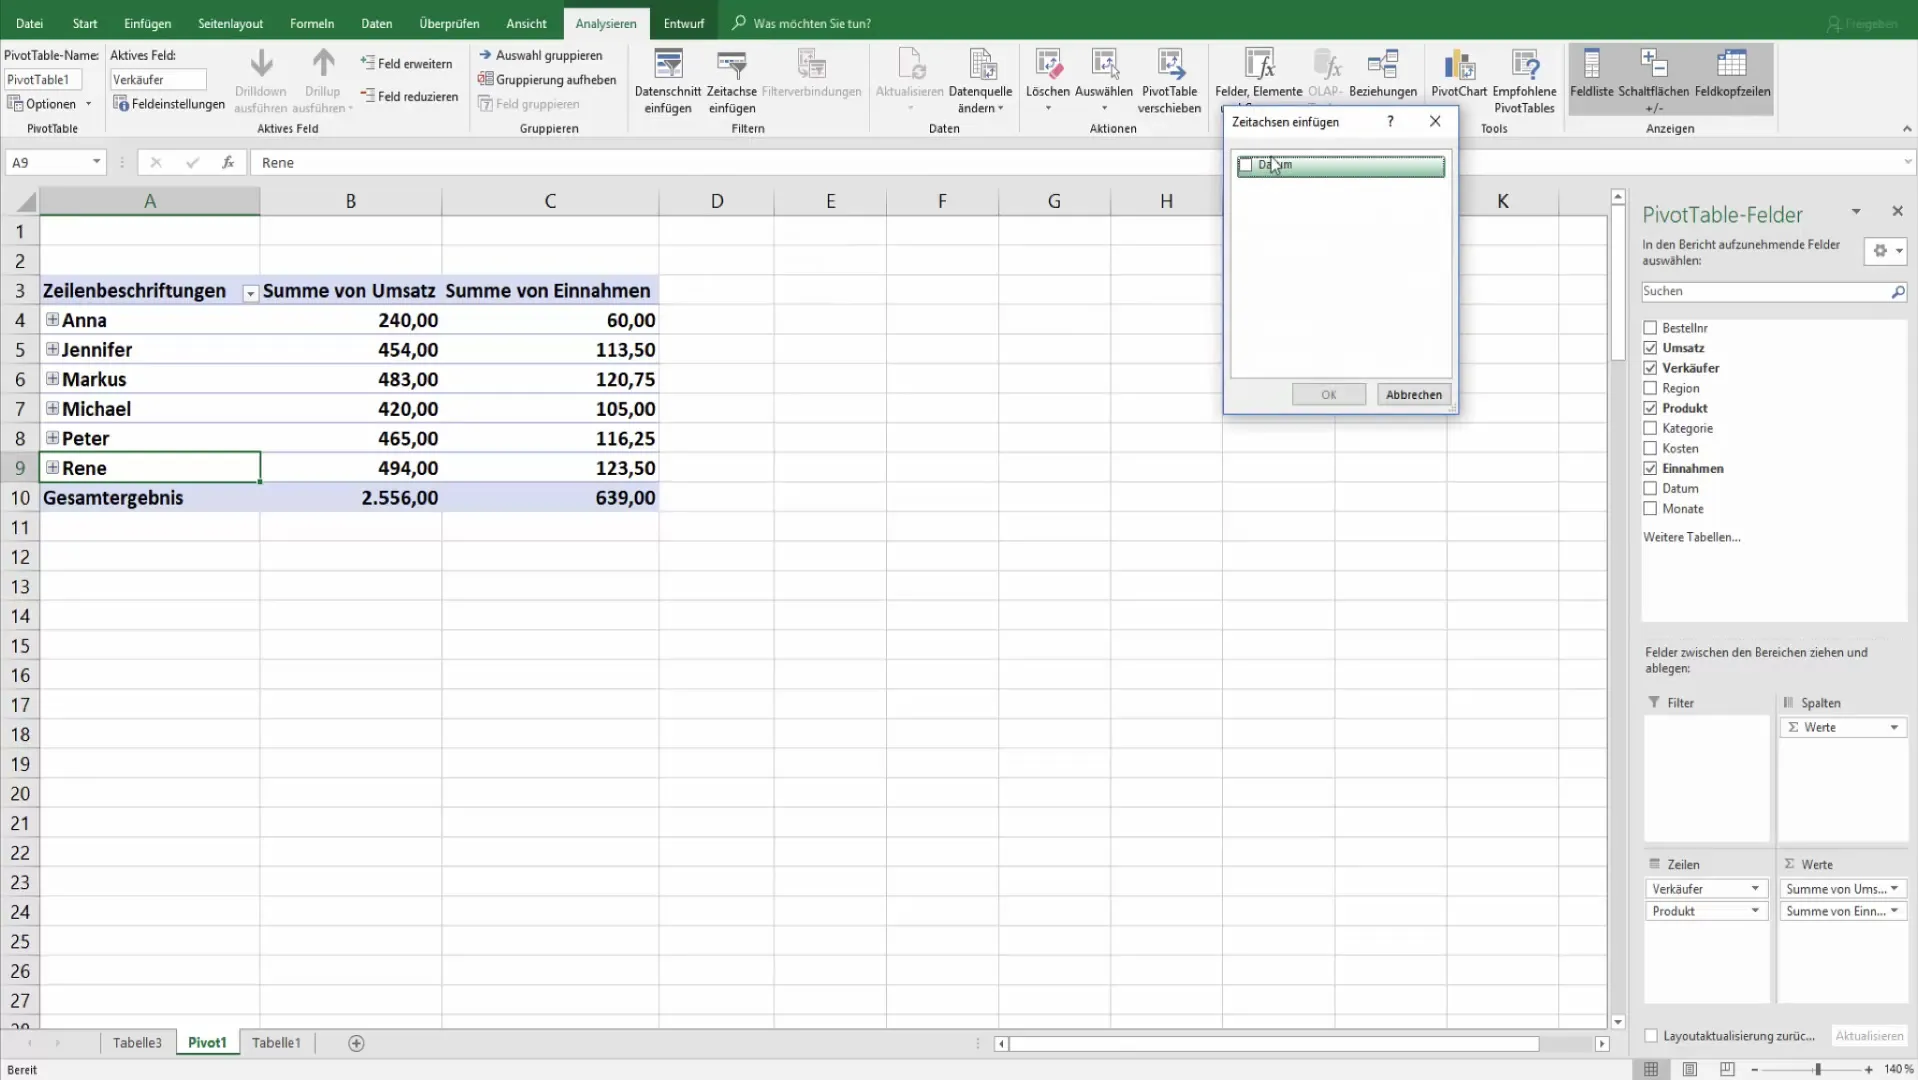
Activate the Pivot Tools and go to the Analyze tab. There, you will find the option to add a timeline. Select your date field to enable the timeline feature. This will help you create a clear visual representation of your sales data by months or quarters.
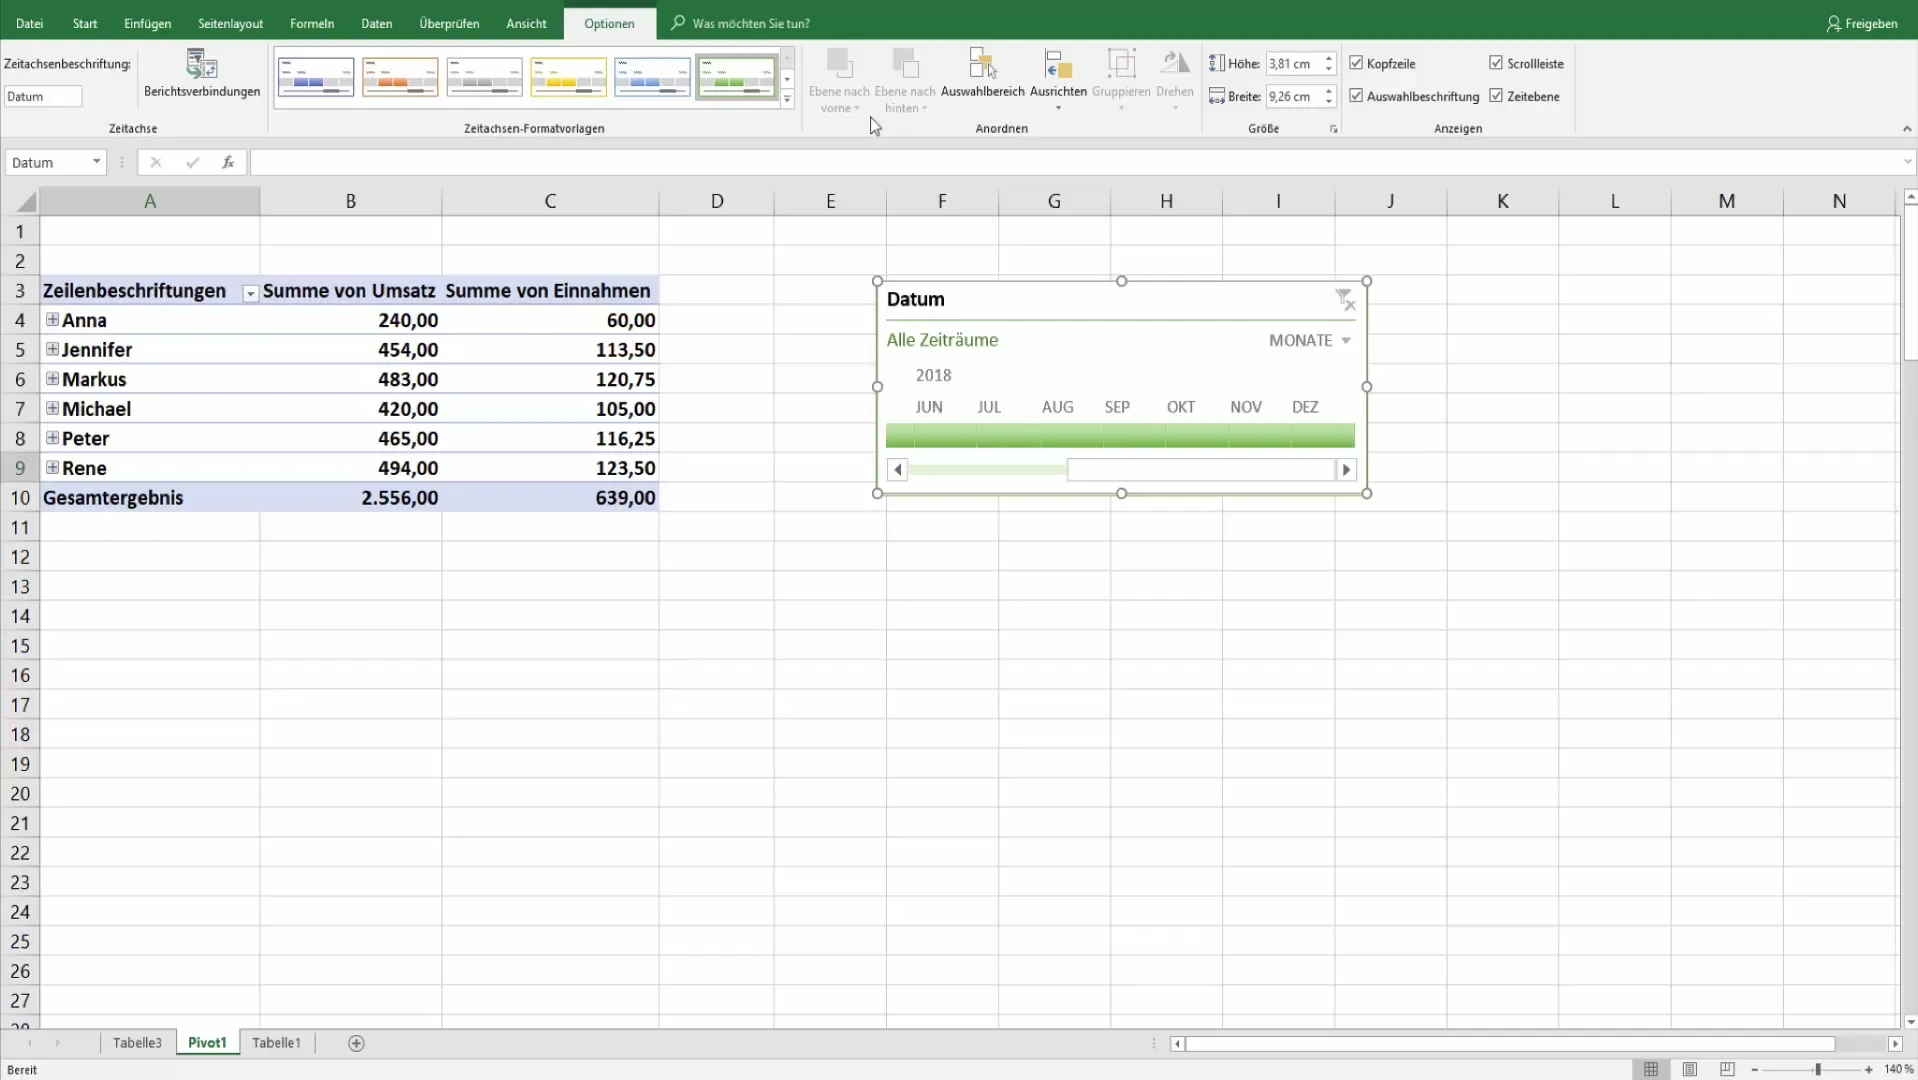
5. Customizing the Timeline
While creating the timeline, you can also customize the design. With the options in the timeline tools, you can tailor the labels and layout of the timeline to your preferences. Ensure everything remains clear so that you can quickly access the needed information.
6. Filtering Based on the Timeline
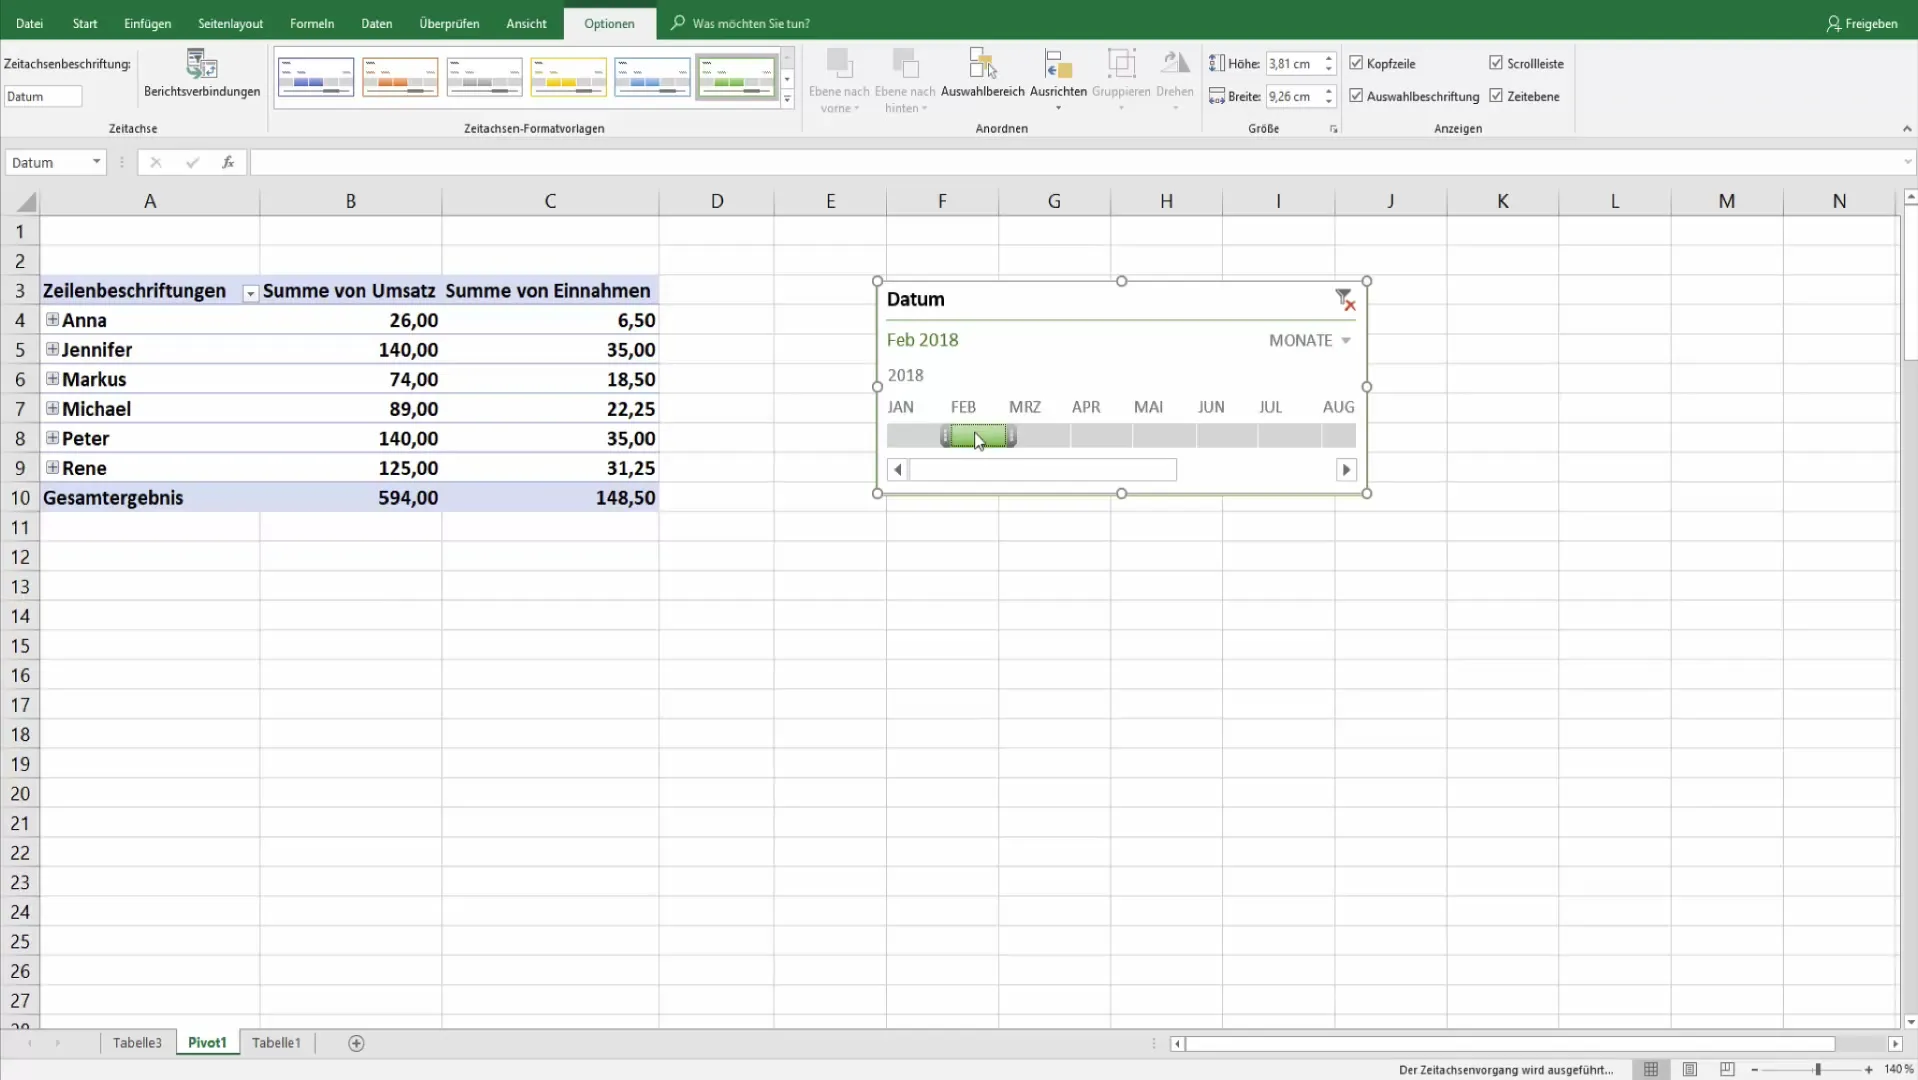
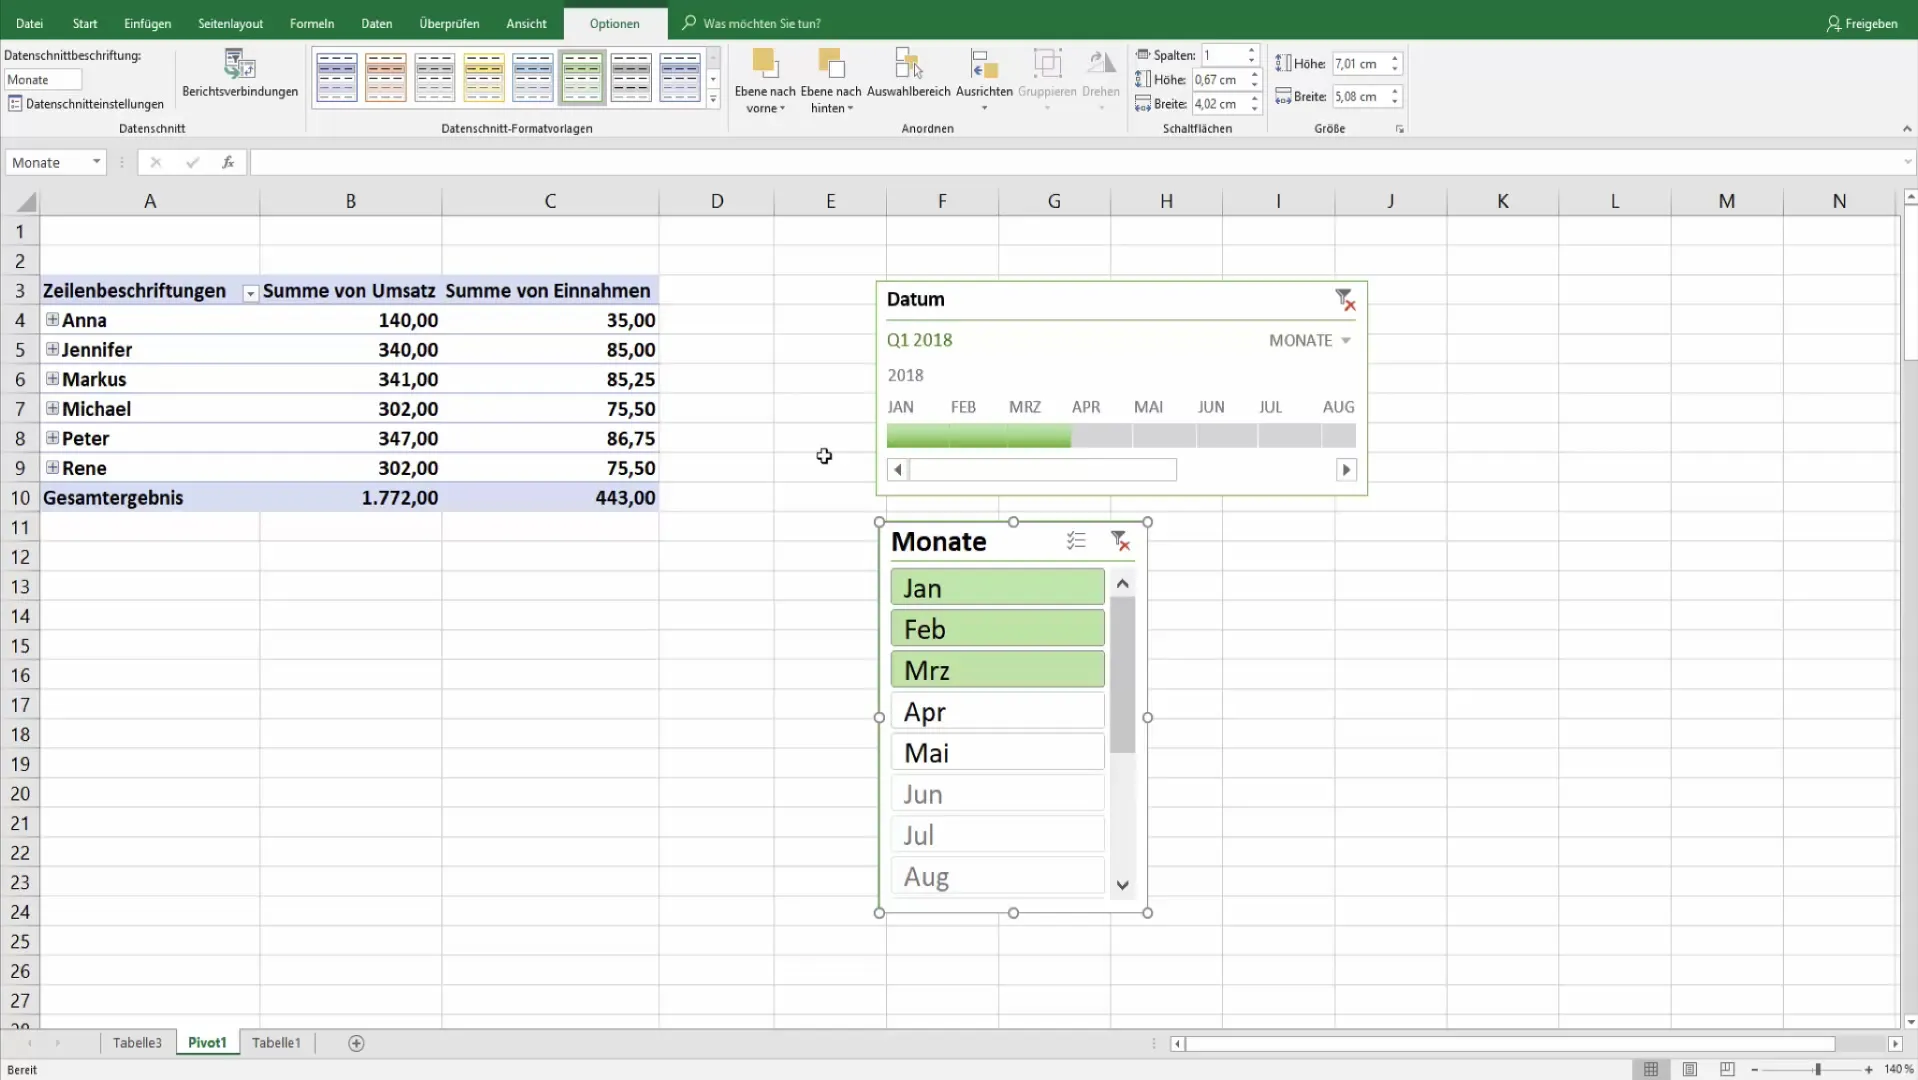
Now, you can select different time periods by clicking on the months in your timeline. You can switch between months and see the sales directly in the Pivot Table in real time. This will provide you with immediate feedback on the financial results in the selected periods.
7. Using Slicers
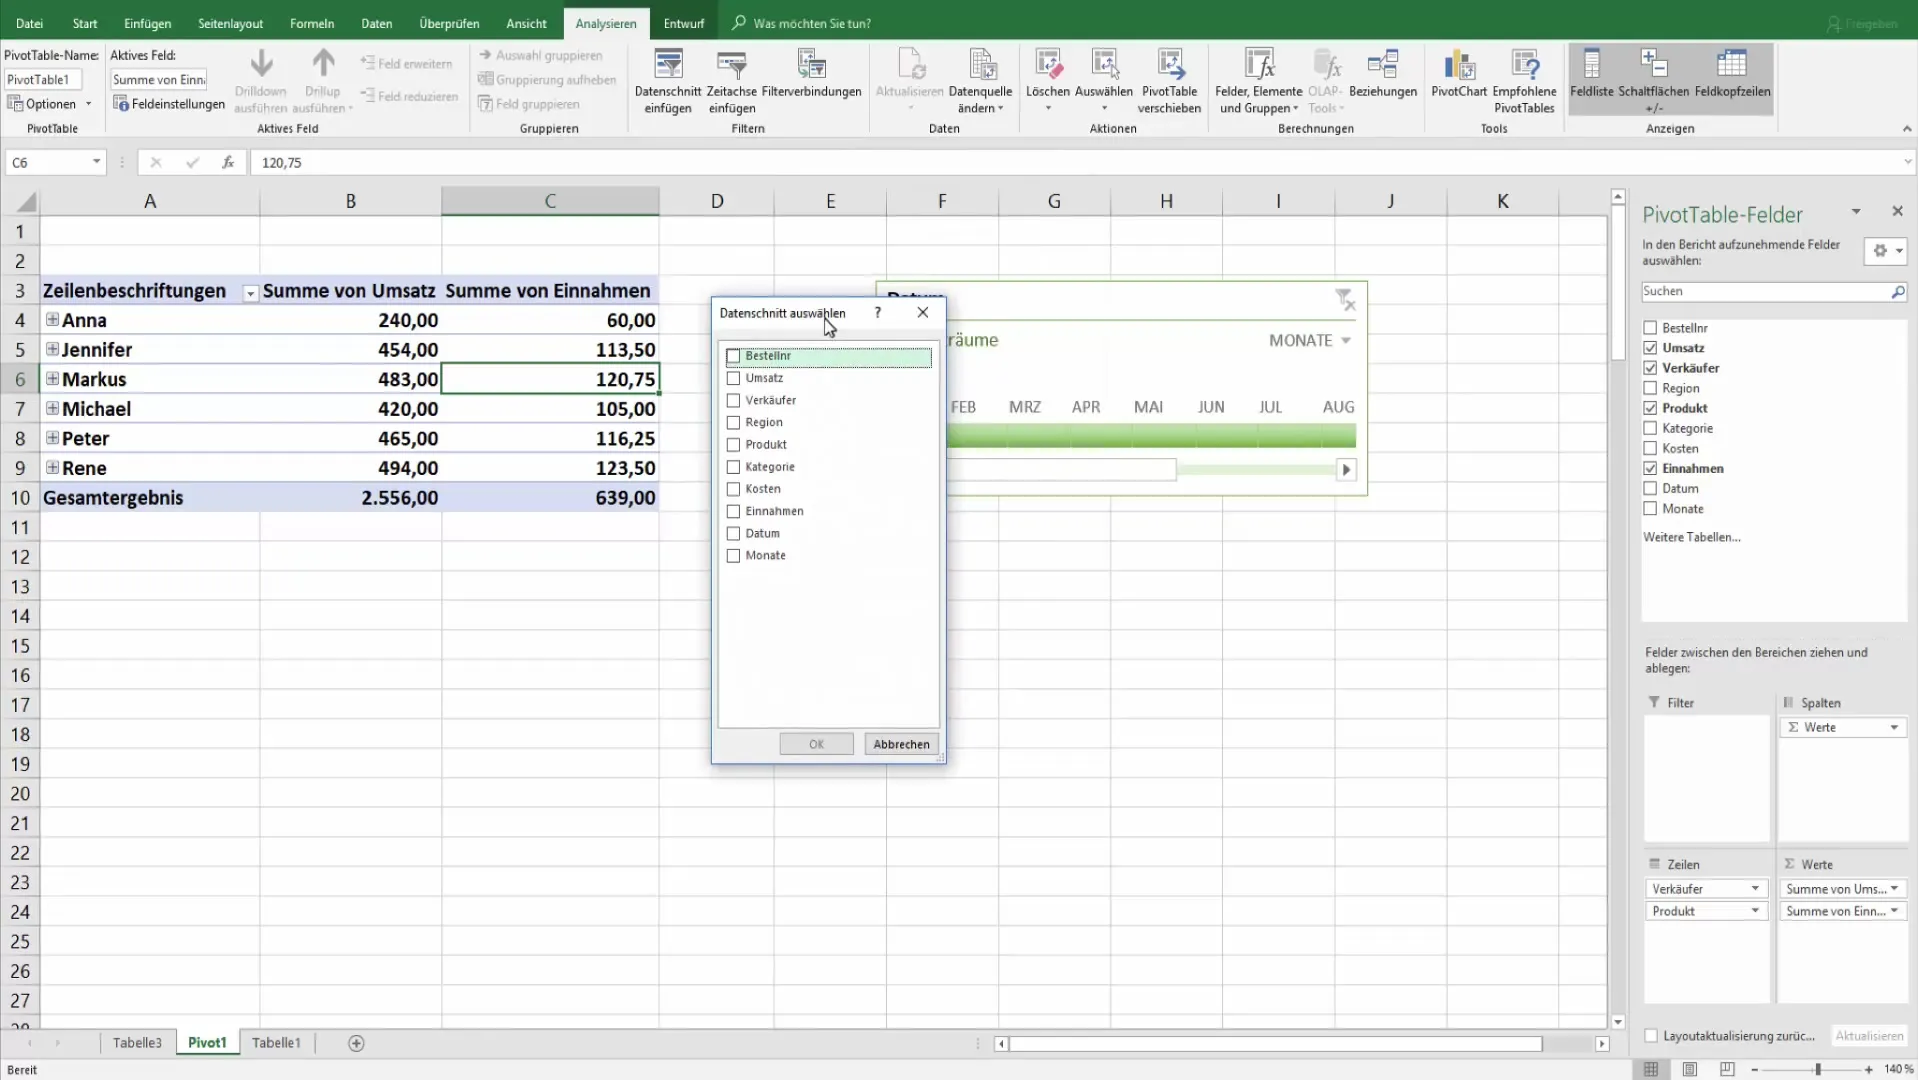
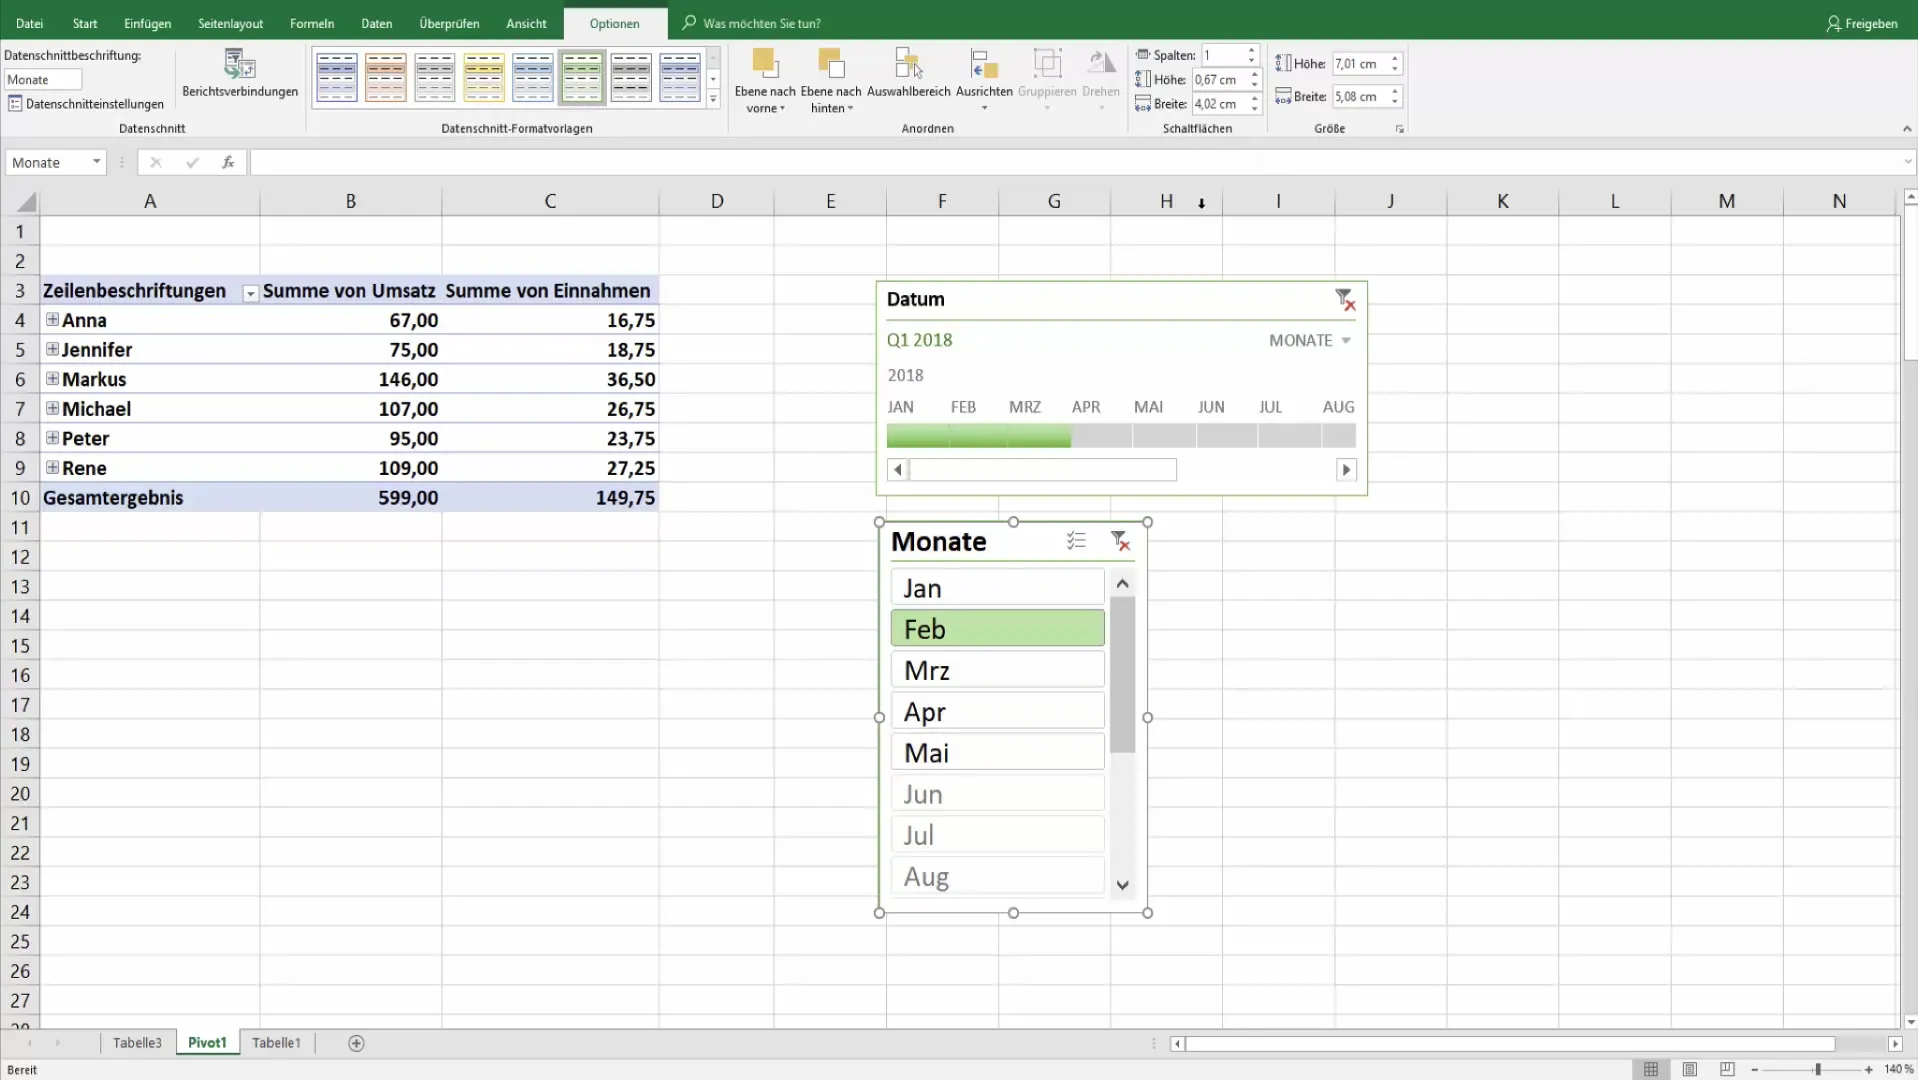
In addition to the timeline, you can also use slicers. Go back to the Pivot Tools and add a slicer for the months. This allows you to utilize a visual interface to filter your data. Slicers are often preferred as they are more user-friendly and interactive.
8. Selecting Multiples with Slicers
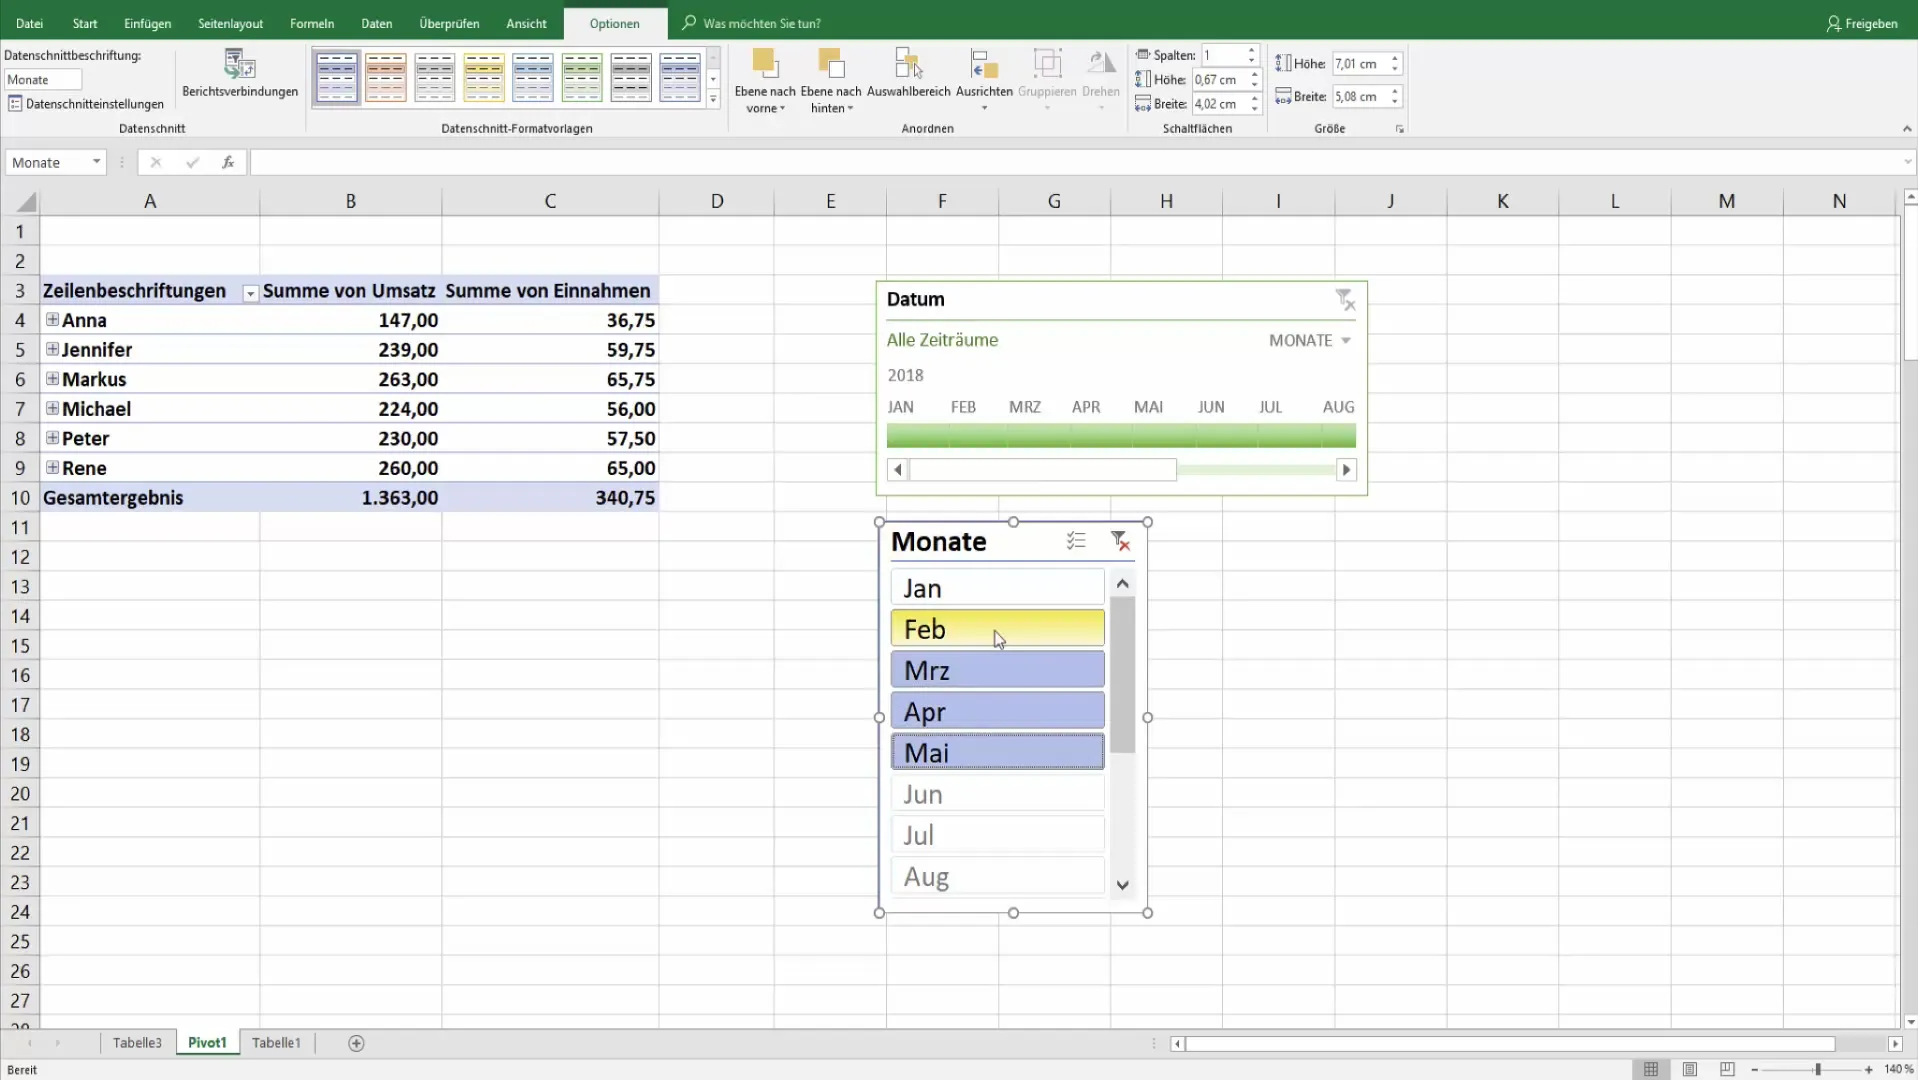
Use the control key to select multiple months at once. This allows you to target specific sales periods without having to set a filter multiple times. This saves time and facilitates data analysis.
9. Adapting Slicers
Similar to the time axis, you can customize the appearance of your slicers. This gives you the flexibility on how your revenue data is displayed and makes the analysis visually appealing.
10. Total Results and Analysis
By combining time axes and slicers, you have the opportunity to conduct comprehensive analyses and precisely filter data. You can easily extract the necessary information to monitor all sales movements and make informed decisions.
Summary
In this guide, you have learned how to use time axes and slicers in pivot tables to filter and evaluate revenues sensibly. Use these tools to optimize your reporting and keep track of important metrics.
Frequently Asked Questions
How do I add a pivot table?Select the data and go to "Insert" > "Pivot Table".
Can I select multiple months on the time axis?Yes, by simply clicking on the months or using the control key.
How can I customize the design of my time axis?Use the options in the time axis tools to change layout and labels.
How does the slicer work?A slicer allows you to visually select data by clicking on filter buttons.
What are the benefits of using time axes and slicers?They make data analysis faster, easier, and more organized by helping you filter specific time frames.


