Creating and customizing Pivot Tables in Excel can make the difference between a cluttered and a clearly structured data presentation. In this tutorial, you will learn how to effectively design the layout of your pivot tables to present your data clearly and attractively.
Key Takeaways
- Making adjustments to the pivot table display makes information easier to understand.
- Utilize subtotals and grand totals to gain better insights.
- In addition to numbers, other calculations like averages can also be displayed.
Step-by-Step Guide
Step 1: Removing Unnecessary Elements
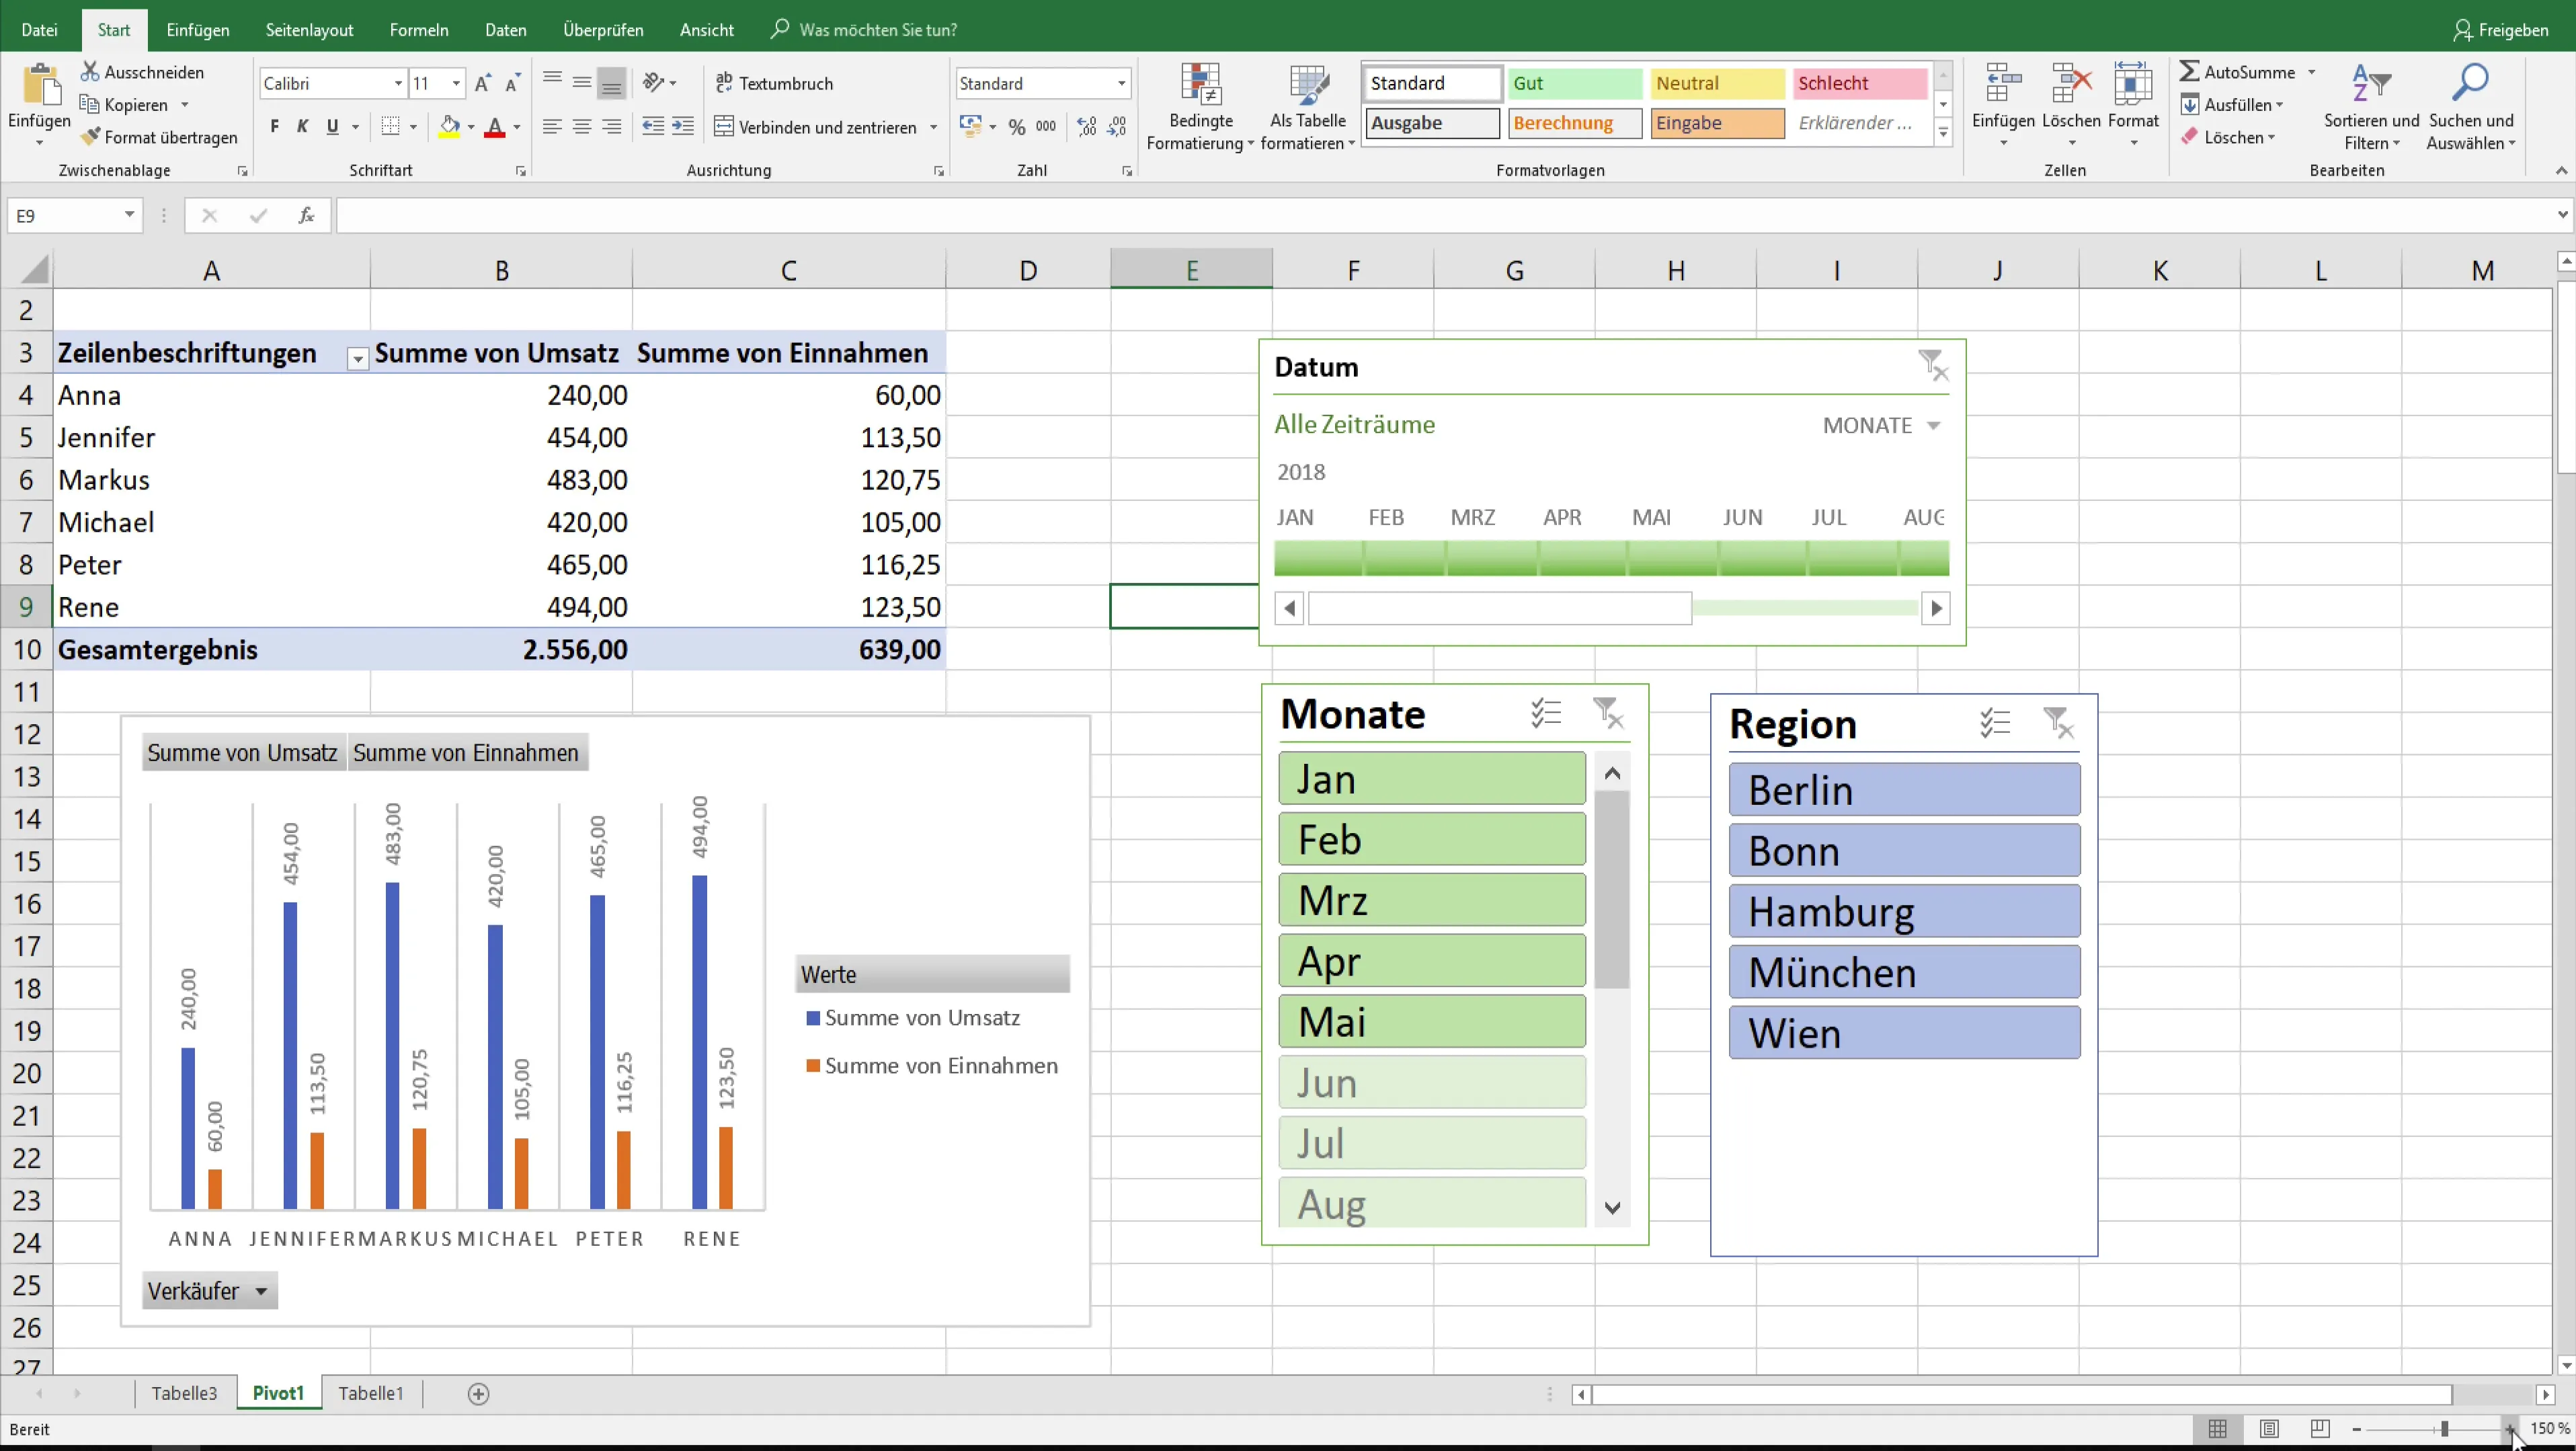
First, you should remove everything unnecessary from your pivot table. Highlight the chart that is not currently needed and delete it to make space. This makes it easier to view the actual pivot table.
Step 2: Adjusting Layout and Formatting
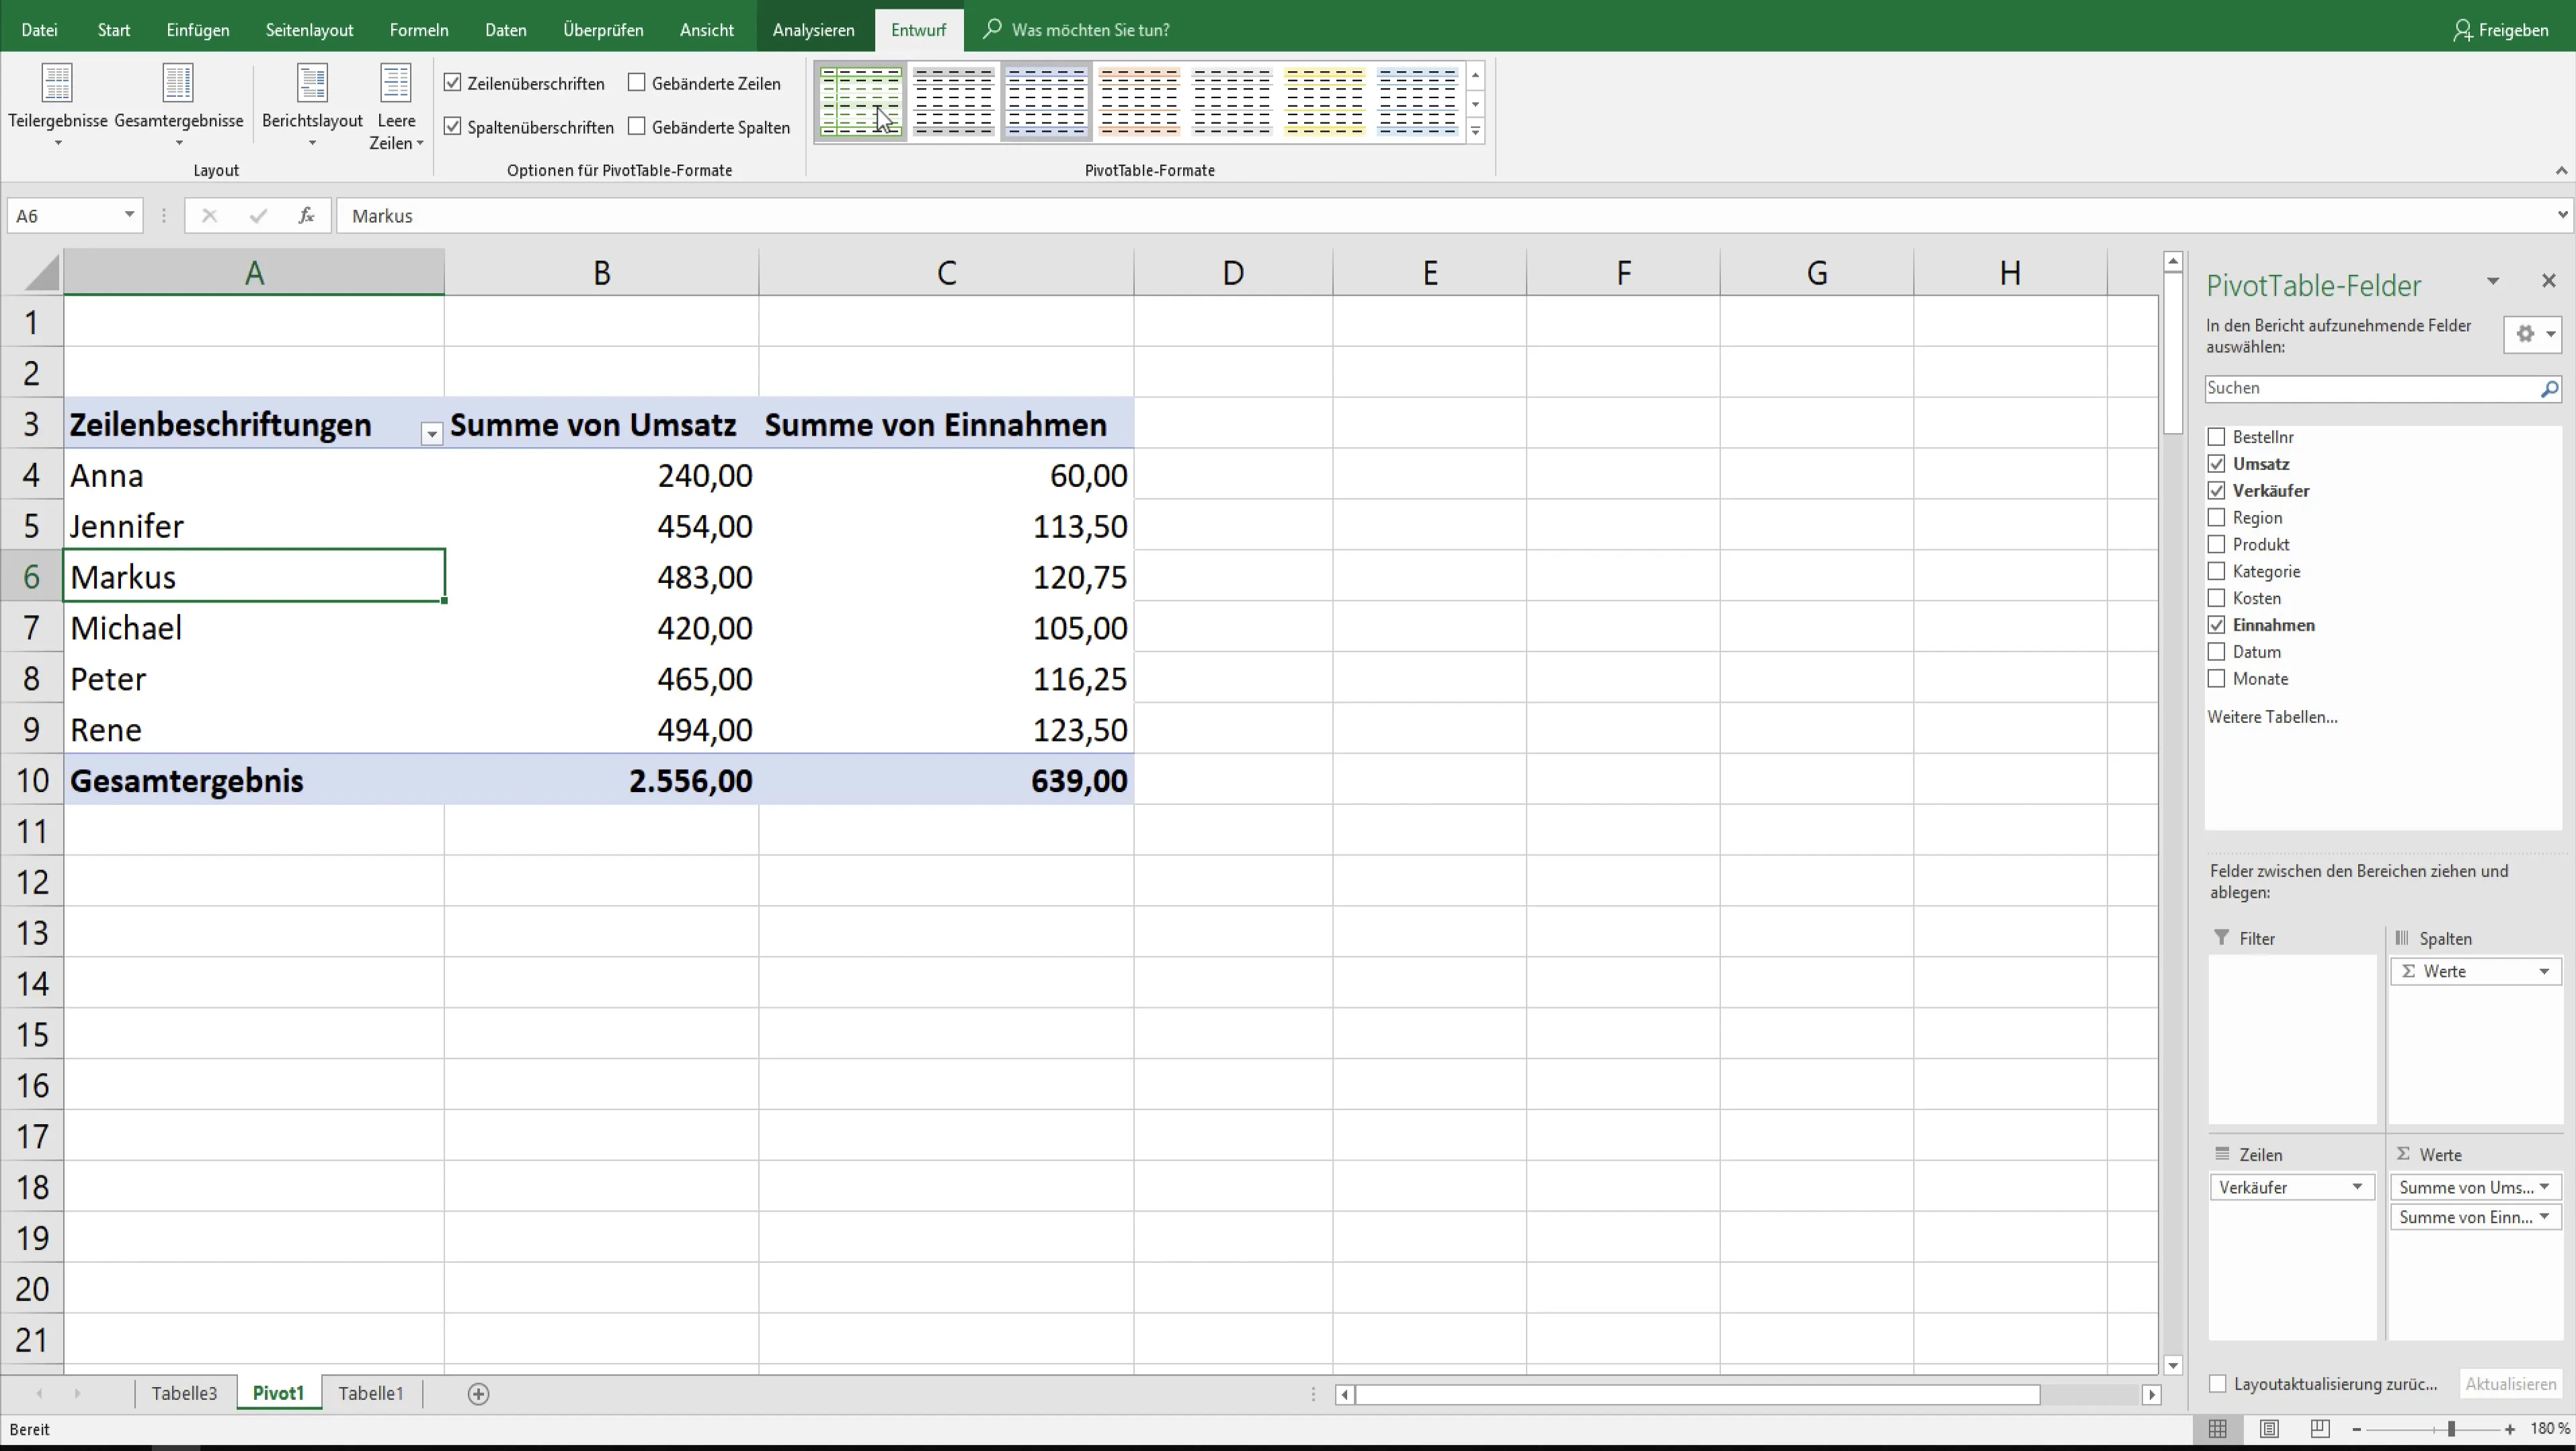
To optimize the layout of your pivot table, go to the "Design" tab and explore the various formatting options. Here, you can adjust the row and column headers to create a clearer separation of the data.
Step 3: Adding Subtotals and Grand Totals
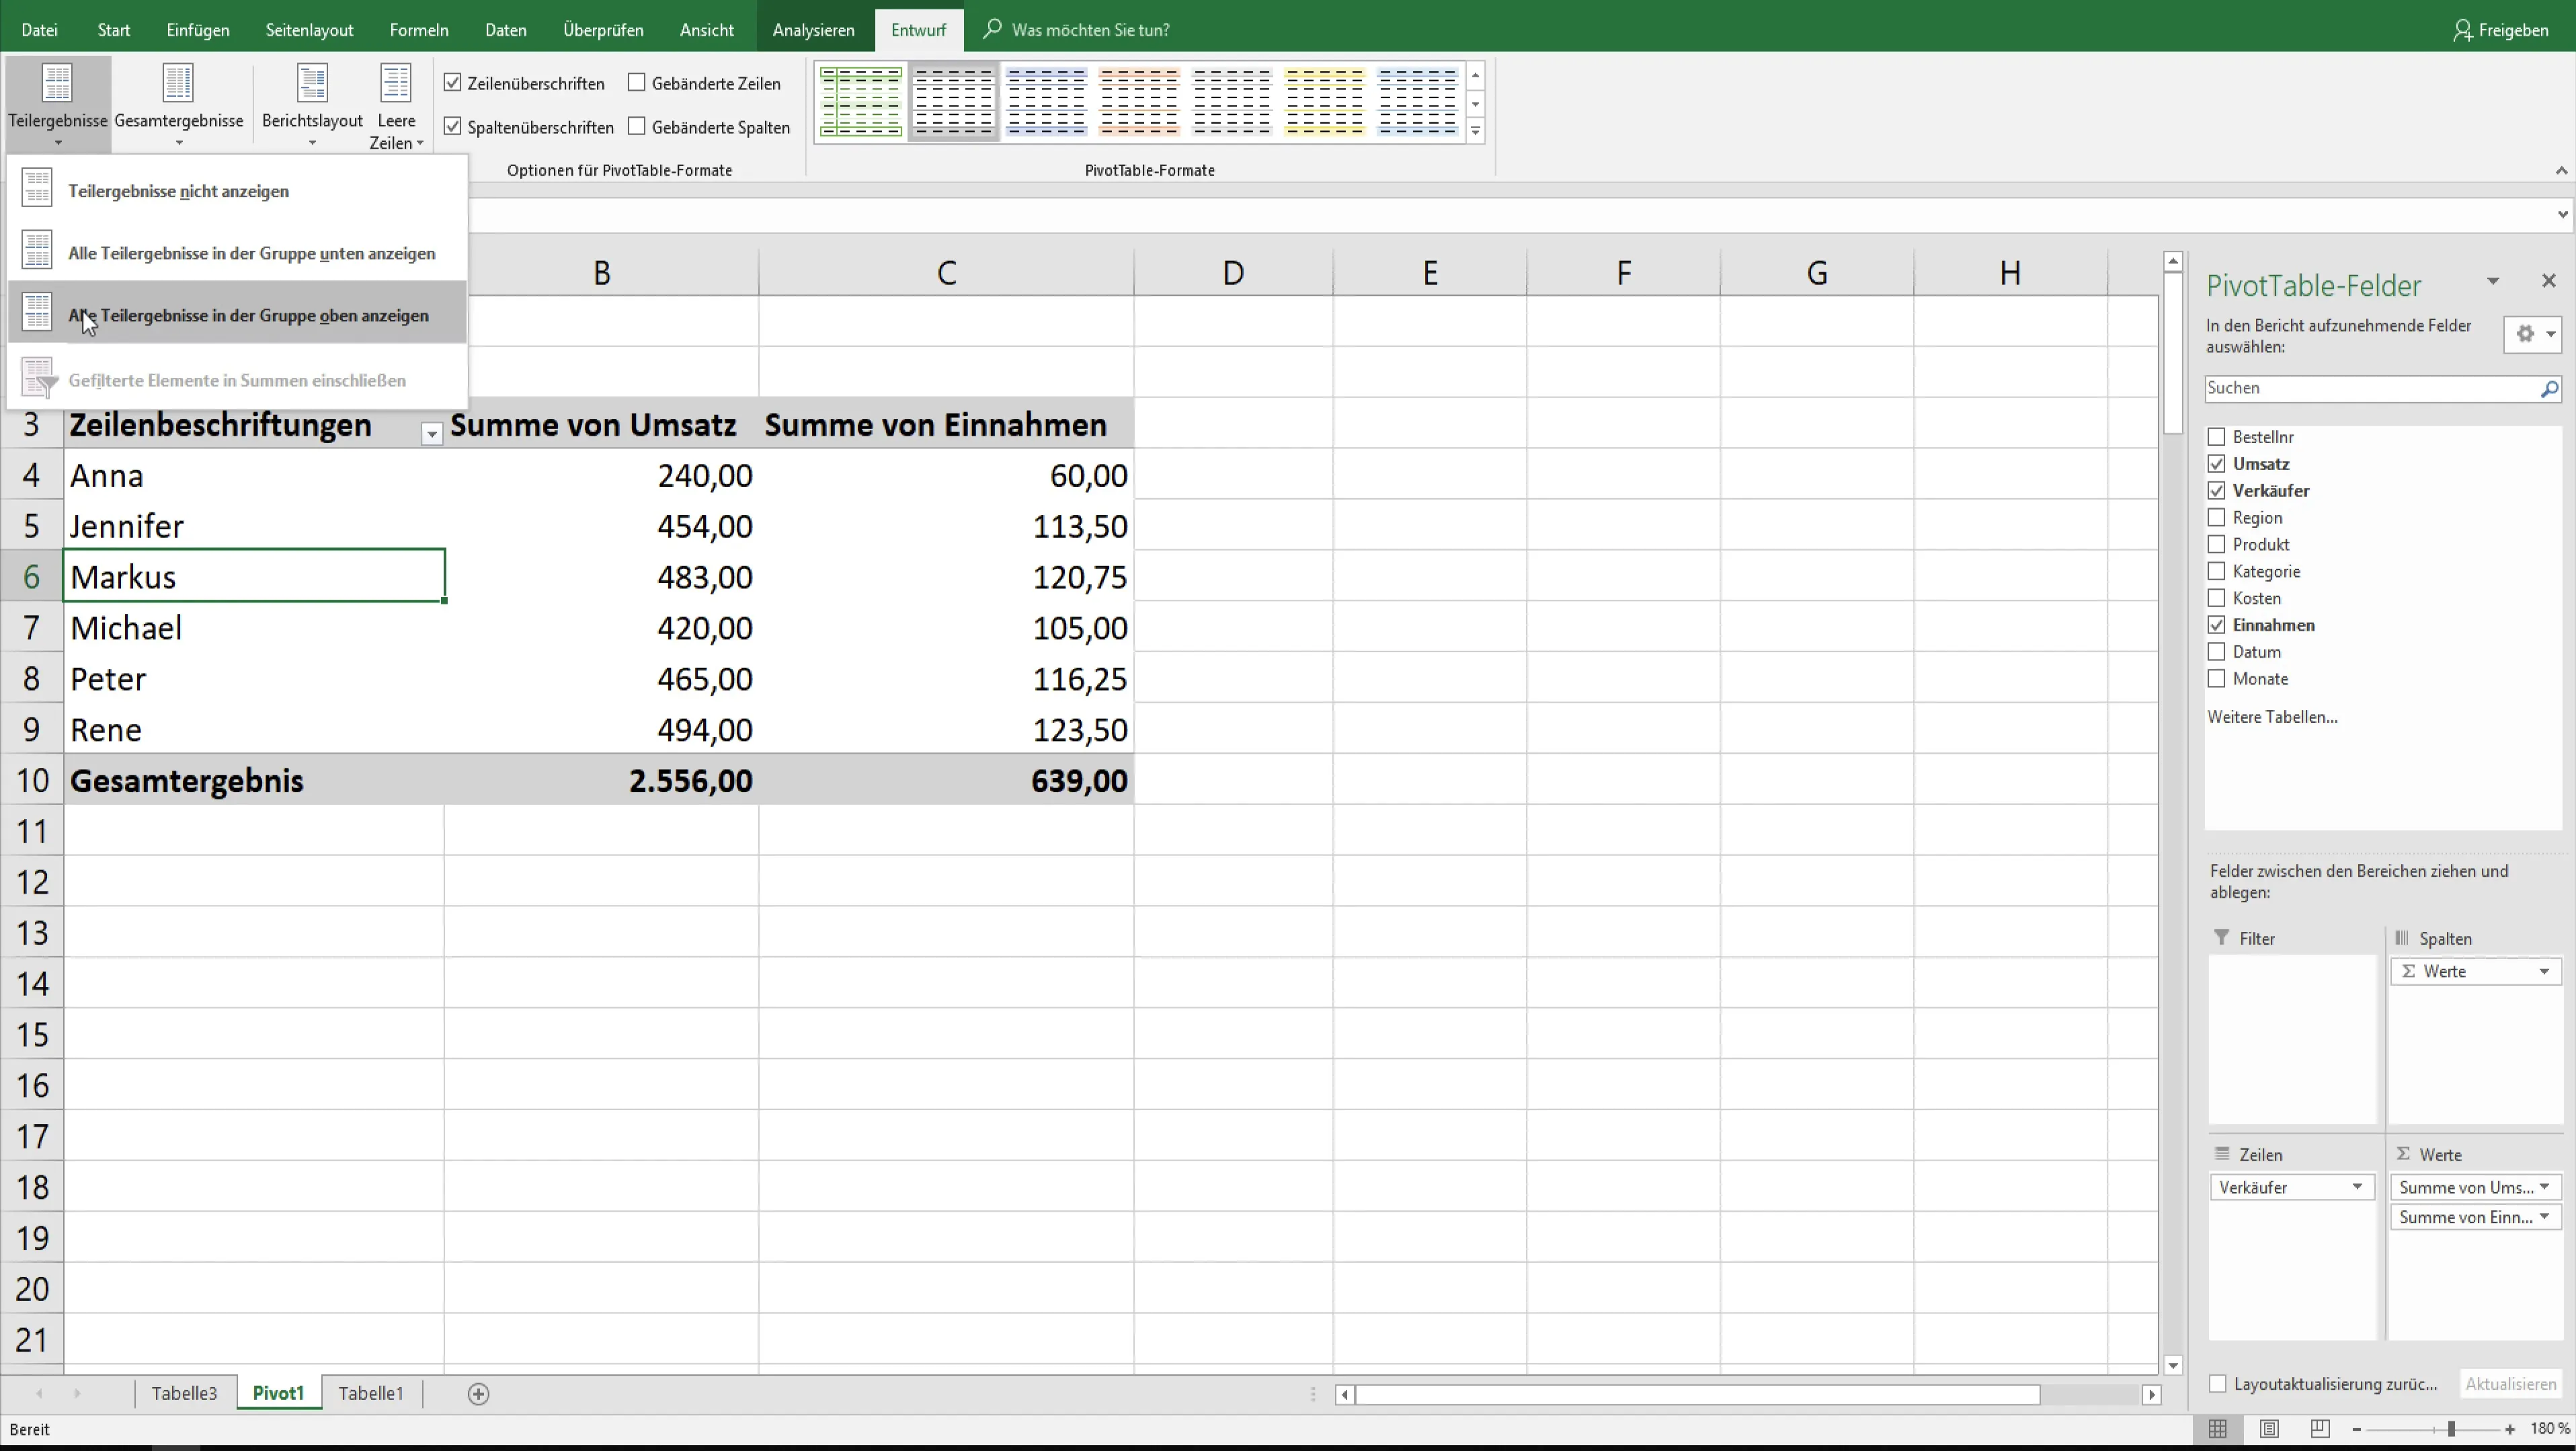
Add subtotals by accessing the relevant options in the "Analyse" tab. Choose "Show Subtotals" and decide whether you want them to be displayed above or below the data within the groups.
Step 4: Activating Grand Totals
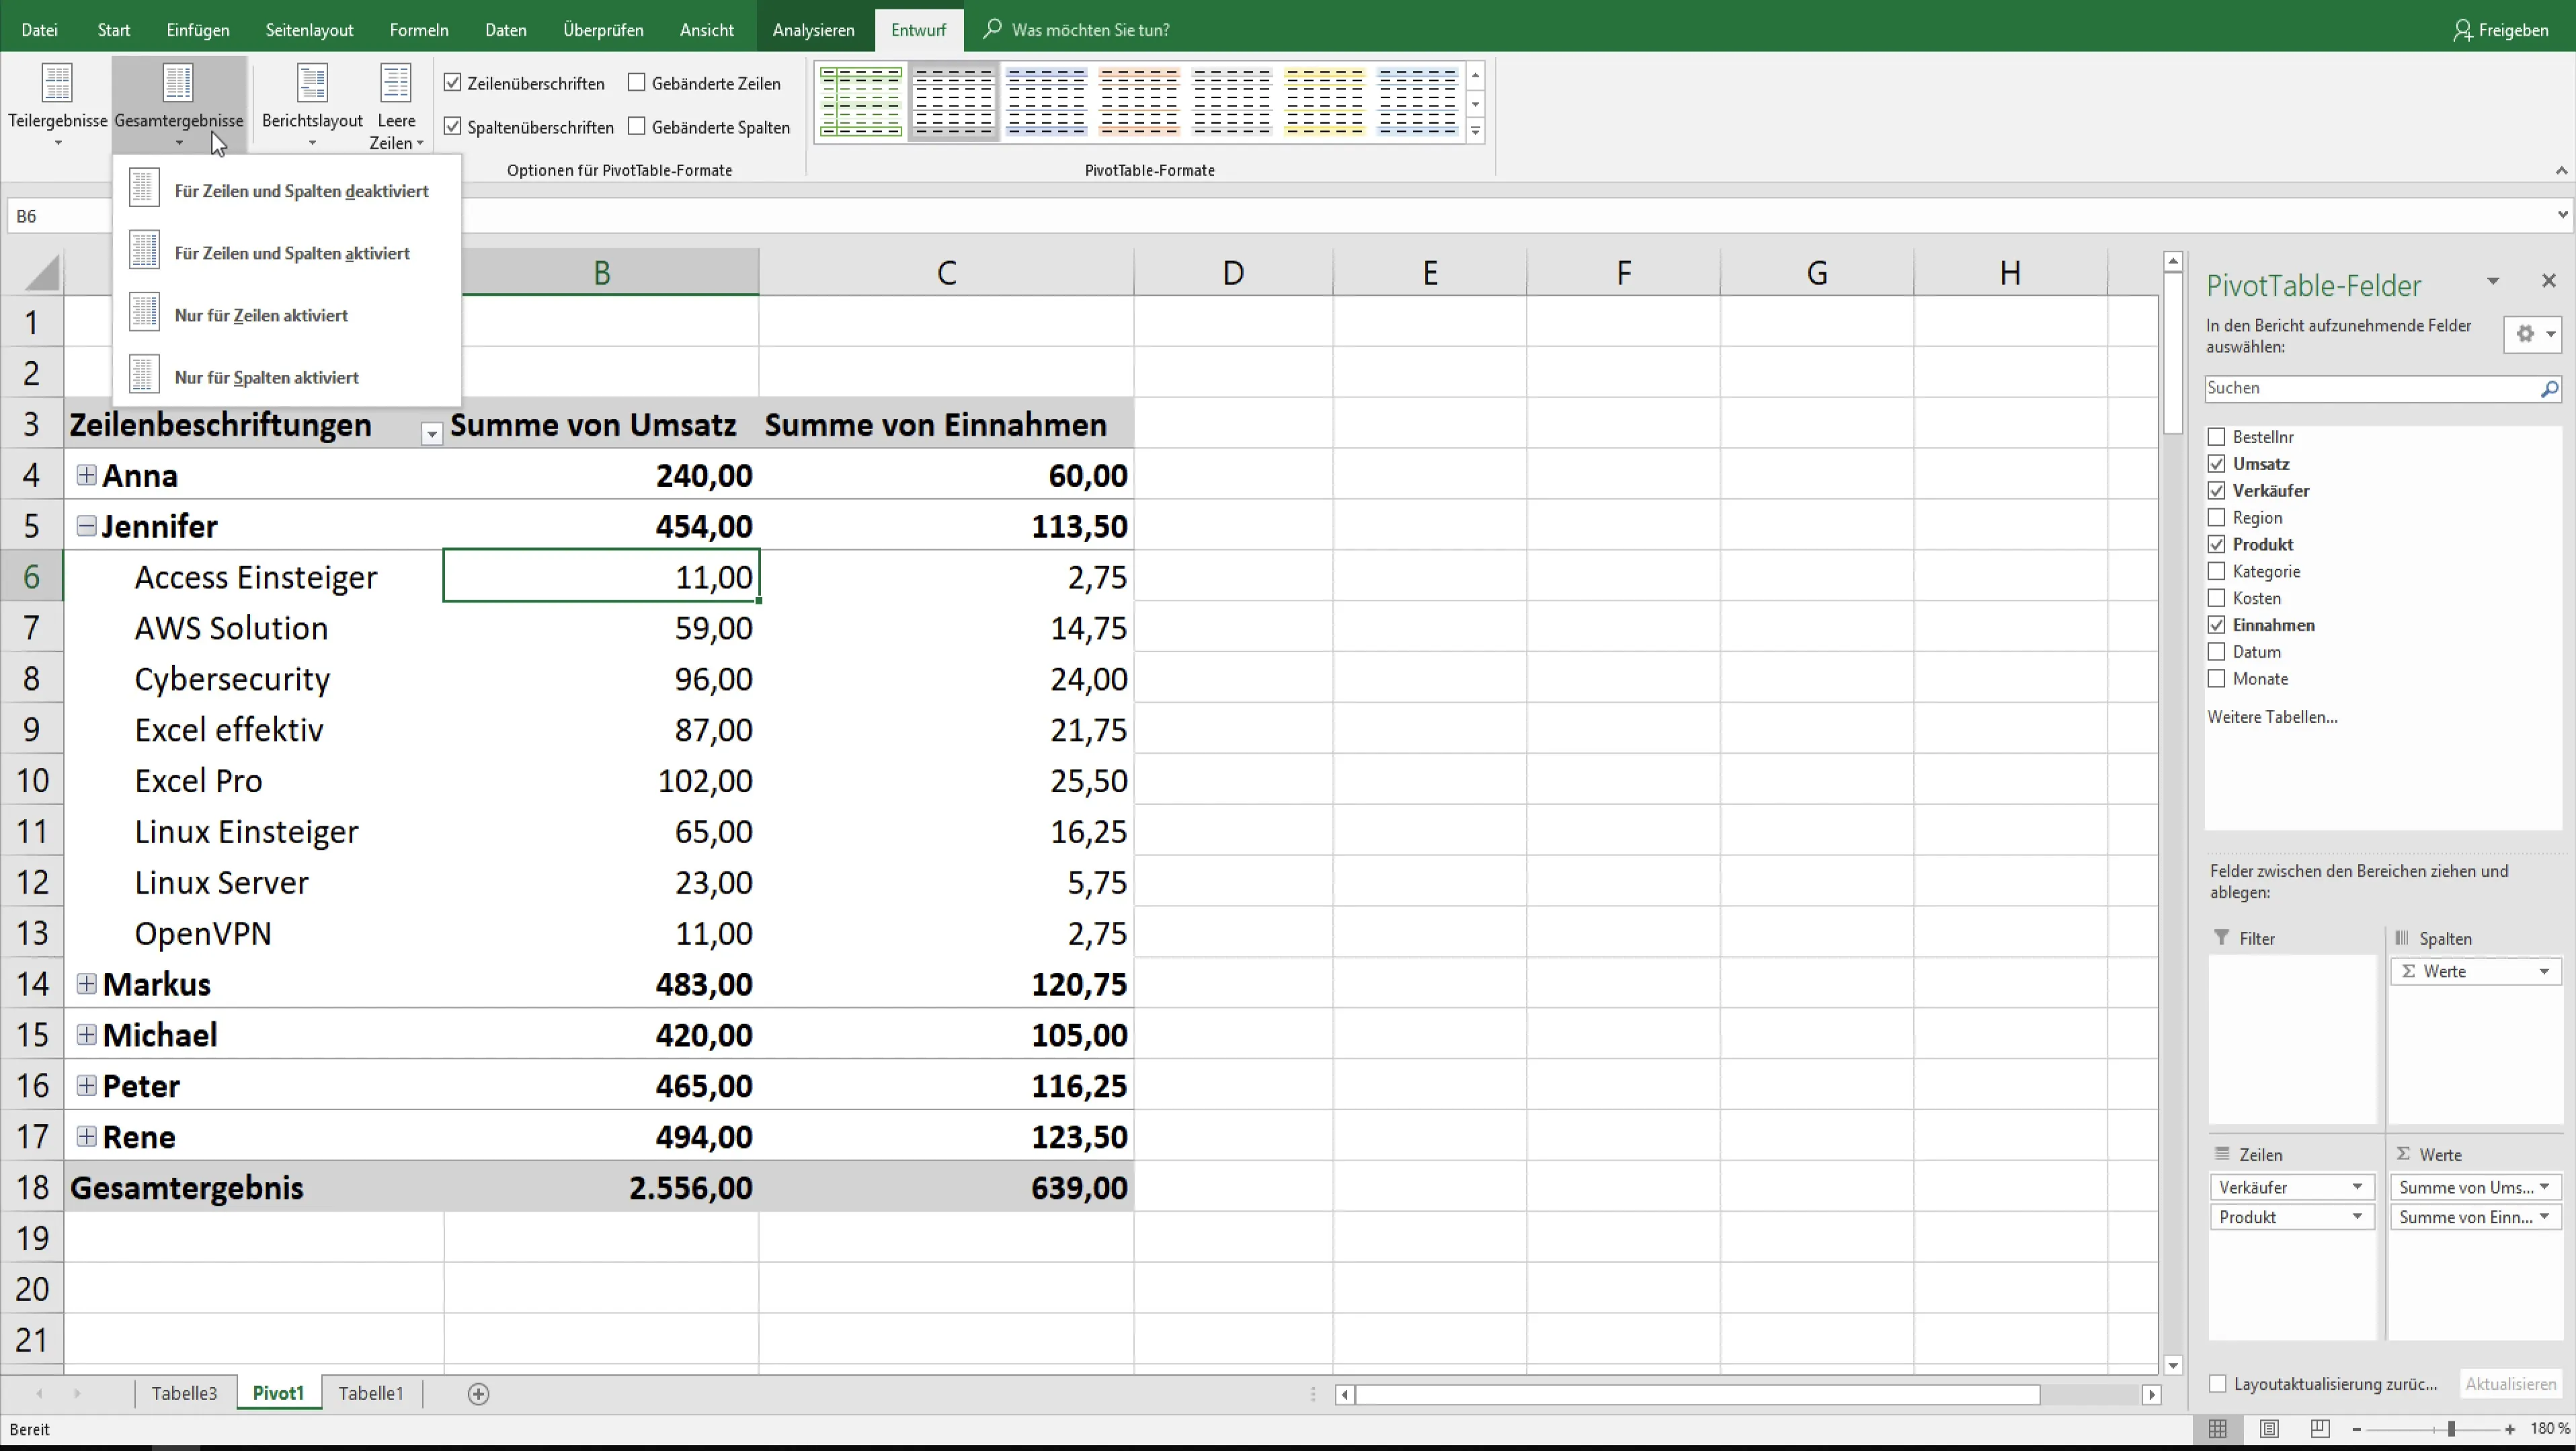
Enable the grand total for columns or rows. You can also find this option in the "Analyse" tab. This provides an overview of the total revenues or other common values.
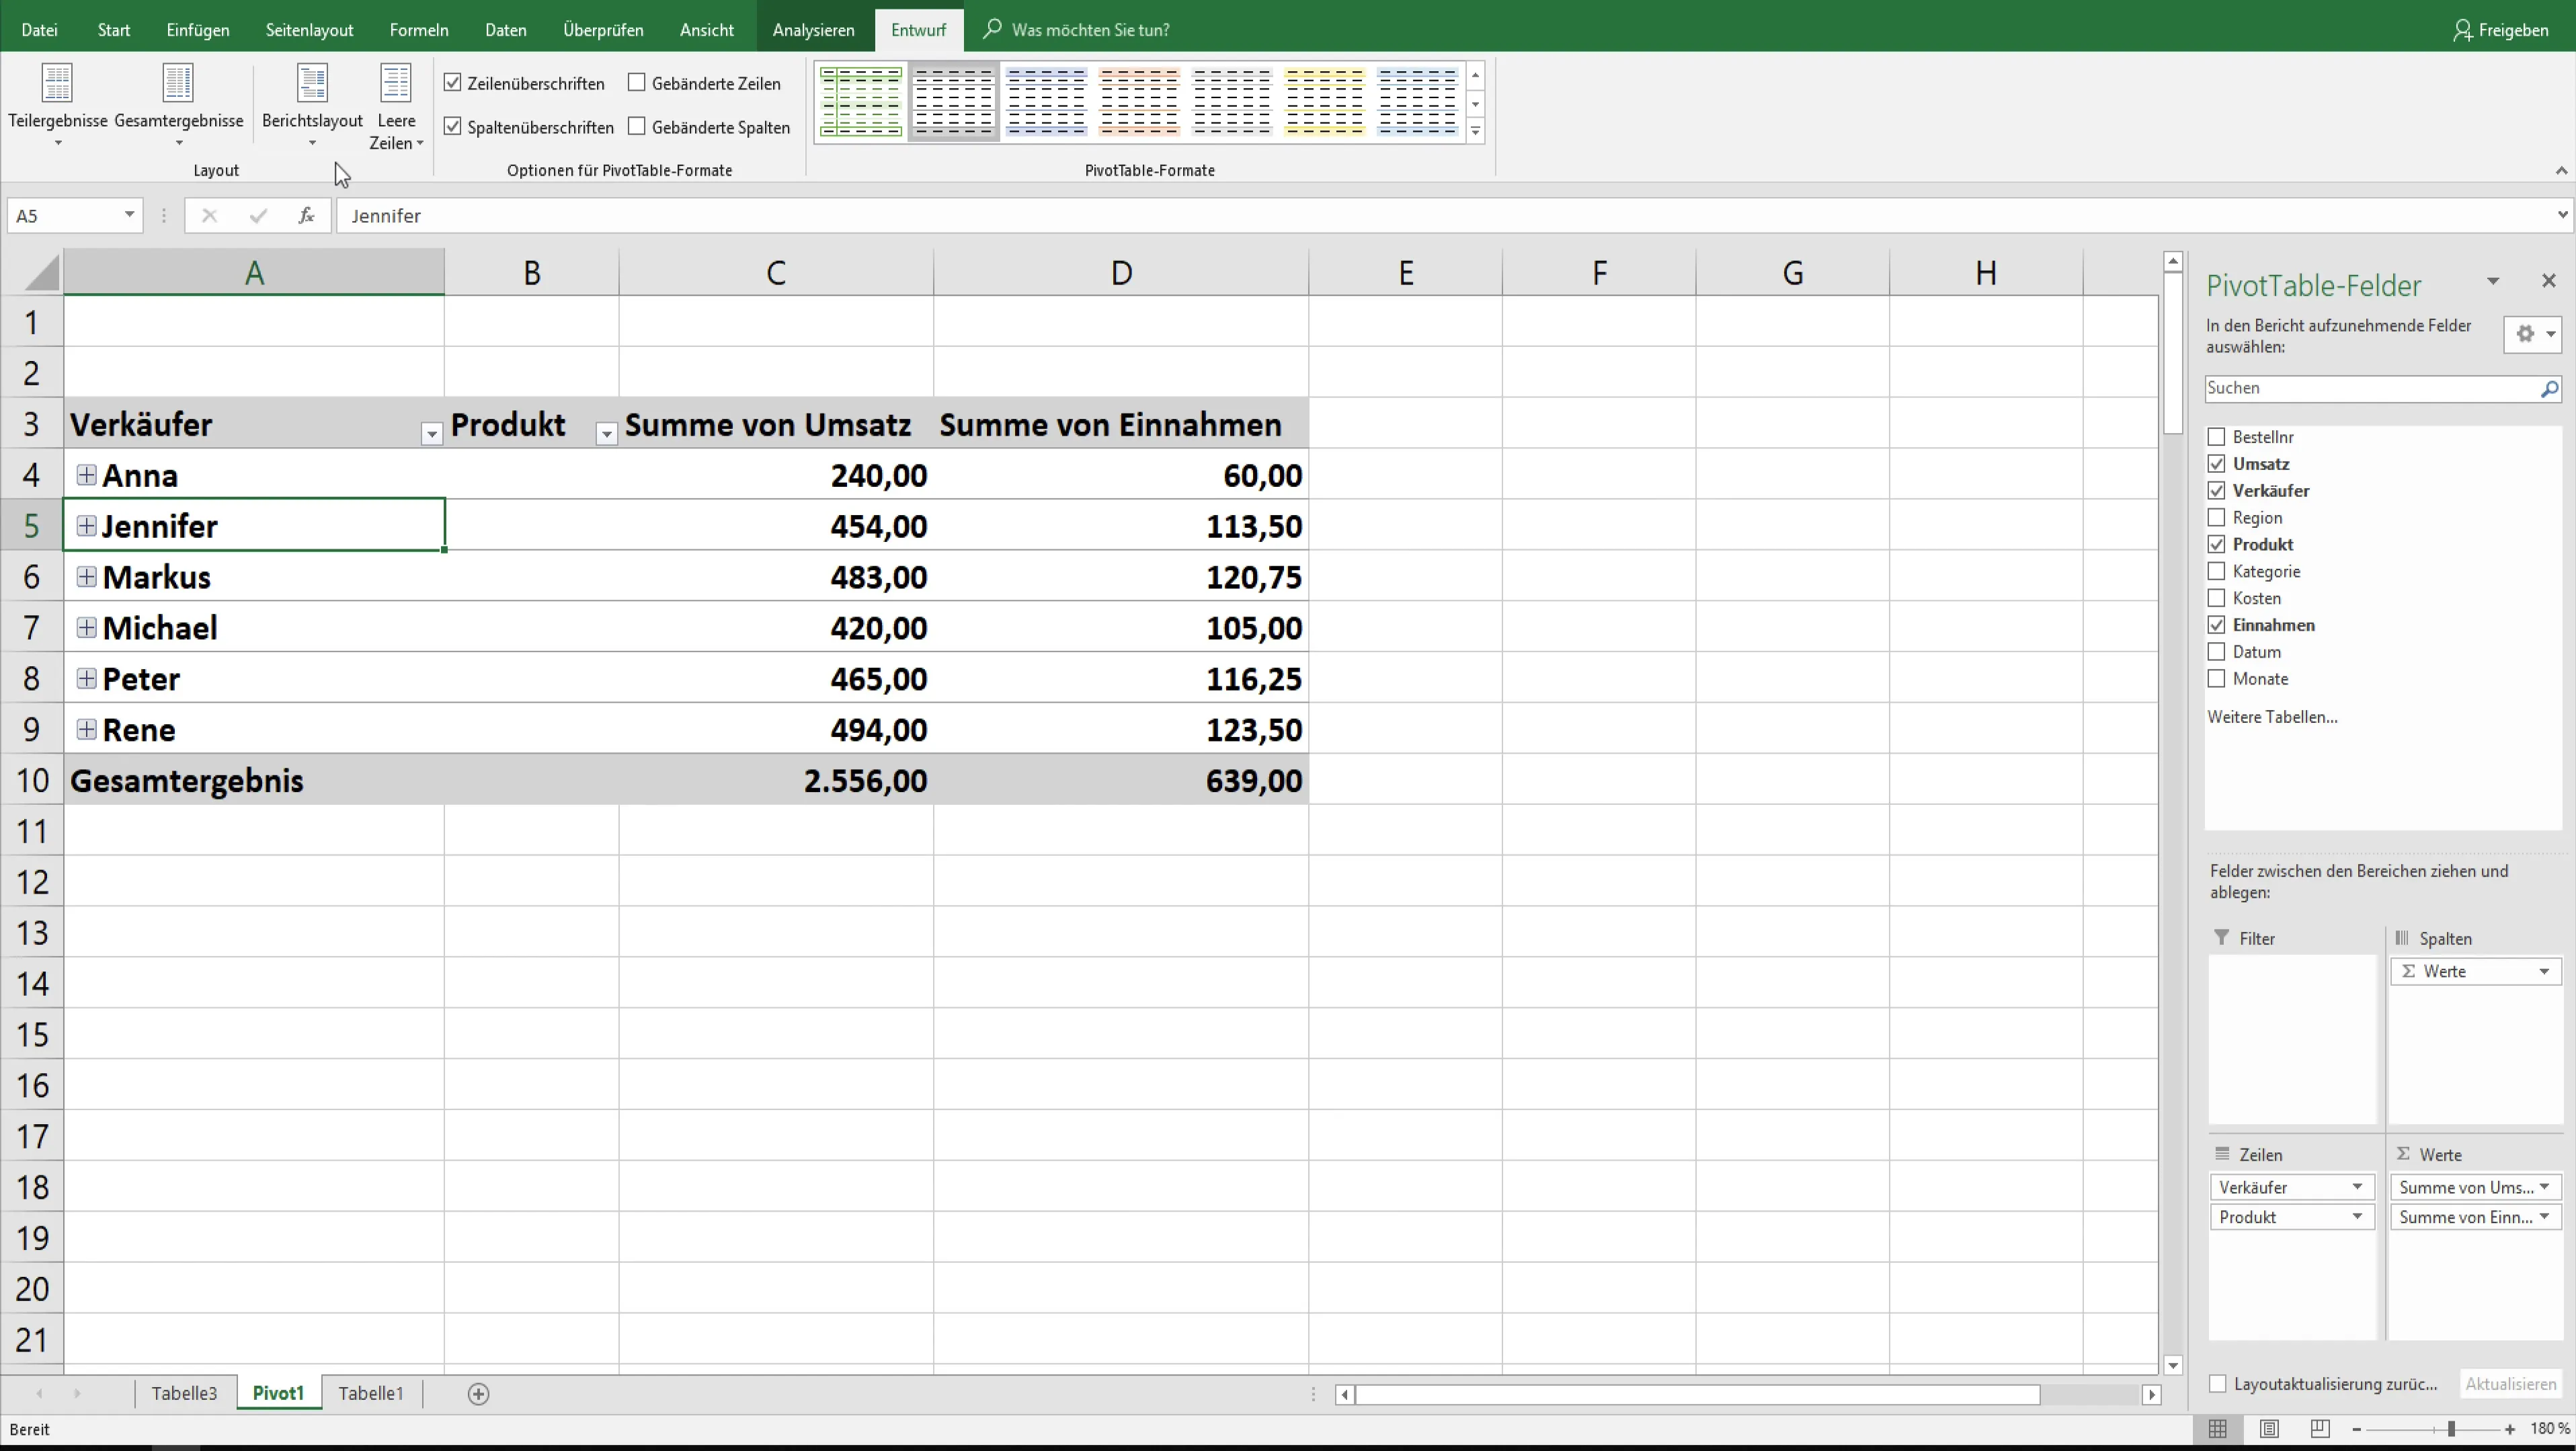
Step 5: Changing Report Layout
The report layout can be customized to specific needs. Choose between different layout options, such as "Compact Form" or "Tabular Format," to present the data more visually.
Step 6: Adjusting Value Field Settings
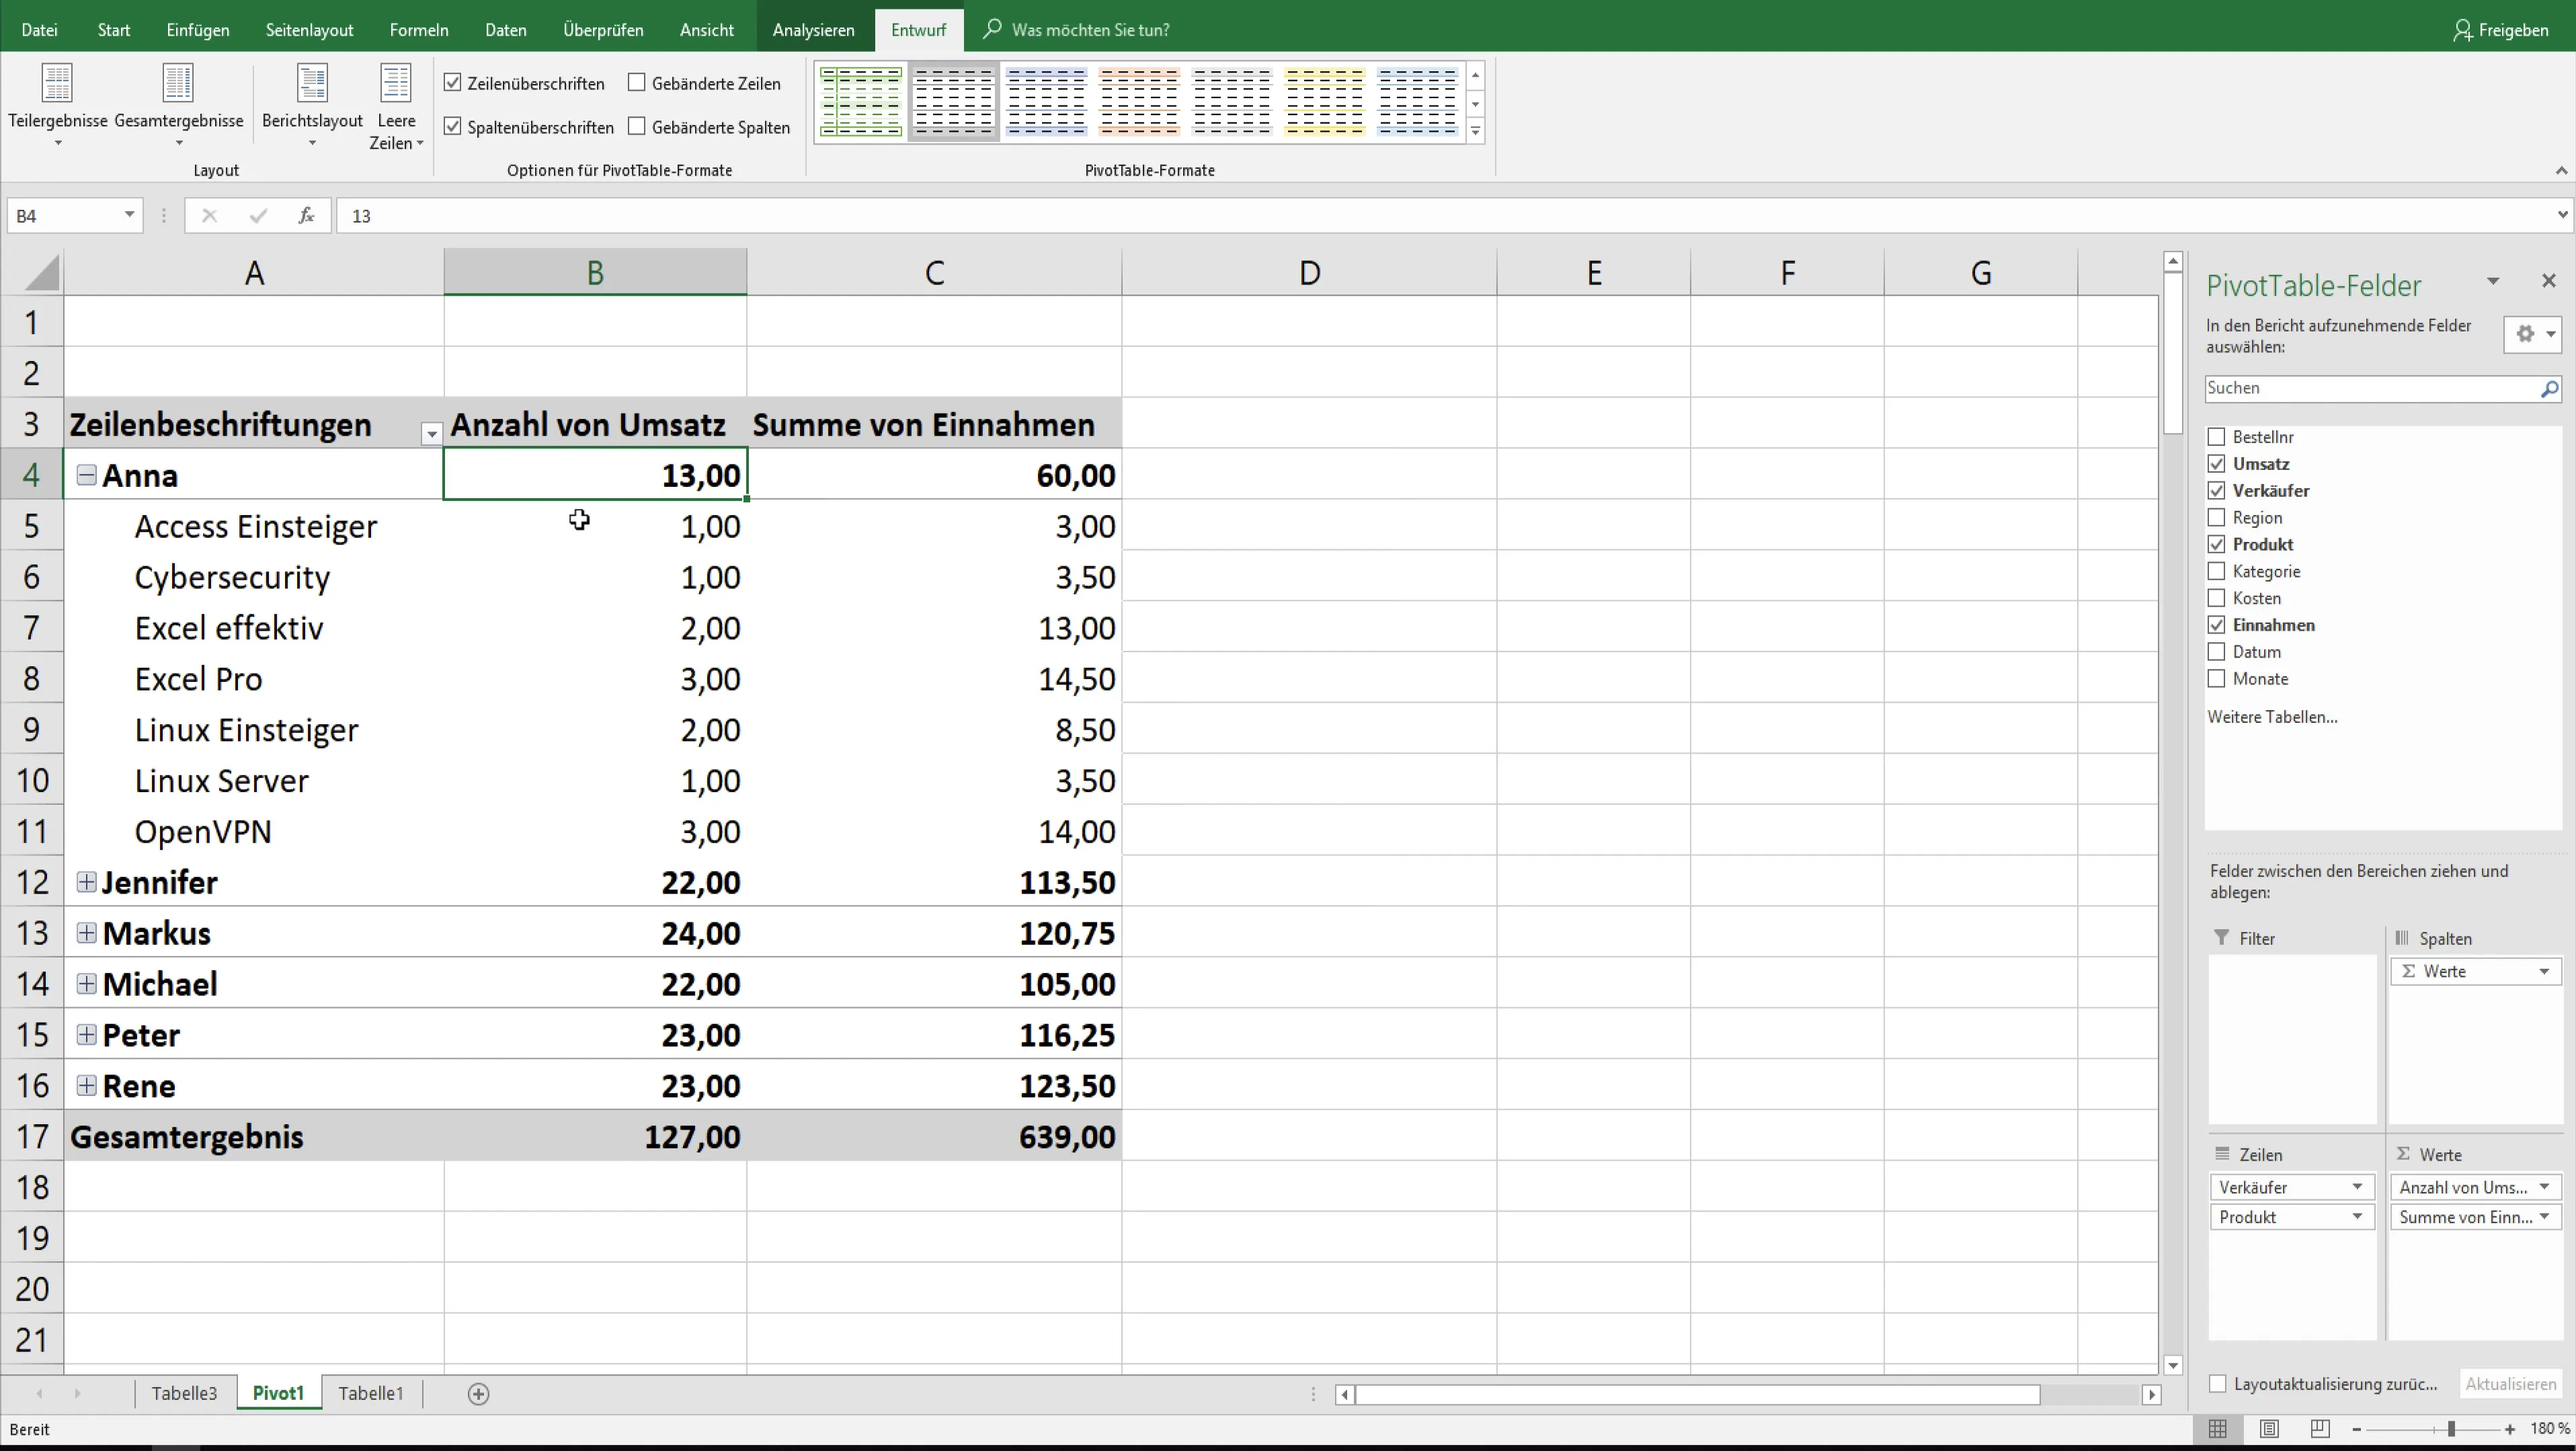
The settings of the value fields allow you to display not only sums but also other calculations such as the number of sales or the average. You can achieve this by selecting "Value Field Settings."
Step 7: Performing Calculations
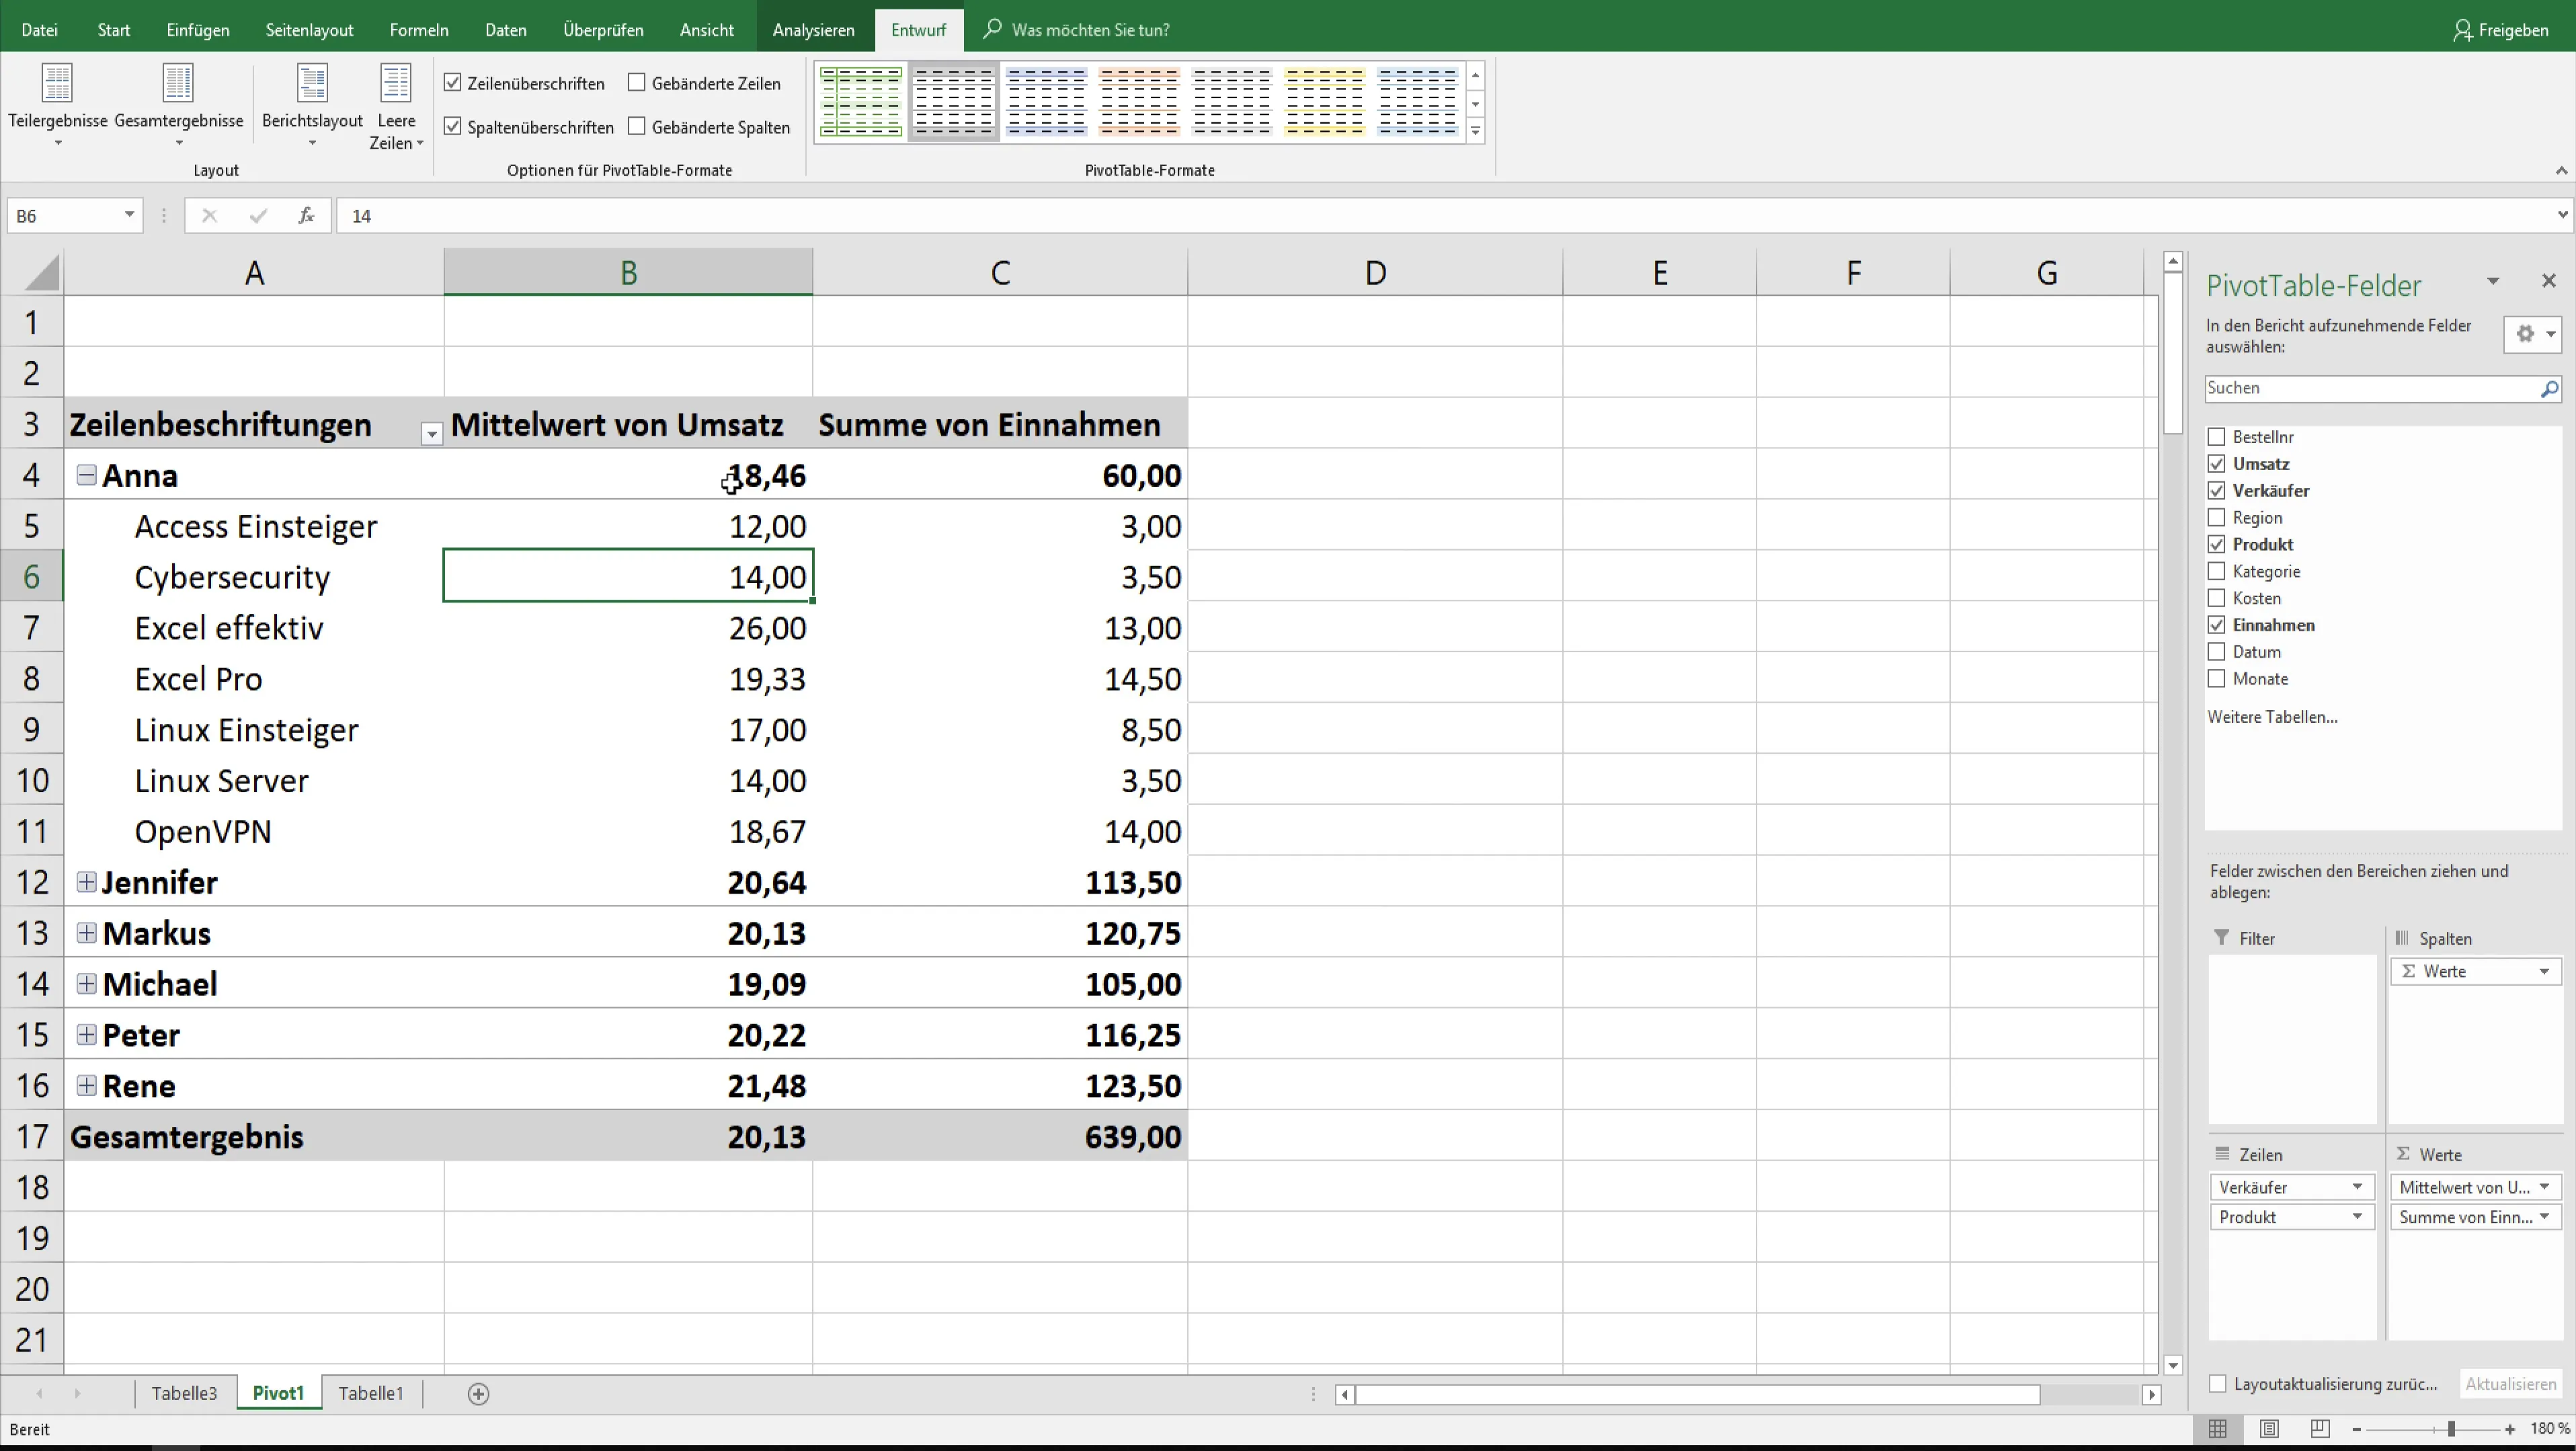
If you want to add specific calculations, such as averages, to your pivot table, go back to the value field settings and choose the desired function. This is particularly useful for gaining detailed insights into sales figures.
Step 8: Updating Data
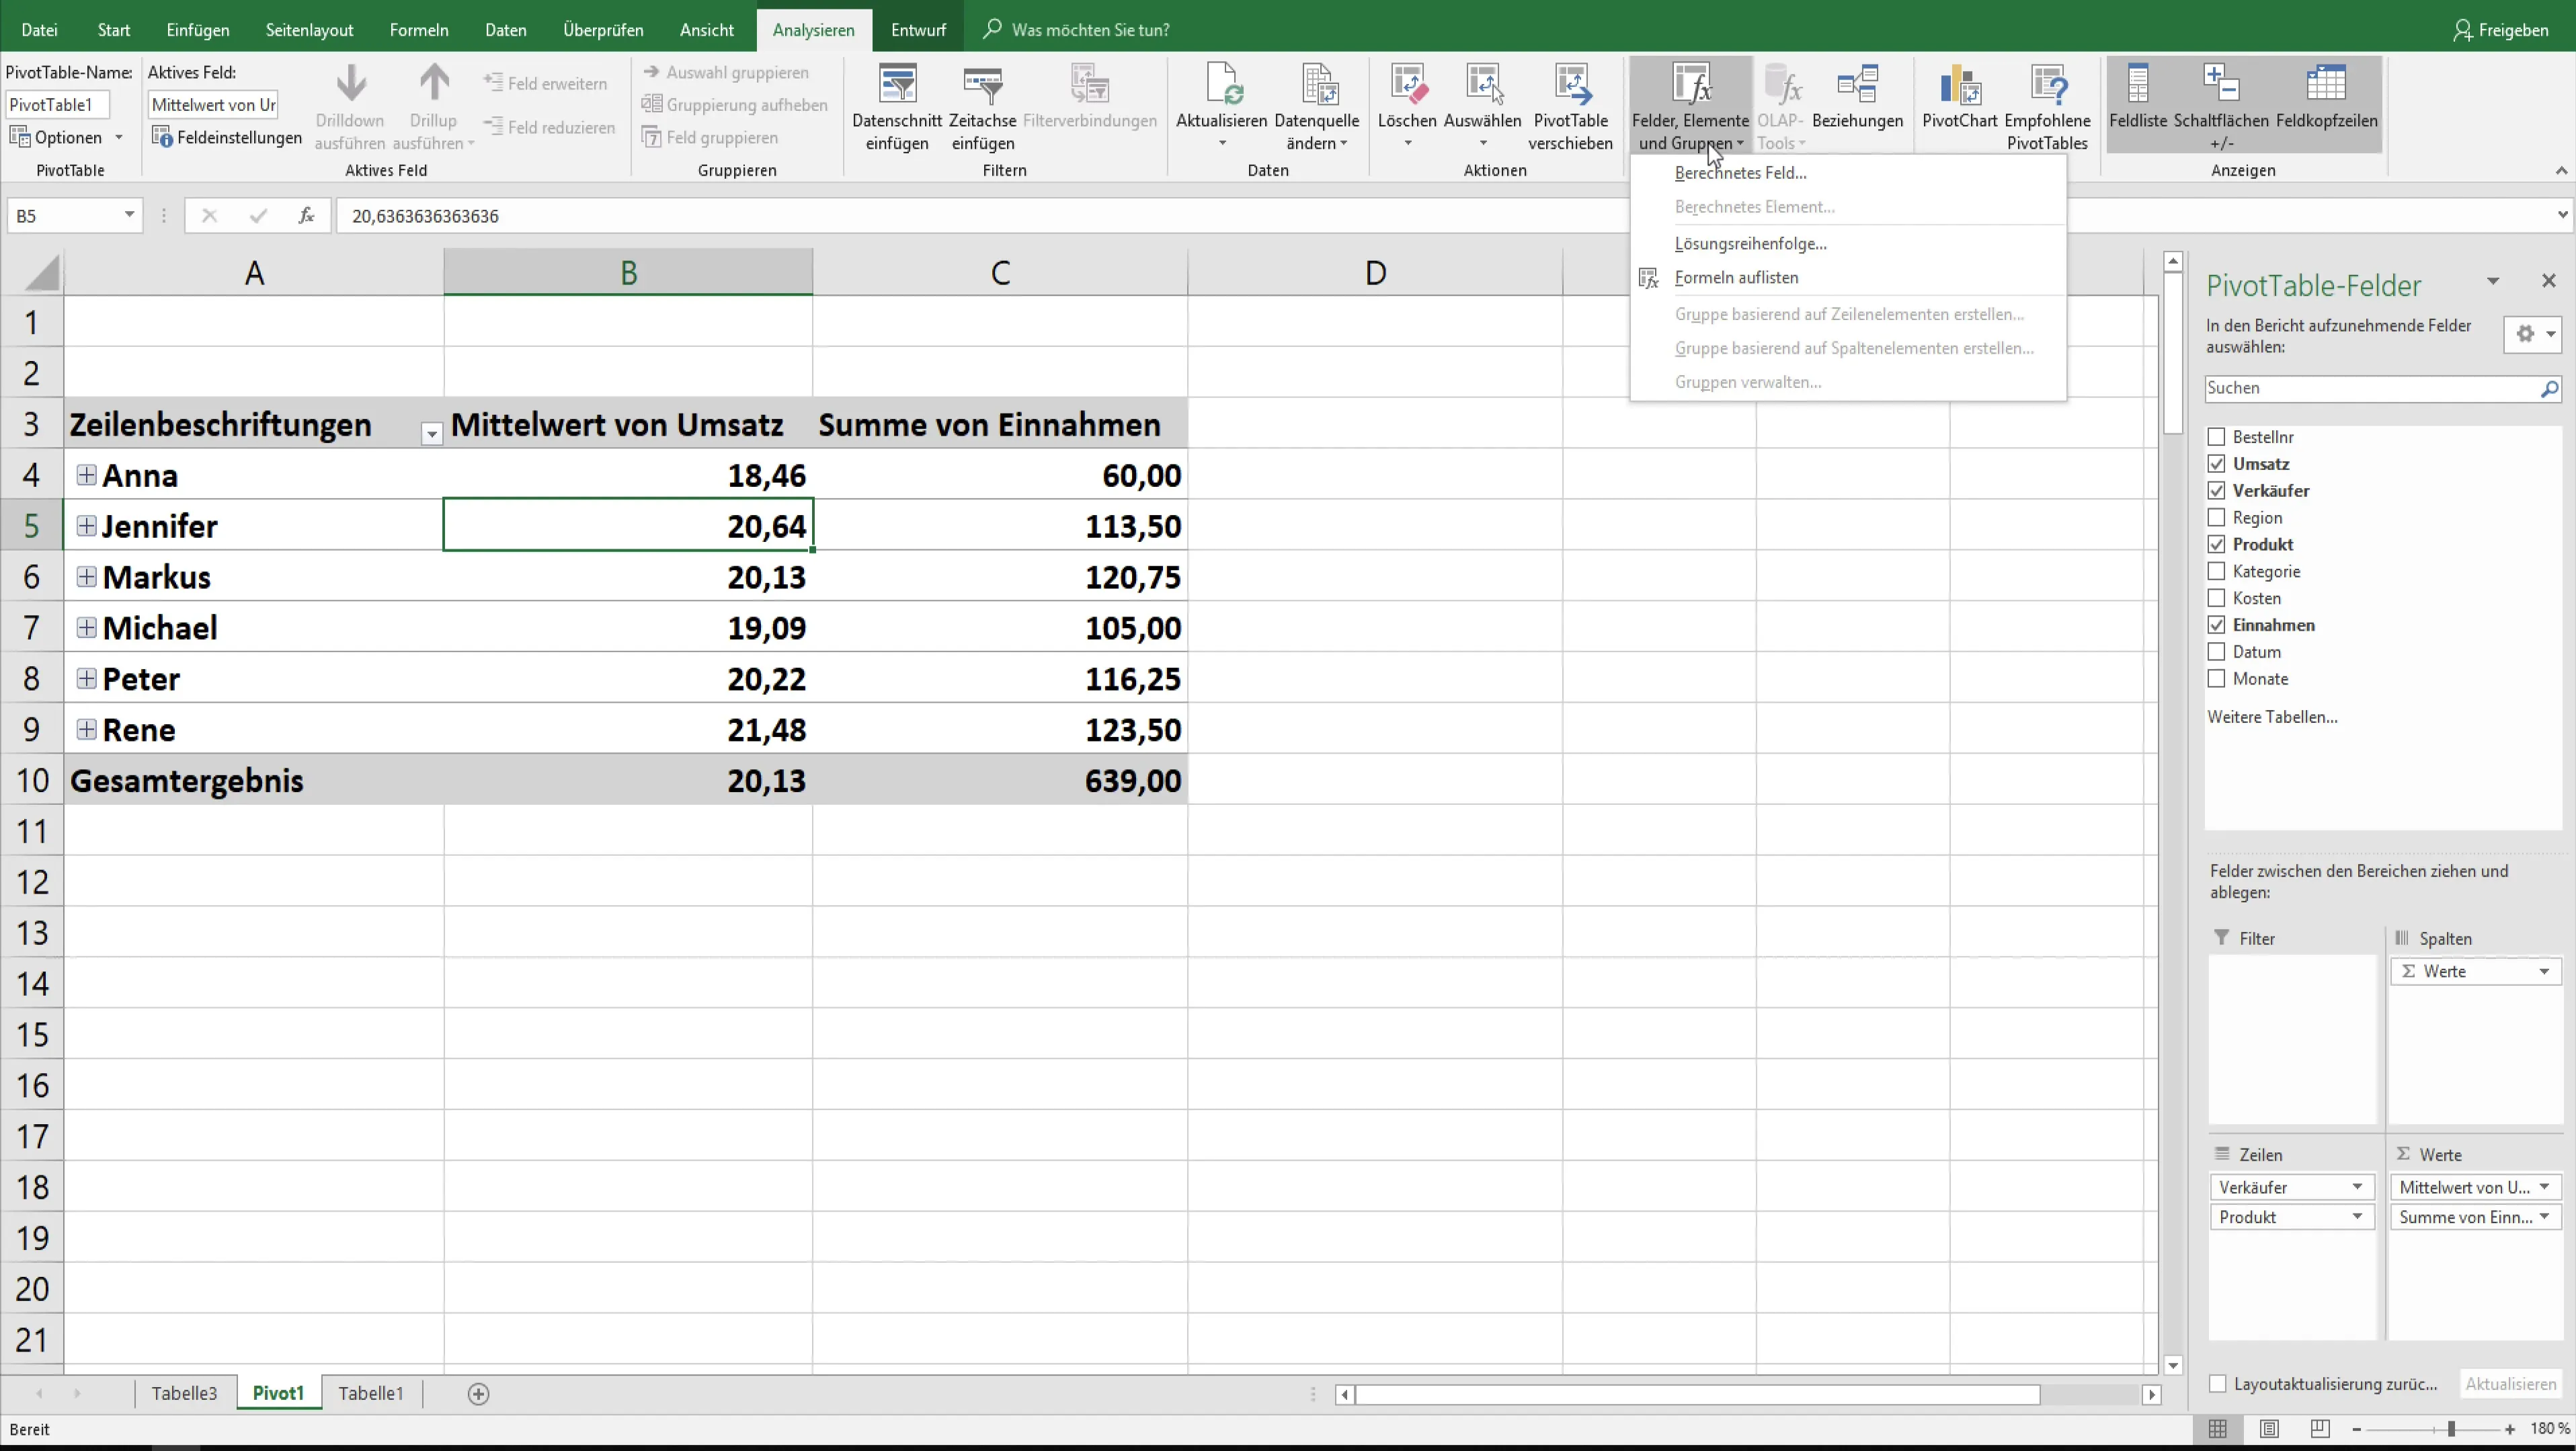
Don't forget to regularly update your pivot data. Under the "Analyse" menu, you have the option to refresh the data. This function ensures that your presentation always contains the latest information.
Summary
Throughout this tutorial, you have learned how to optimize the layout of your pivot tables. An attractive data presentation not only enhances understandability but also promotes analysis and decision-making.
Frequently Asked Questions
How can I customize my report layout?Change the settings in the "Design" tab and choose the desired layout option.
Can I edit the pivot table?Yes, you can make various adjustments to better suit your requirements.
How often should I update the data in my pivot table?It is advisable to update the data before each presentation to ensure all information is current.


