Excel offers a wealth of possibilities for efficient data analysis, especially through the use of Pivot Tables. This tutorial will show you how to customize various options in Pivot Tables to suit your needs and optimize your data presentation.
Main Insights
- You can adjust the display of values and calculation methods.
- The formatting and layout of your Pivot Table are crucial for readability.
- Data refreshing and handling of null or erroneous values are fundamental aspects of data maintenance.
- Custom filters and sorting enable detailed analysis.
Step-by-Step Guide
Generating Pivot Table and Making Initial Settings
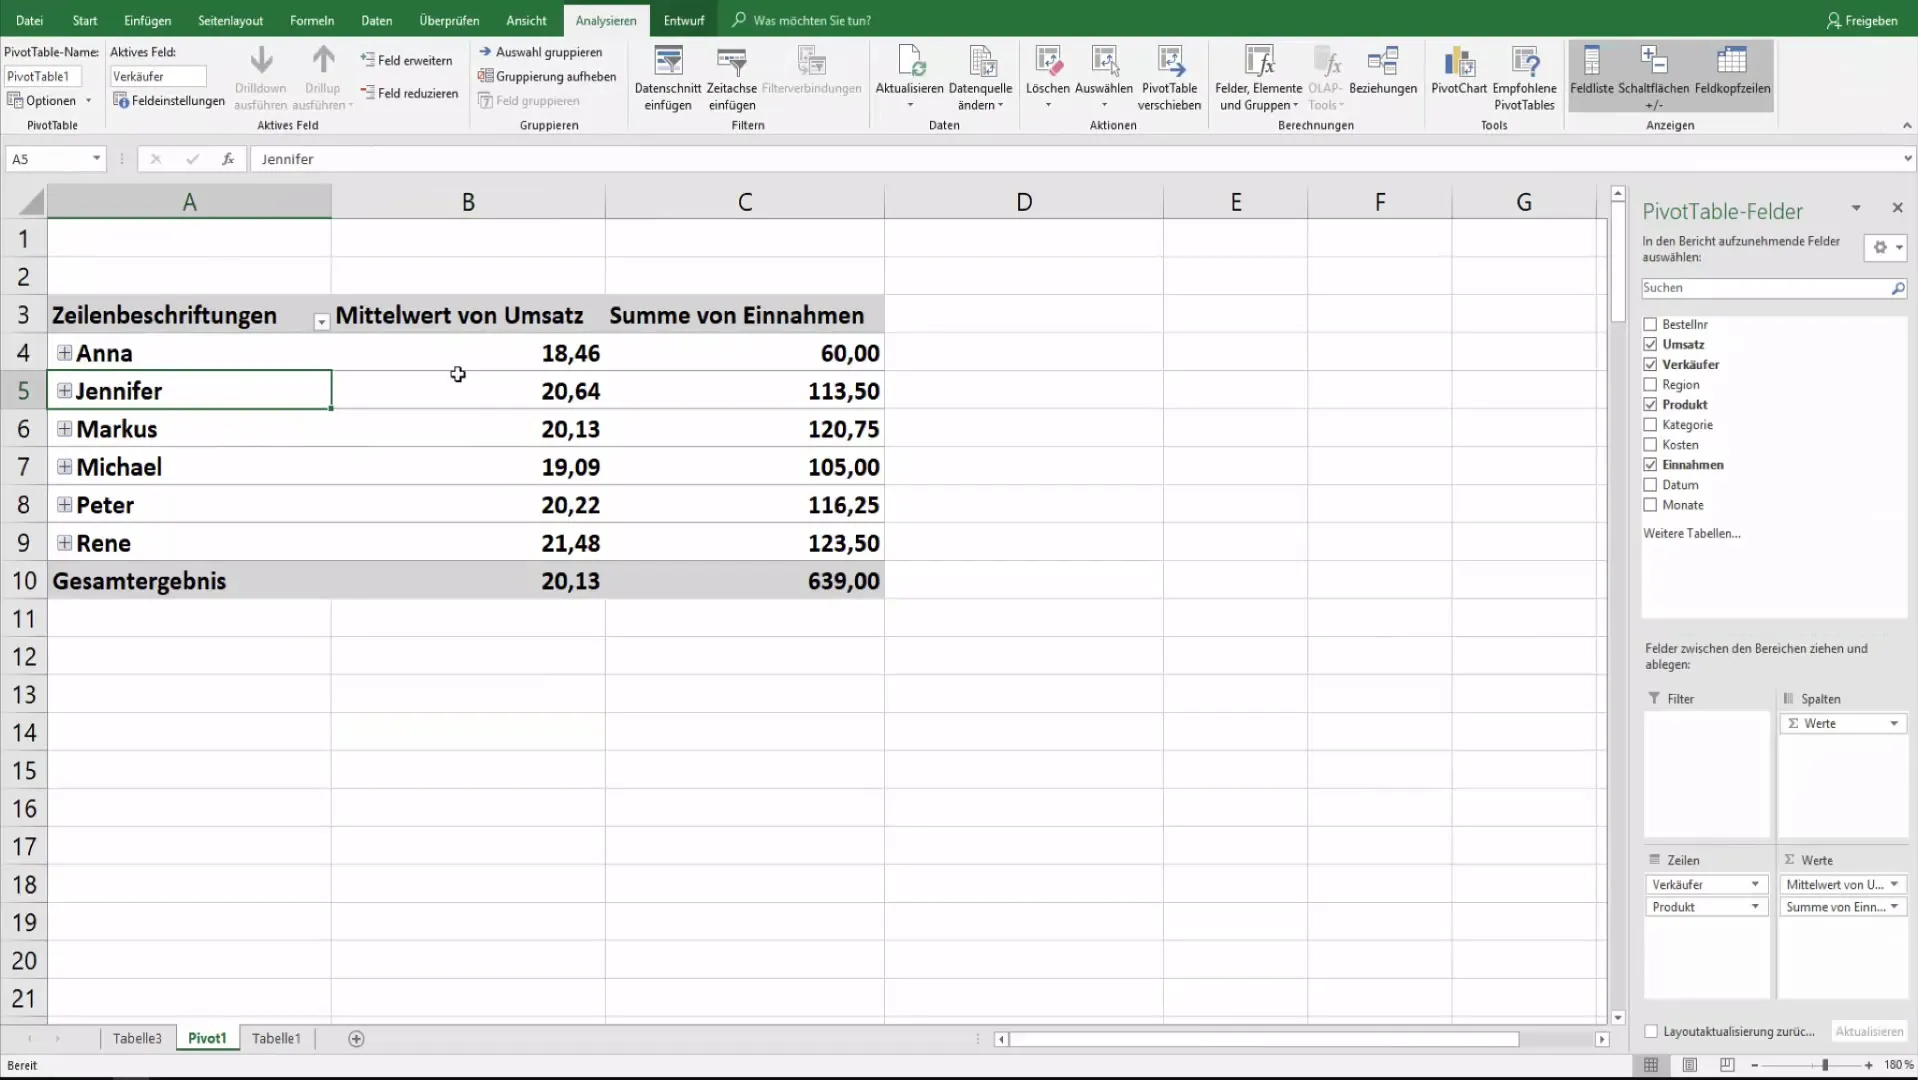
First, you need to ensure that your data is correctly arranged in a Pivot Table. Once you have created it, you will be prompted to define the layout for your Pivot Table. A typical method is to perform calculations such as the average of revenue data. You can easily achieve this by selecting the relevant field and adjusting the calculation method.
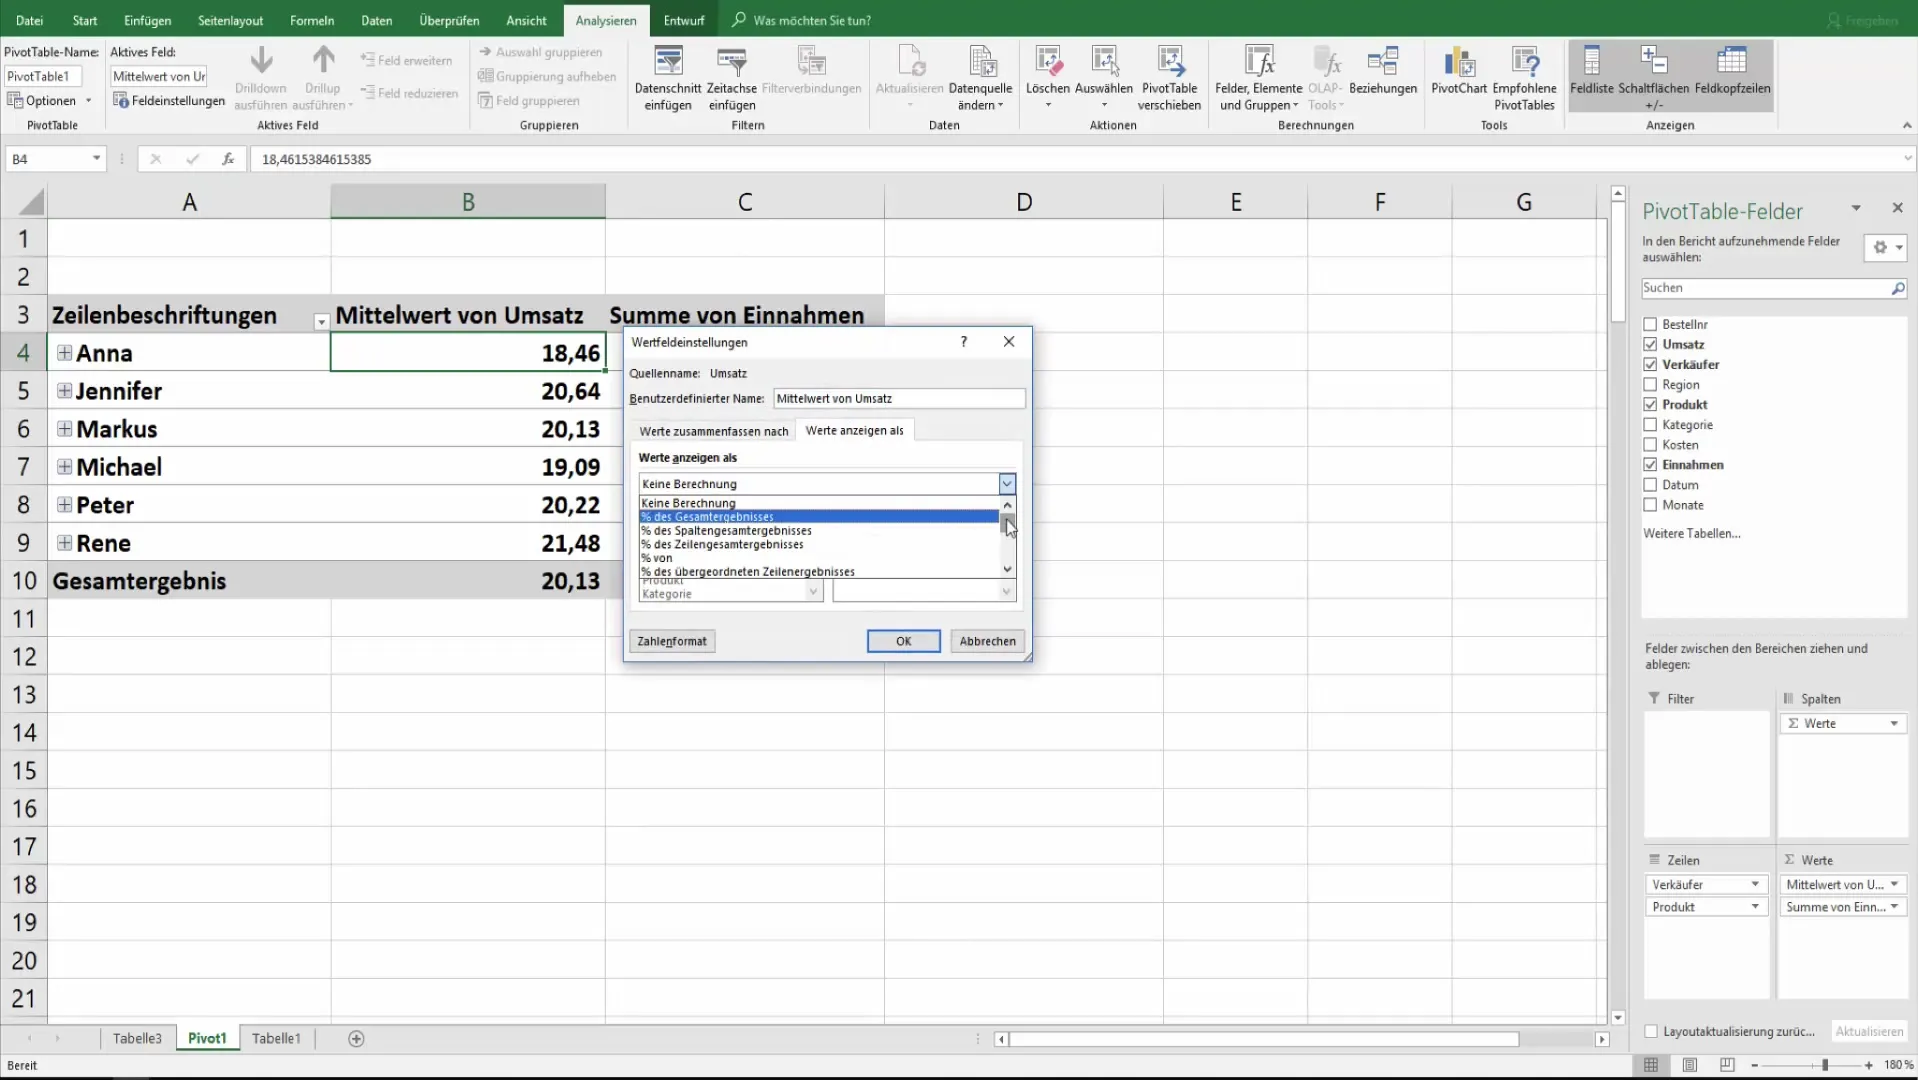
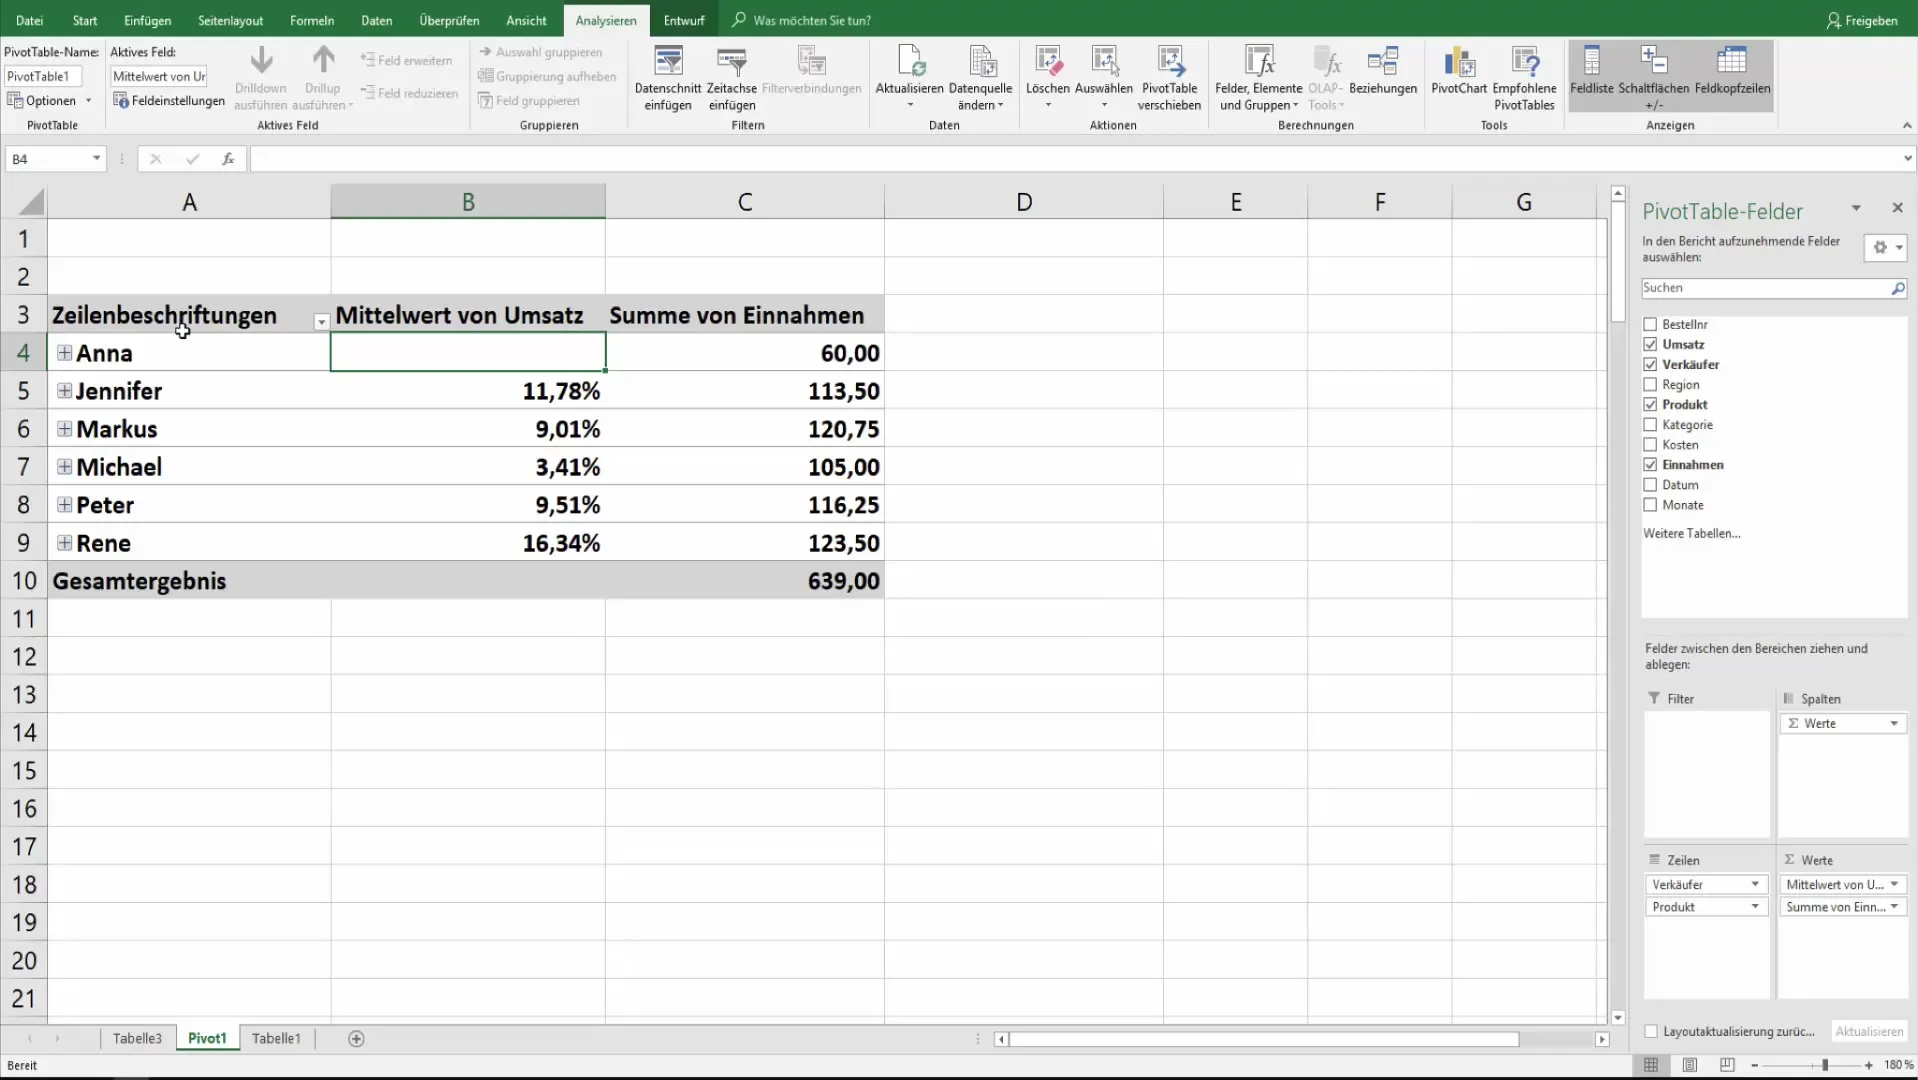
For example, if you want to calculate the average revenue, go to the field settings, choose the desired calculation method, and then click "OK". Now you will see the results as desired in the Pivot Table. To display the differences between different entries, you can also format the values to be shown as percentage changes.
Layout and Formatting
The formatting of your Pivot Table is crucial for presenting data clearly and effectively. In the Pivot Table options, you can set whether cells with labels should be merged and centered. This helps improve clarity and readability of the data.
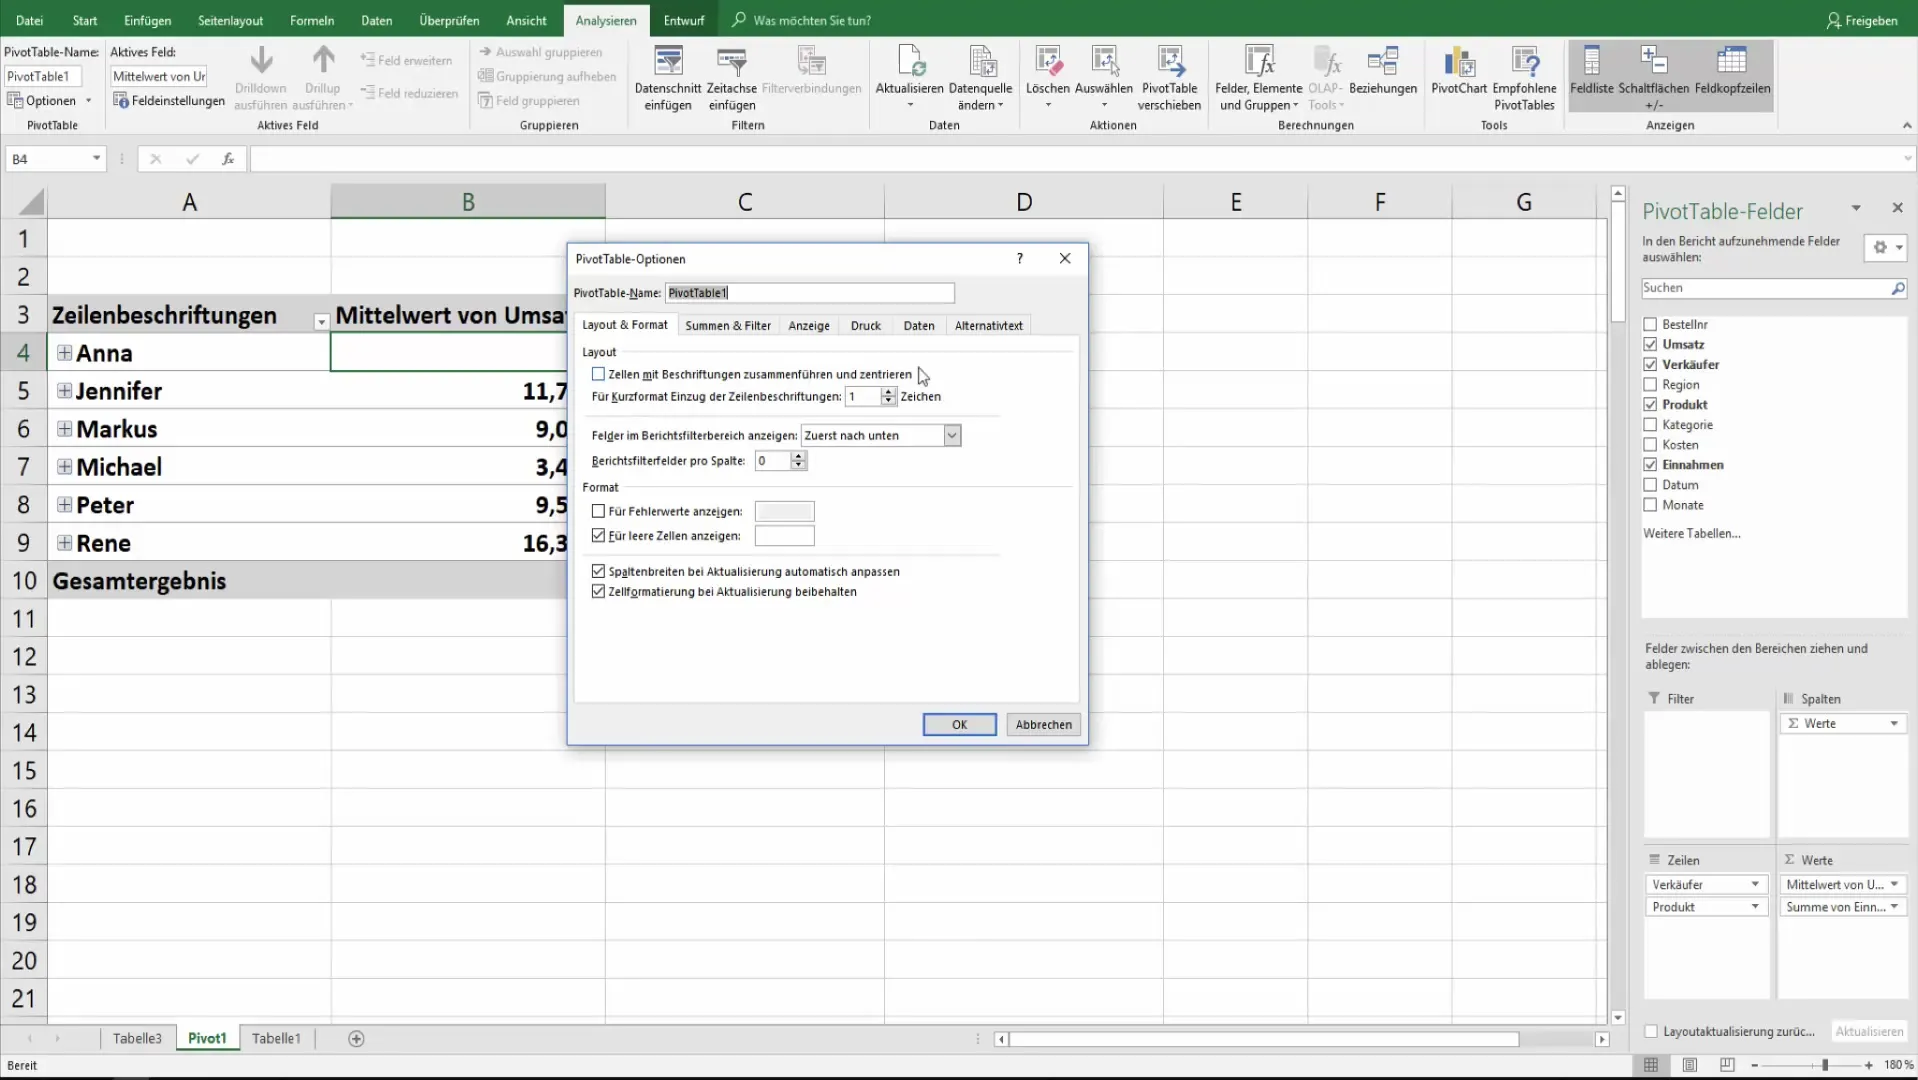
It is particularly important to determine how blank cells should be handled. You have the option to decide whether a placeholder should be displayed in these cells (for example, the value "0"), or whether these cells should remain empty.
Total Results and Filters
Another aspect of Pivot Table settings is the ability to display total results for rows and columns. Here, you can decide whether these summary data complement your results or are unnecessary.
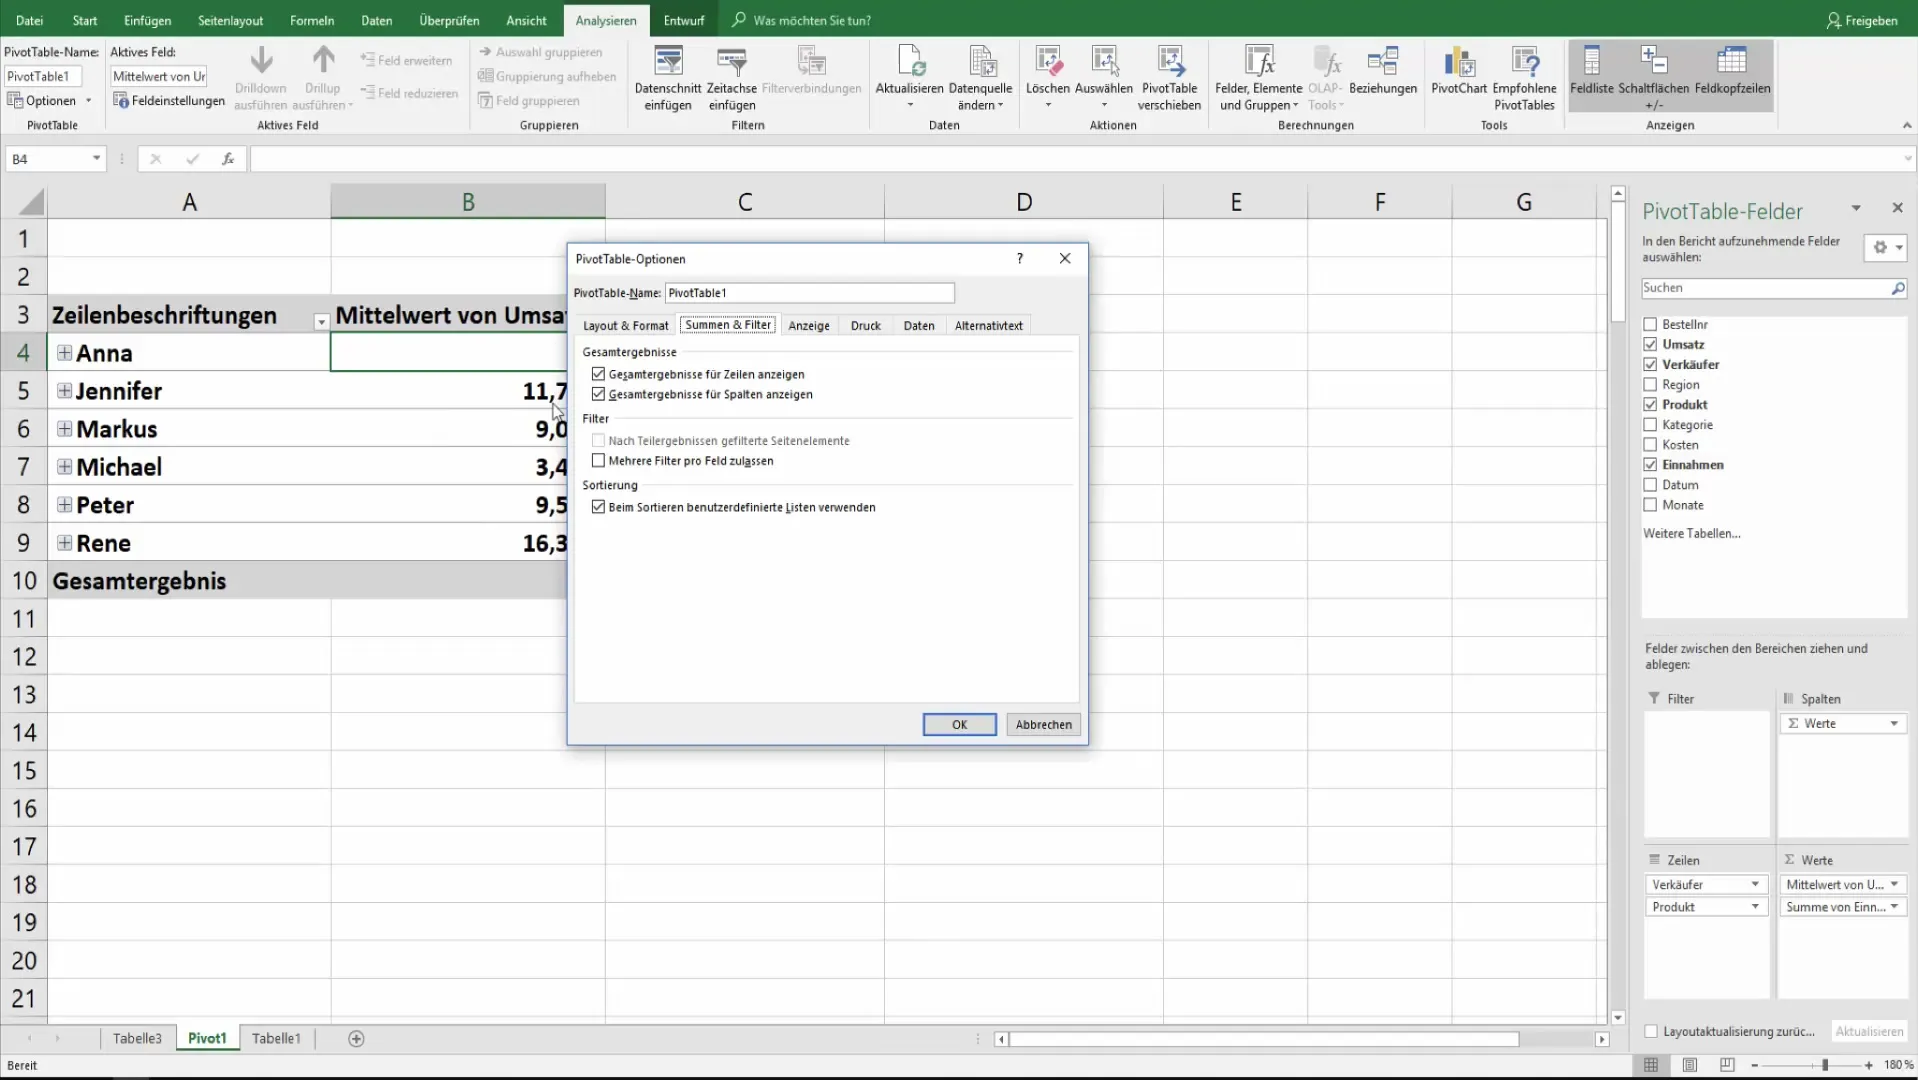
You can also specify whether multiple filters per field are allowed. This increases the flexibility with which you can analyze your data and allows for varying views within the same table.
Display Adjustments and Sorting
The display of the Pivot Table can be further customized to meet the requirements of your analysis. You can control whether the value rows are visible and whether the field labels should be displayed.
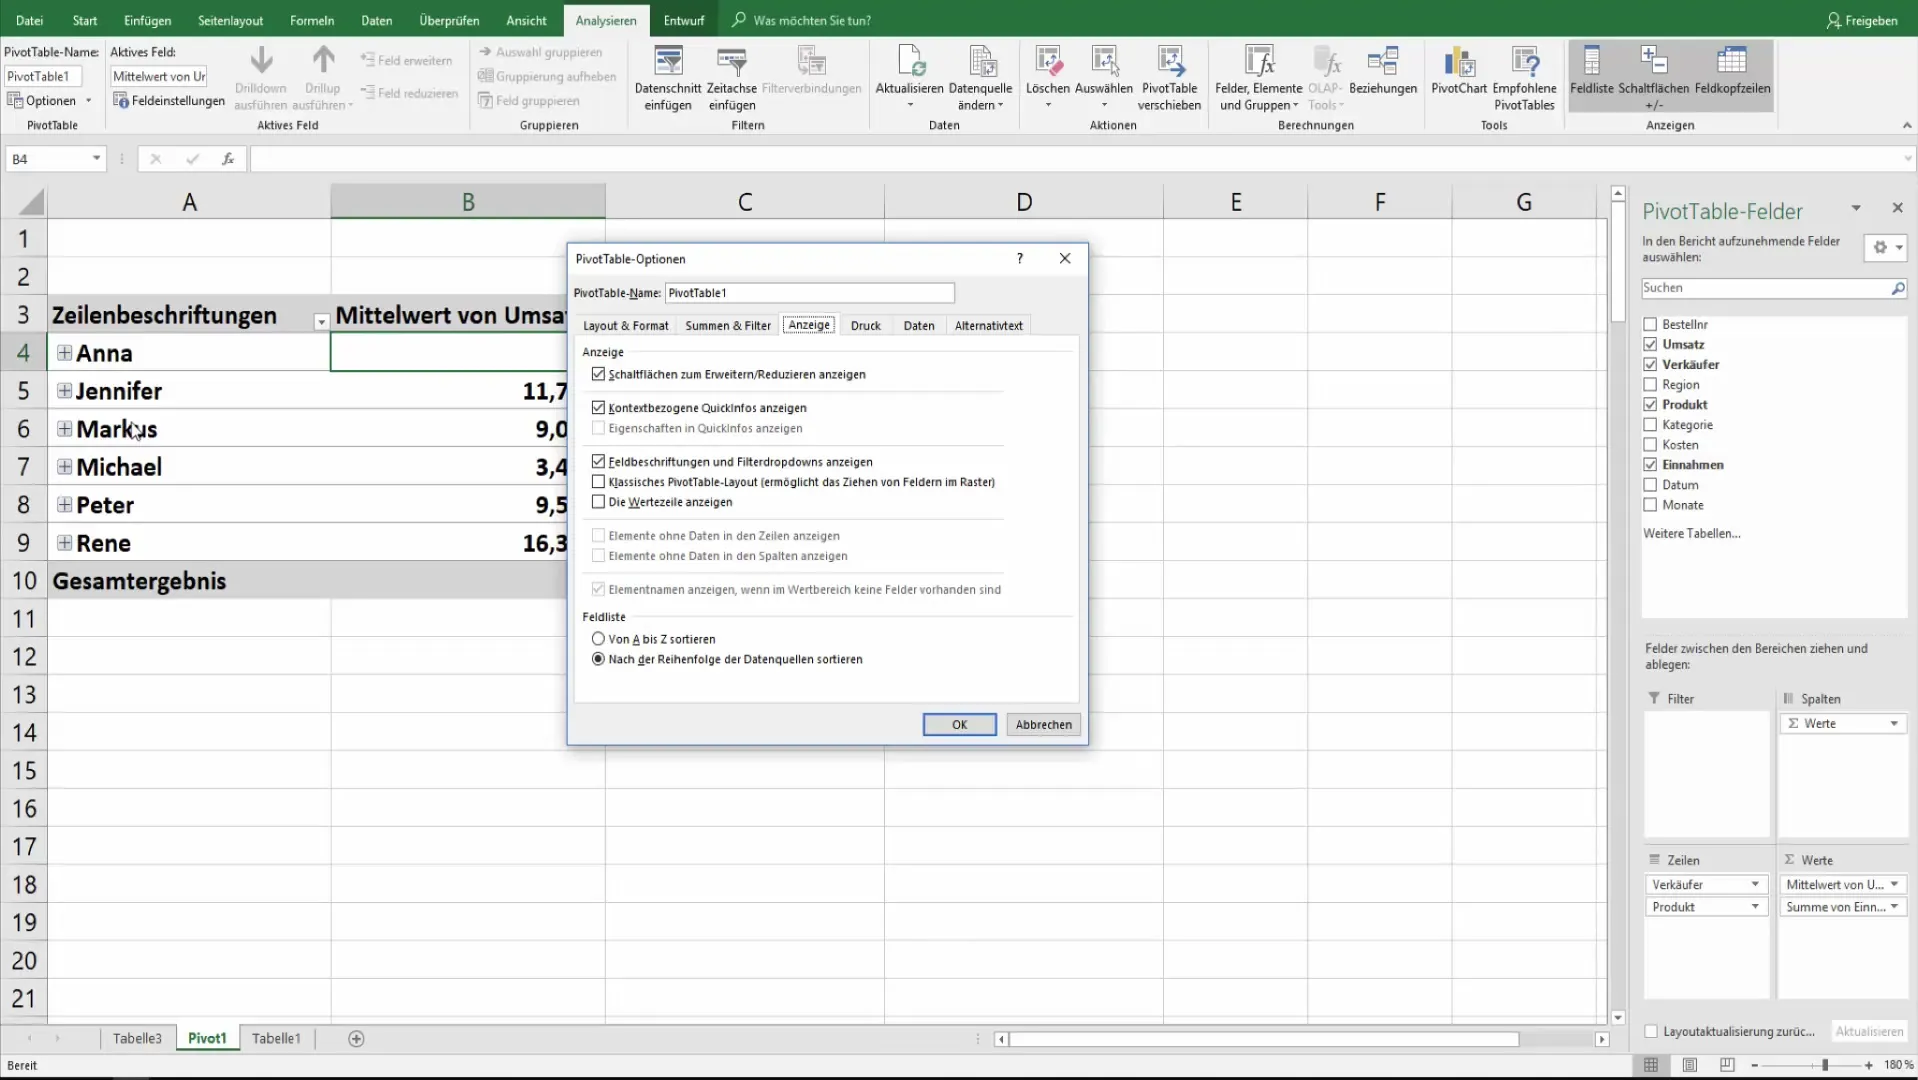
Another useful feature is adjusting the sorting options. You can define whether the data should be arranged according to a custom sorting scheme or alphabetically. This option not only helps with clarity but also ensures that your presentation looks professional.
Print Settings and Data Refresh
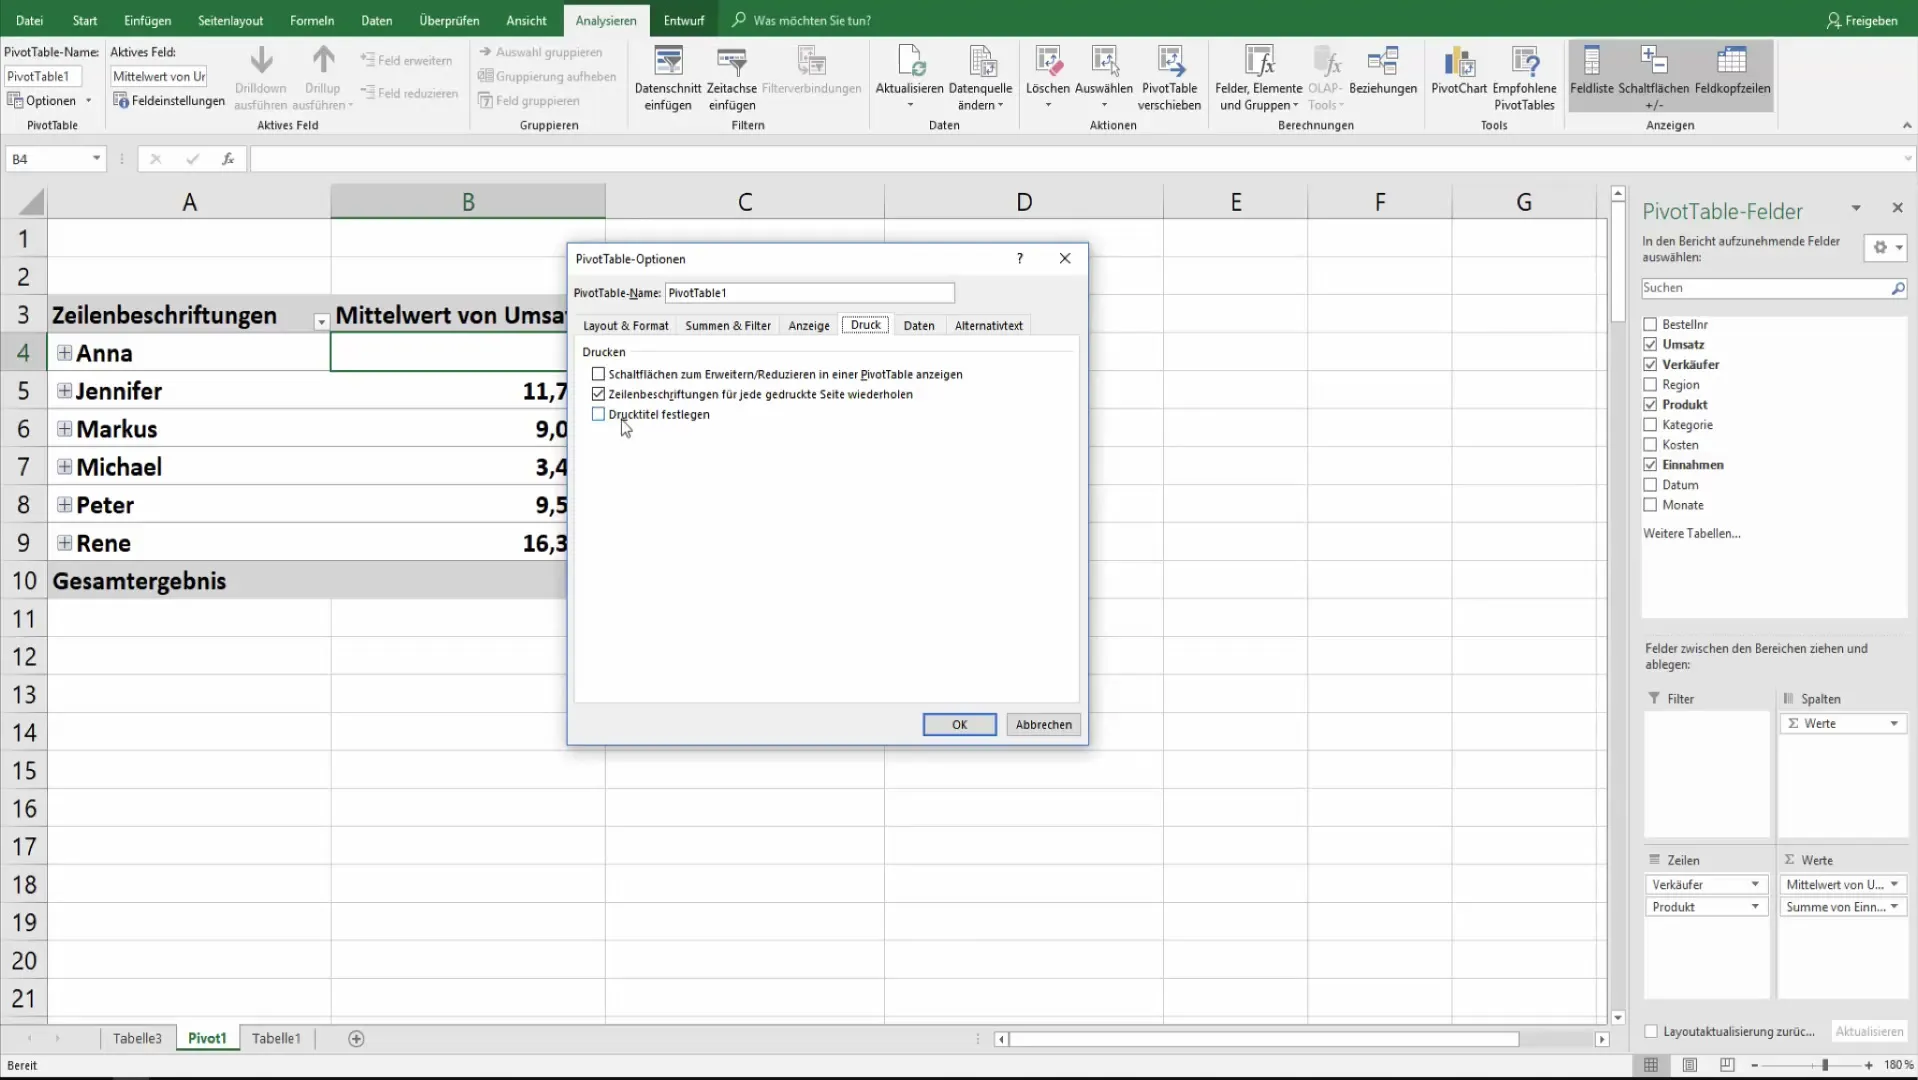
If you plan to print your Pivot Table, you can adjust the print options accordingly. You can specify whether buttons or titles should be printed along. This can have a significant impact on the offline presentation of your data.
Equally important is the option to refresh your data. You can control whether the source data should be saved along with the file and whether data should be automatically updated when the file is opened.
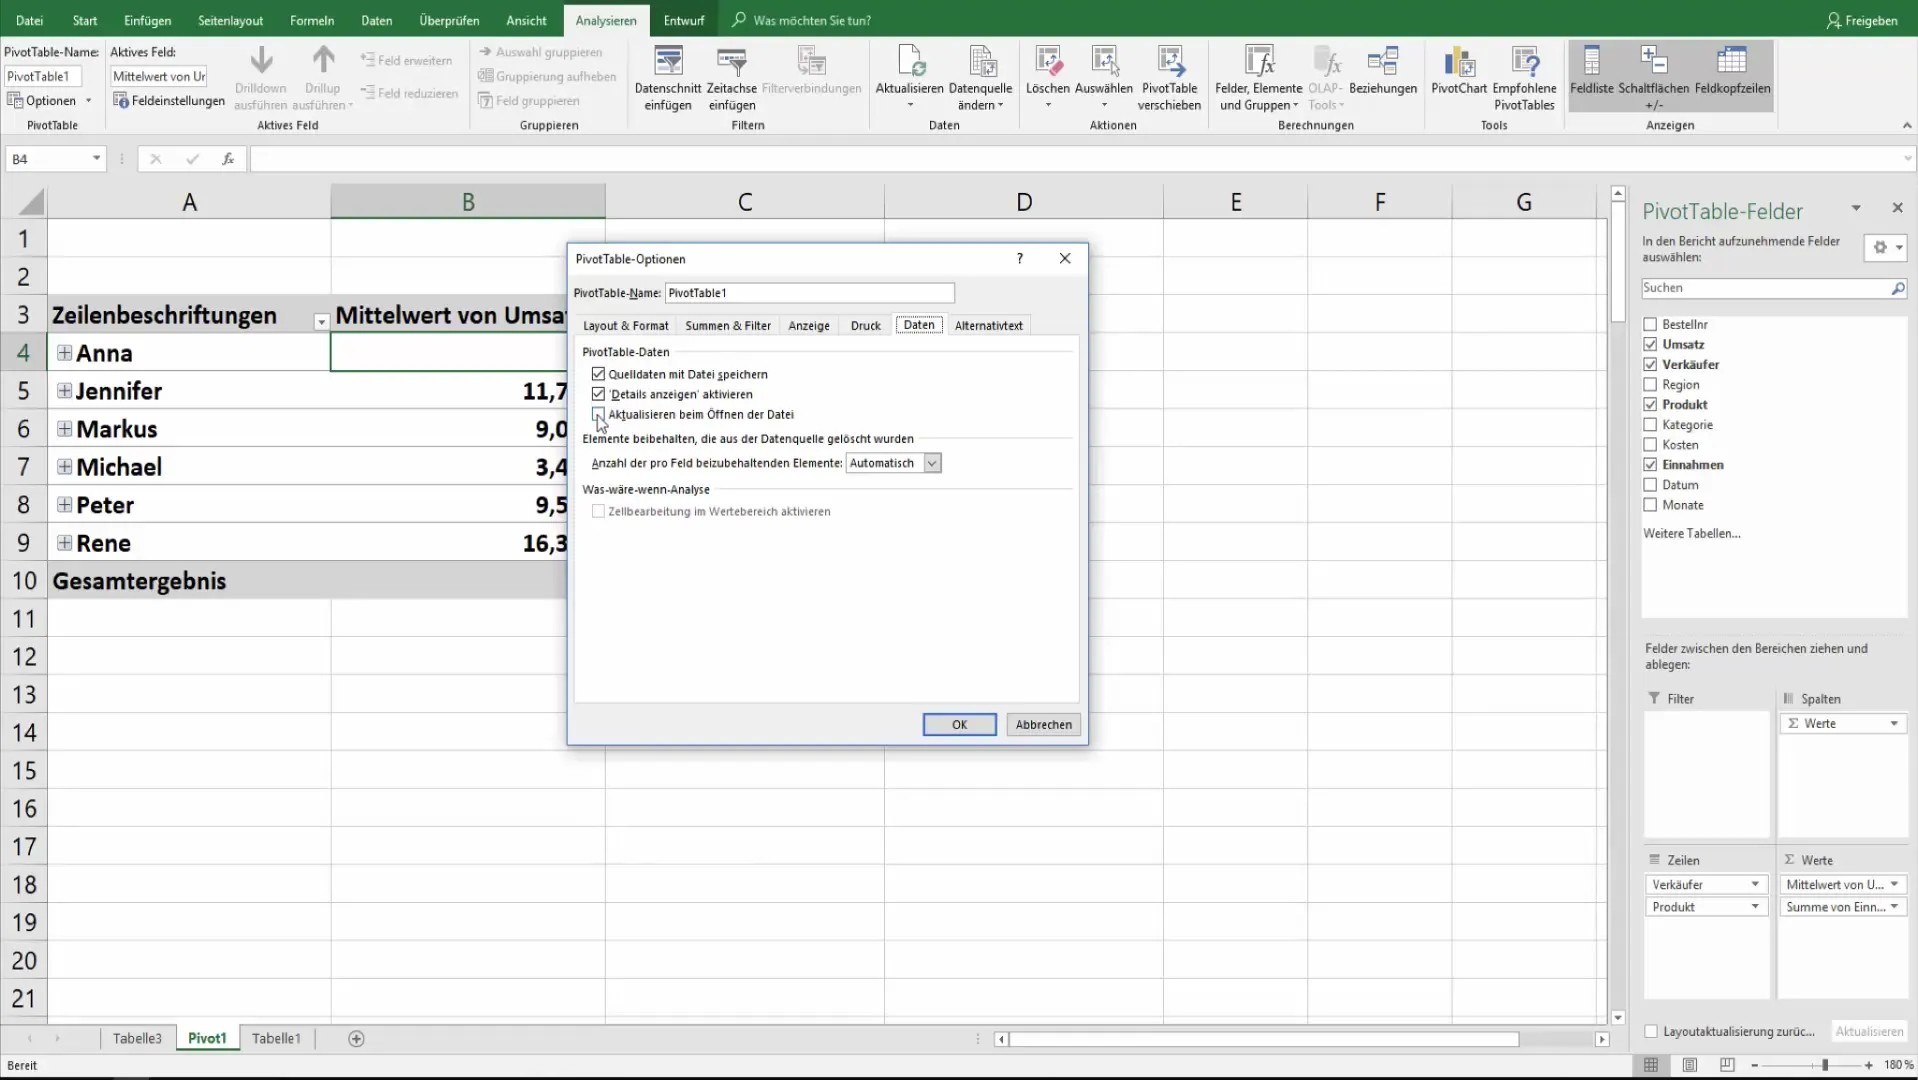
These options are particularly valuable when working with data that is regularly updated to ensure you always have the latest information at hand.
Adding Alternative Texts
One final but useful option is to add alternative texts to the fields of your pivot table. Here, you can insert titles and descriptions that clarify the purpose or content of the data.
Summary
In this tutorial, you have learned how to optimize the options in Excel pivot tables. You can customize the display of values, layouts, and data controls, as well as define updates to improve your data analysis. By fully utilizing its capabilities, you can not only increase your efficiency but also ensure a professional data presentation.
Frequently Asked Questions
How can I create a pivot table?Click on "Insert", select "PivotTable", and choose the data you want to analyze.
Can I apply multiple filters in a pivot table?Yes, you can specify in the options whether multiple filters per field are allowed.
How do I deal with empty cells in my pivot table?You can choose whether to display a placeholder or nothing in the empty cells.
How do I update my pivot table after changes in the source data?Click on "Refresh" to load the latest data into your pivot table. You can also set the table to update automatically when opened.
What can I do to make my pivot table more printer-friendly?In the print options, you can specify whether titles and buttons should be displayed when printing.


