You want to calculate the mode in Excel to effectively analyze your data? In this guide, I'll show you how to determine the mode as a measure of central tendency or central tendency for the Gender variable from a survey. We will use both direct calculation through functions and evaluation through Pivot tables. Let's get started right away!
Main Insights
- The mode is the most common feature manifestation of a nominal scaled variable.
- For nominal features like Gender, the mean cannot be calculated; instead, you use the mode.
- Excel offers various ways to calculate the mode, including function use and Pivot tables.
Step-by-Step Guide
1. Prepare the Data
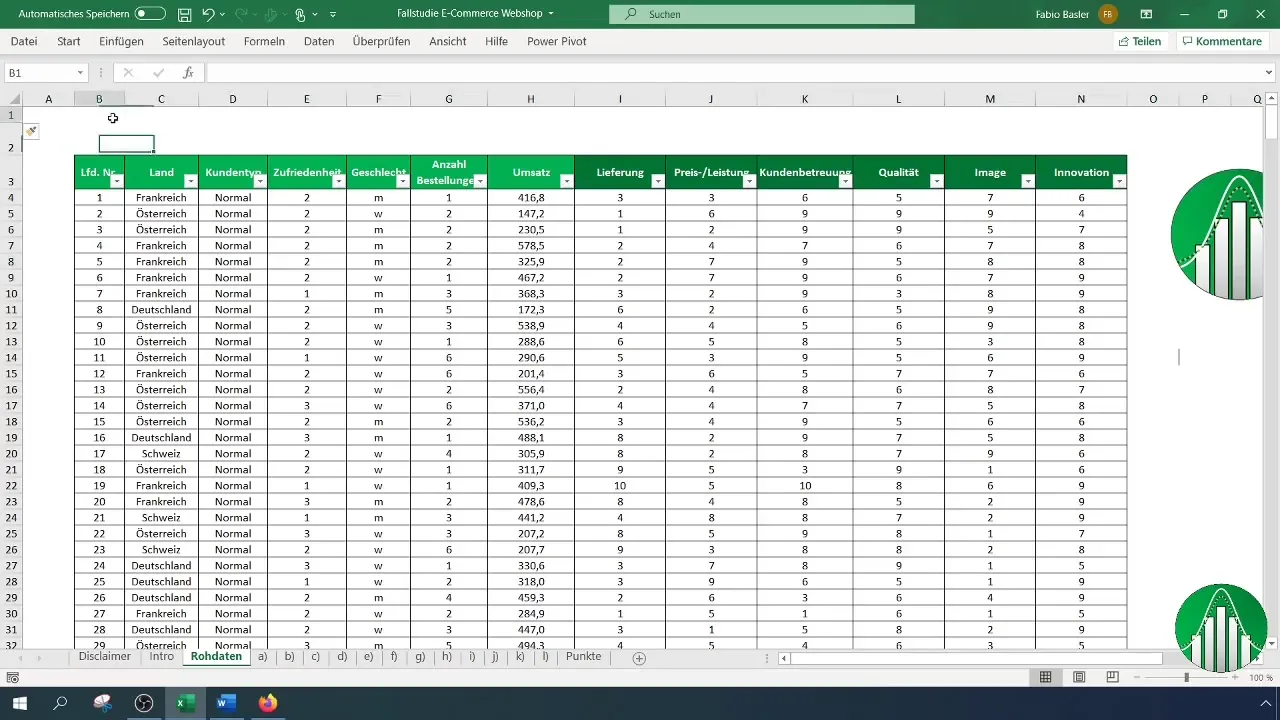
Before you start calculating the mode, it is essential that your data is correctly structured in Excel. You have a data set that considers the Gender variable, which is categorized into two manifestations: male and female.

2. Analyze the Scale Level
To determine which measures you may use, it is crucial to know the scale level of the data. Gender is a nominal feature, which means there is no natural order or quantitative measure here. This is essential in choosing the appropriate measure of central tendency.

3. Insert a Header
Place a header for your dataset in the Excel worksheet. This will make the analysis clearer later. You can optionally highlight the header with color after inserting it to keep it visible in the Pivot tables section.
4. Create a Dropdown Menu (Optional)
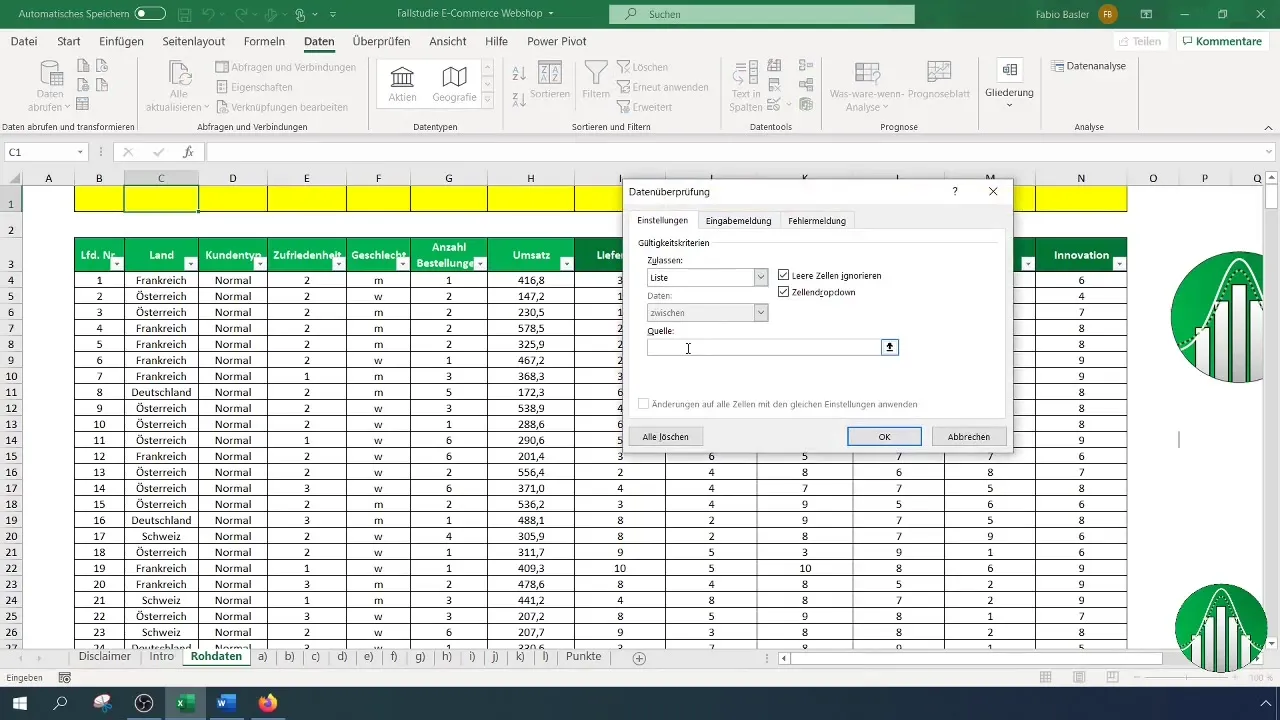
Use data validation in Excel to create a dropdown menu for the feature manifestations. This can help standardize the input of future data.
5. Calculating the Mode
To calculate the mode, use the MODE function in Excel. Simply go to an empty cell and enter the following formula: =MODE().
6. Selecting the Range for Mode Calculation
Instead of manually scrolling through the data, you can hold down the "Ctrl" and "Shift" keys and use the down arrow key to quickly select the entire data range. This speeds up the process significantly.
7. Handling Error Messages
If you want to calculate the mode and your data is not numeric, you may get an error message. In this case, you could recode the nominal manifestations or create a Pivot table.

8. Alternatively: Create a Pivot Table
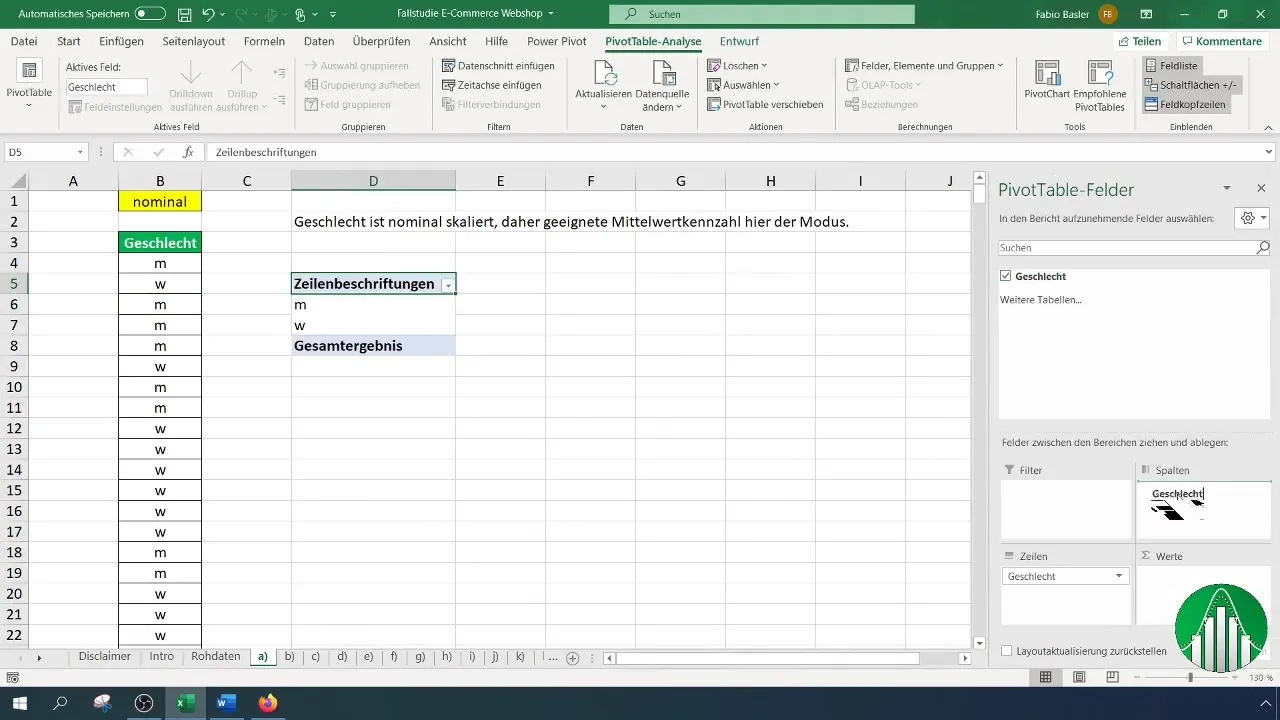
An easy method to determine the mode is by creating a Pivot table. Select the relevant data and go to "Insert" > "PivotTable". Drag Gender into both the "Rows" and "Values" sections.
9. Analysis in the Pivot Table
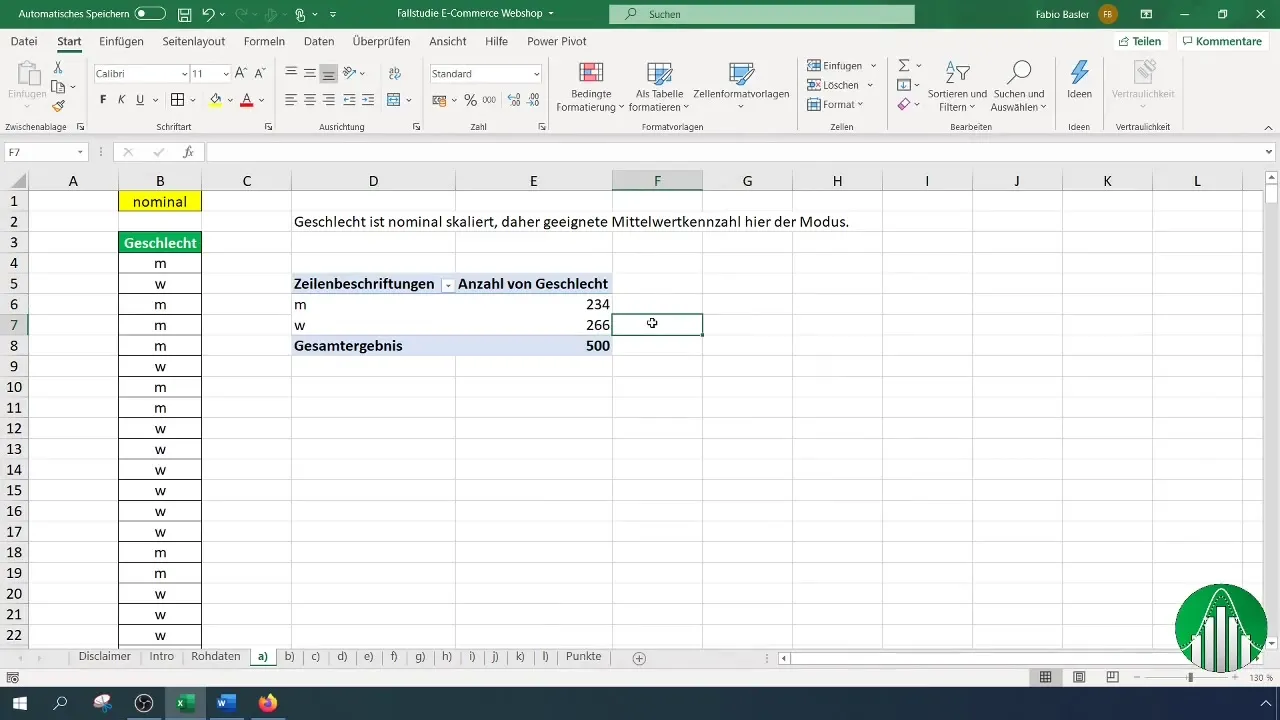
In the Pivot table, you can now see how frequently each feature manifestation occurs. The mode is the most common manifestation, which you can easily read here.
10. Optional: Coding the Values
If you code the values as 0 (male) and 1 (female), when you calculate the mode again, Excel will return the coded number, making the analysis easier.

Summary
Calculating the mode in Excel is an effective tool to identify frequent characteristics in nominally scaled data. Whether you perform the calculation directly through Excel functions or through pivot tables, both methods provide you with valuable insights into your data.
Frequently Asked Questions
How do I calculate the mode in Excel?You can easily calculate the mode using the formula =MODE() and selecting the corresponding data range.
What should I do if I get an error message?If you receive an error, you should ensure that your data is suitable for calculation or you could analyze the data as a pivot table.
Why is it not appropriate to calculate a mean for nominal scale levels?Nominal features do not have a quantitative relationship, hence mean calculations are not meaningful.
How can I prepare my data for mode calculation?You should ensure that your categories are clearly defined and structured in order to perform effective analyses.


