Rank correlation analyses are of central importance in the statistical investigation of relationships between variables. Especially when dealing with ordinal scaled data, the Spearman rank correlation is a valuable method for recognizing patterns and connections. In this guide, you will learn step by step how to calculate the Spearman rank correlation for a survey using Excel.
Key Insights
- Rank correlation measures the strength and direction of a monotonic relationship between two ordinal variables.
- The Spearman rank correlation coefficient is particularly suitable when one of the variables is ordinal and the other is metrically scaled.
- The calculation in Excel can be done using simple formulas and functions.
Step-by-step Guide
First, we define the variables we want to analyze. In this case, it is the satisfaction of the customers (ordinal scale, values 1-3) and the number of orders (metrically scaled).

To create a ranking for satisfaction and the number of orders, you need a table containing the relevant data. Make sure to enter this data into Excel.

After entering your data into Excel, let's look at the calculation of the Spearman rank correlation. For this, we will use the "Rank.Avg" function in Excel, which returns the rank of a number within a list. For satisfaction, we first use the formula:
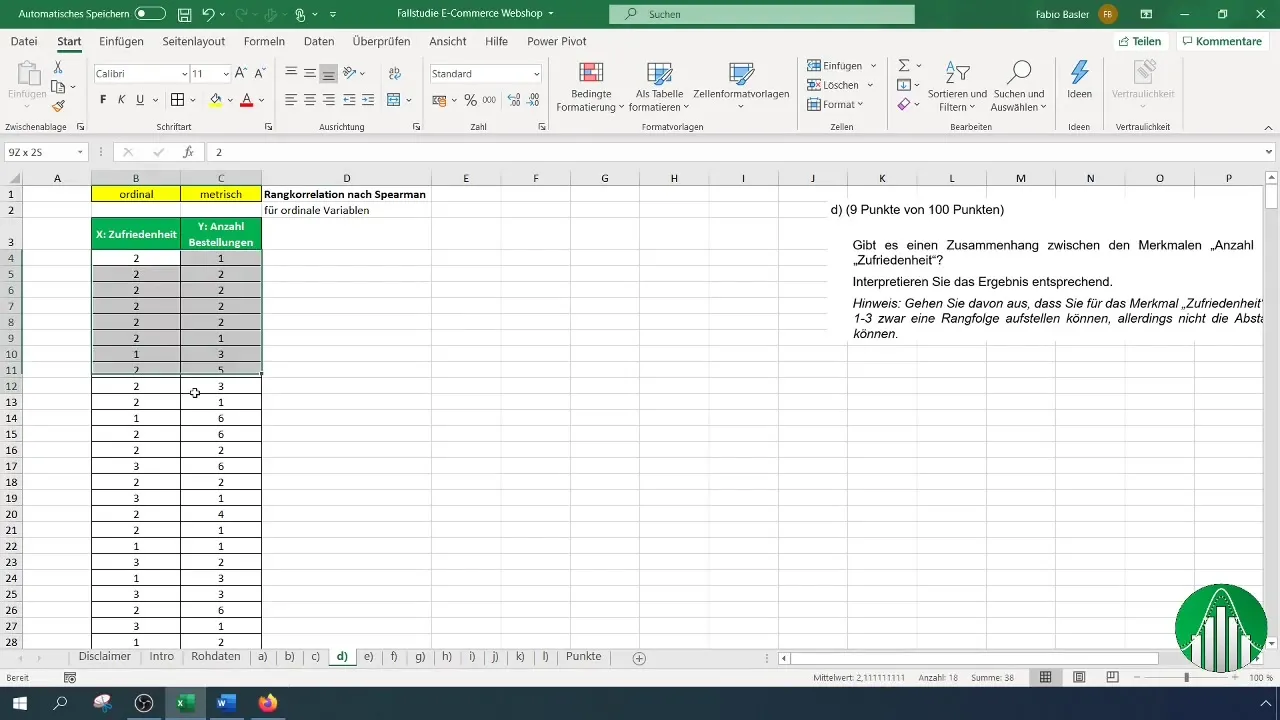
When applying this formula, remember to highlight the column for satisfaction and define the entire range from B4 to the end of your data series to correctly identify the ranks.
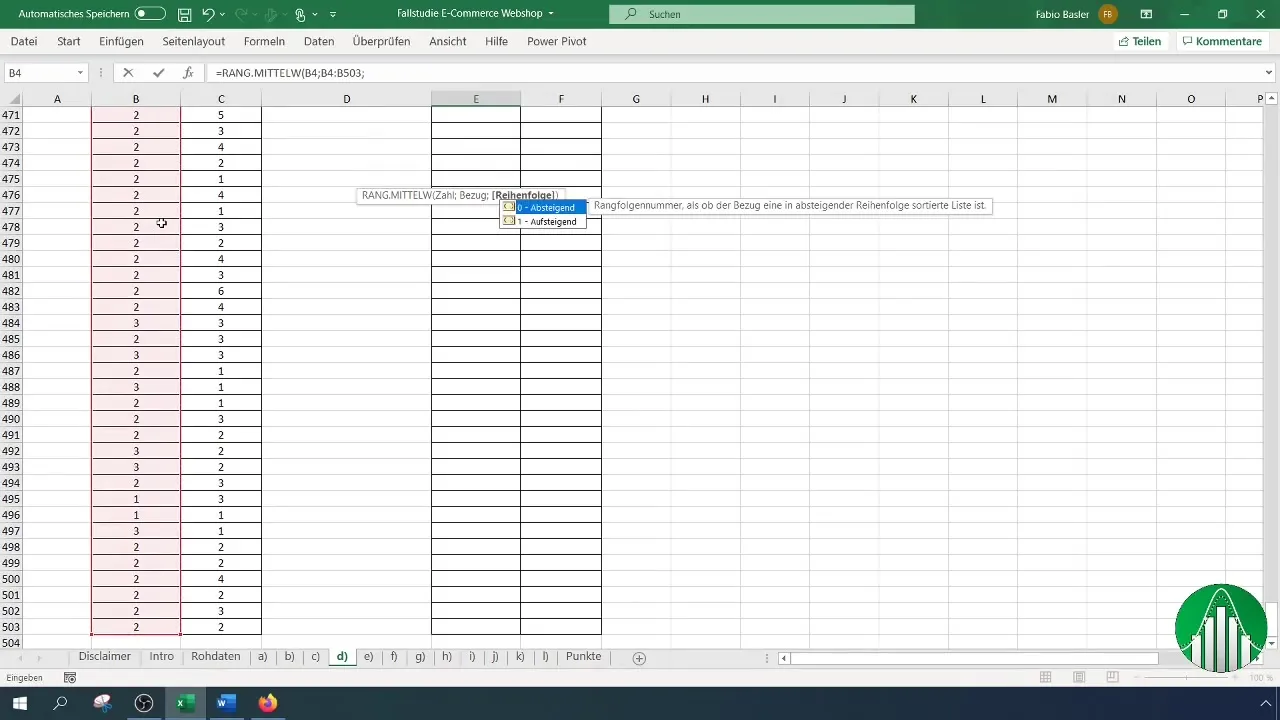
Decide whether you want to sort the ranks in ascending or descending order. Usually, it is sensible to sort them in ascending order. Note that you should fix the cell references for the ranks by using the F4 key. This is important so that the references are not altered during copying.
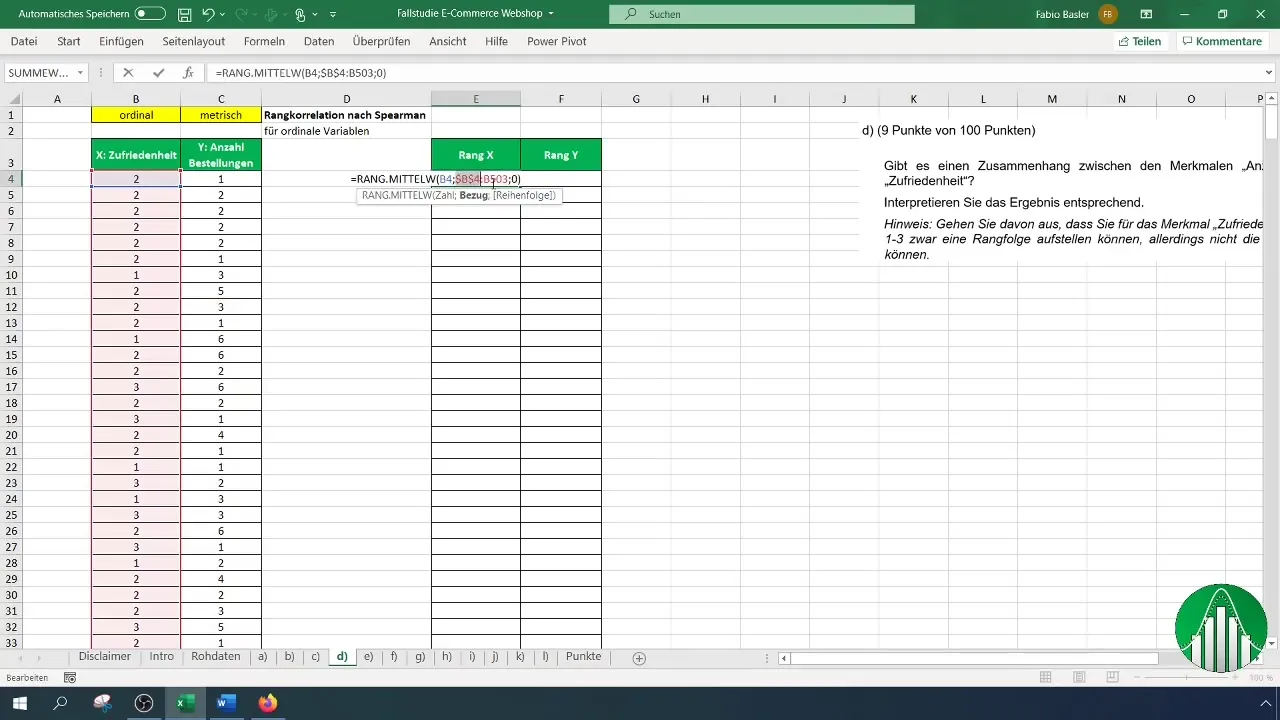
Once you have established the ranks for satisfaction, repeat the process for the number of orders. Make sure to apply the formula and reference correctly.
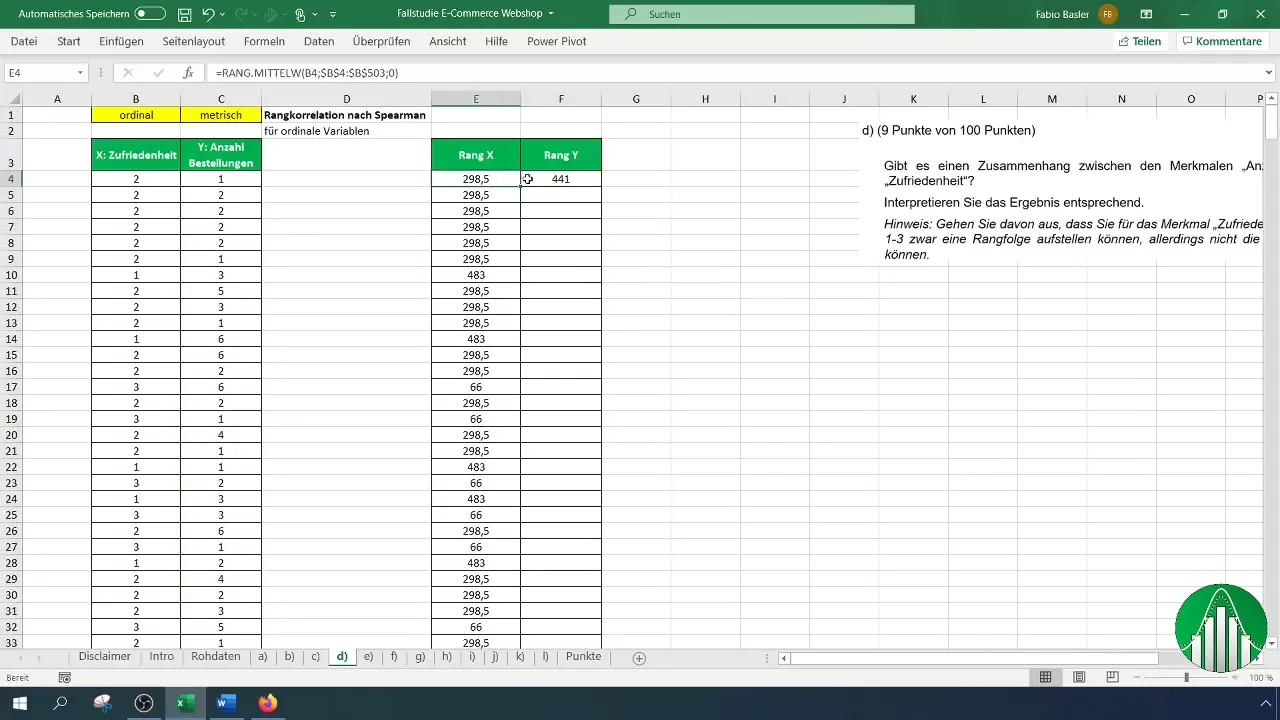
With both rank lists (satisfaction and number of orders), you are ready to calculate the Spearman rank correlation coefficient. To do this, use the formula "=CORREL" to determine the relationship. The syntax looks like this:
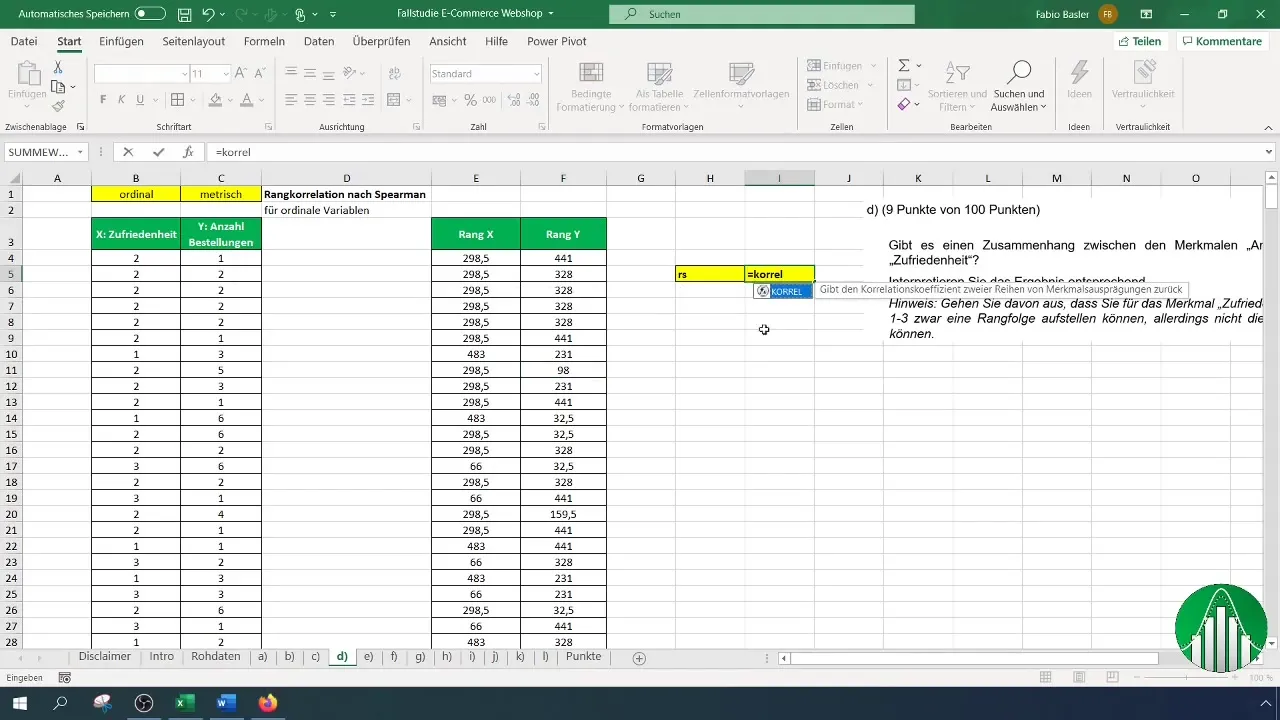
For the first reference, specify the rank list of satisfaction and for the second, the rank list of orders. Excel will now automatically calculate the Spearman rank correlation coefficient.
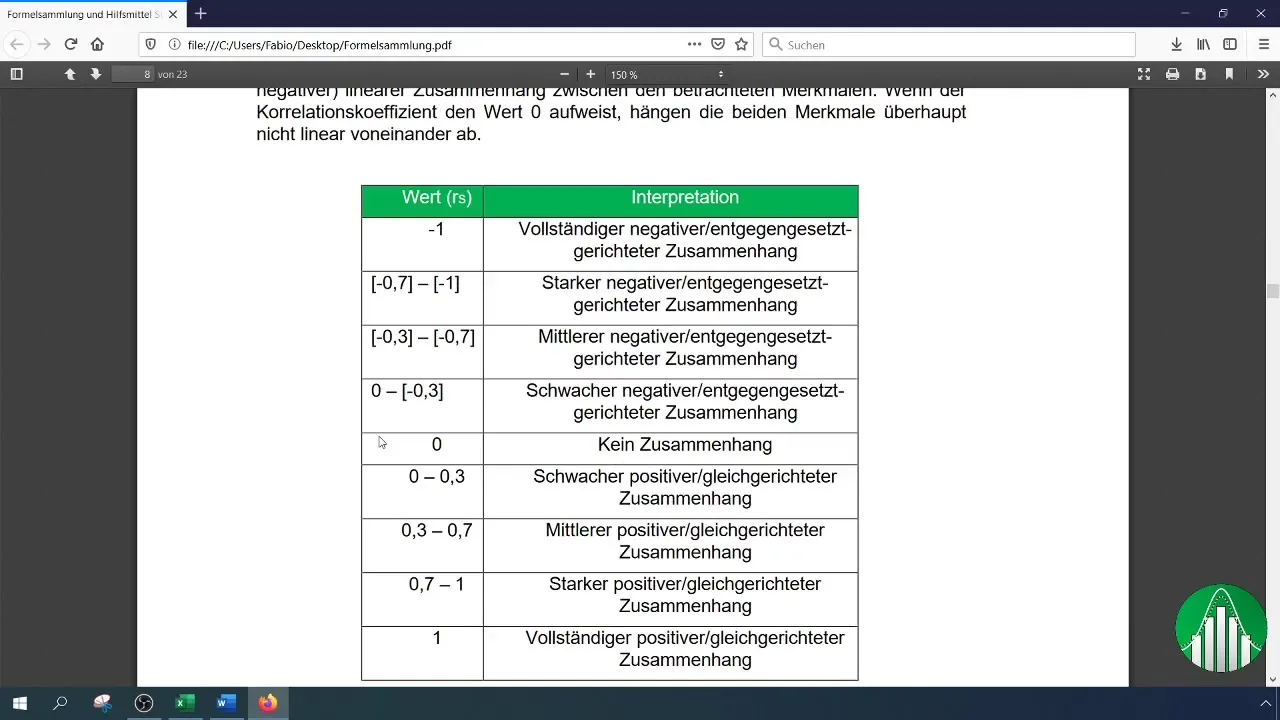
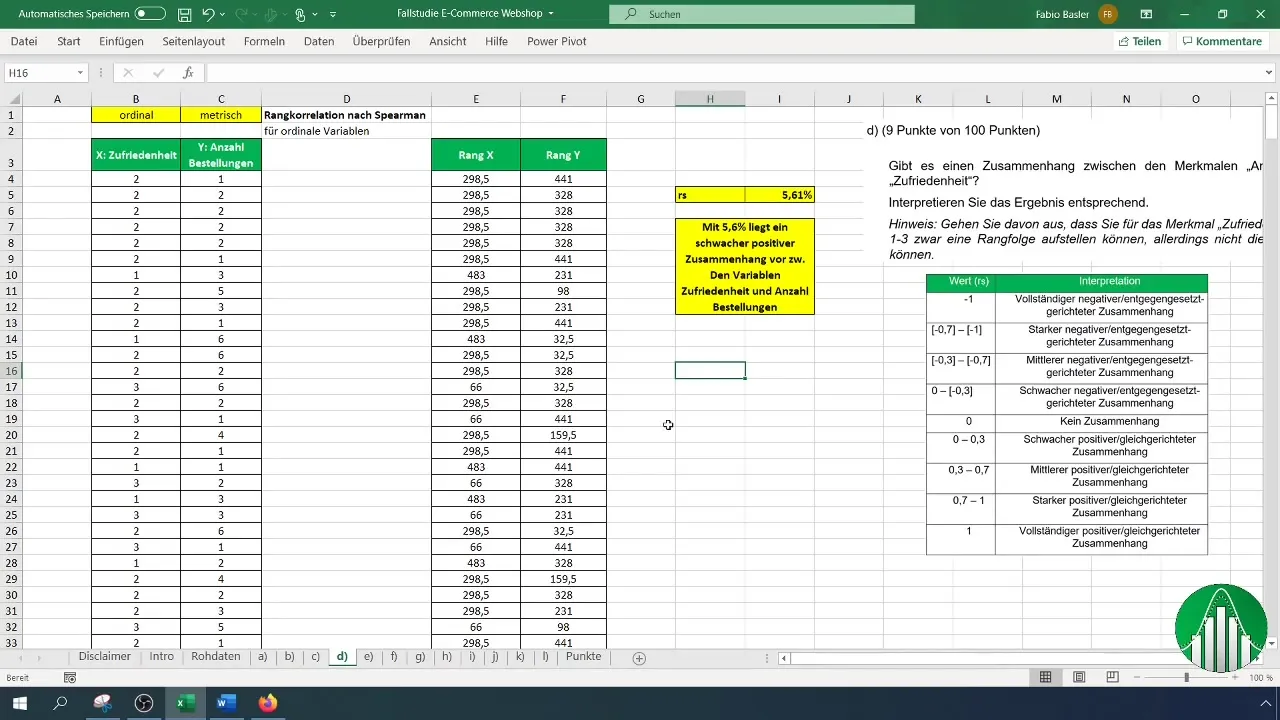
What is the result of your calculation? A value of 5.61% indicates a weak positive relationship between satisfaction and the number of orders. This means that there is hardly a significant relationship between these two variables.
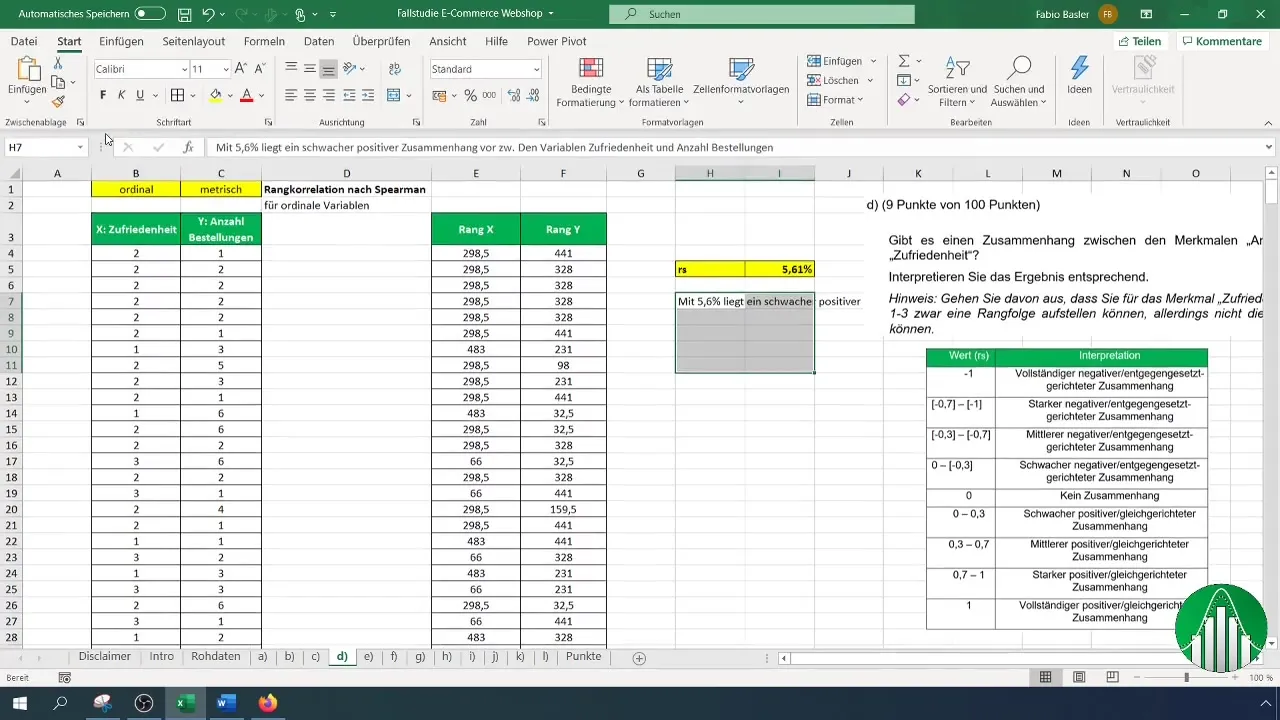
To interpret your results, use a value table listing the different ranges of the rank correlation. After interpretation, we confirm that the low correlation rate indicates that the variables are relatively independent.
Summary
Conducting a rank correlation analysis according to Spearman in Excel allows you to gain valuable insights into the relationships between ordinal and metric variables. The method is easy to apply and provides a clear view of any connections.
Frequently Asked Questions
What is the Spearman rank correlation coefficient?The Spearman rank correlation coefficient measures the strength and direction of a monotonic relationship between two variables.
When is the use of the Spearman coefficient meaningful?It is meaningful when at least one of the variables is ordinal scaled.
How do I calculate the Spearman coefficient in Excel?Use the "RANK.AVG" function to determine the ranks, and then the "CORREL" function to calculate the relationship.
What is the range of values for the Spearman coefficient?The coefficient ranges from -1 to 1. Values close to 1 indicate a strong positive correlation, while values close to -1 indicate a strong negative correlation.
What can a value of 5.61% mean in rank correlation?A value of 5.61% indicates a weak positive relationship, suggesting that the variables are relatively independent.


