The normal distribution is a central concept in probability theory and statistics. In every data collection that is uniformly distributed, we observe the so-called bell curve, which often occurs in surveys and sales analyses. In this tutorial, you will learn how to calculate and visualize the normal distribution for a survey using Excel to determine crucial probabilities. With these skills, you can not only better understand your data but also use it strategically to make informed decisions.
Key Takeaways
- You will learn the step-by-step calculation of normal distribution in Excel.
- The possibilities of graphically representing a normal distribution will be demonstrated.
- You will understand how probabilities for specific events can be calculated.
Step-by-Step Guide
First, you should ensure that all the necessary data is available in an Excel table. This data represents, for example, the revenues from a survey.
Visualization of the Normal Distribution
To graphically represent the revenue's normal distribution, follow these steps:
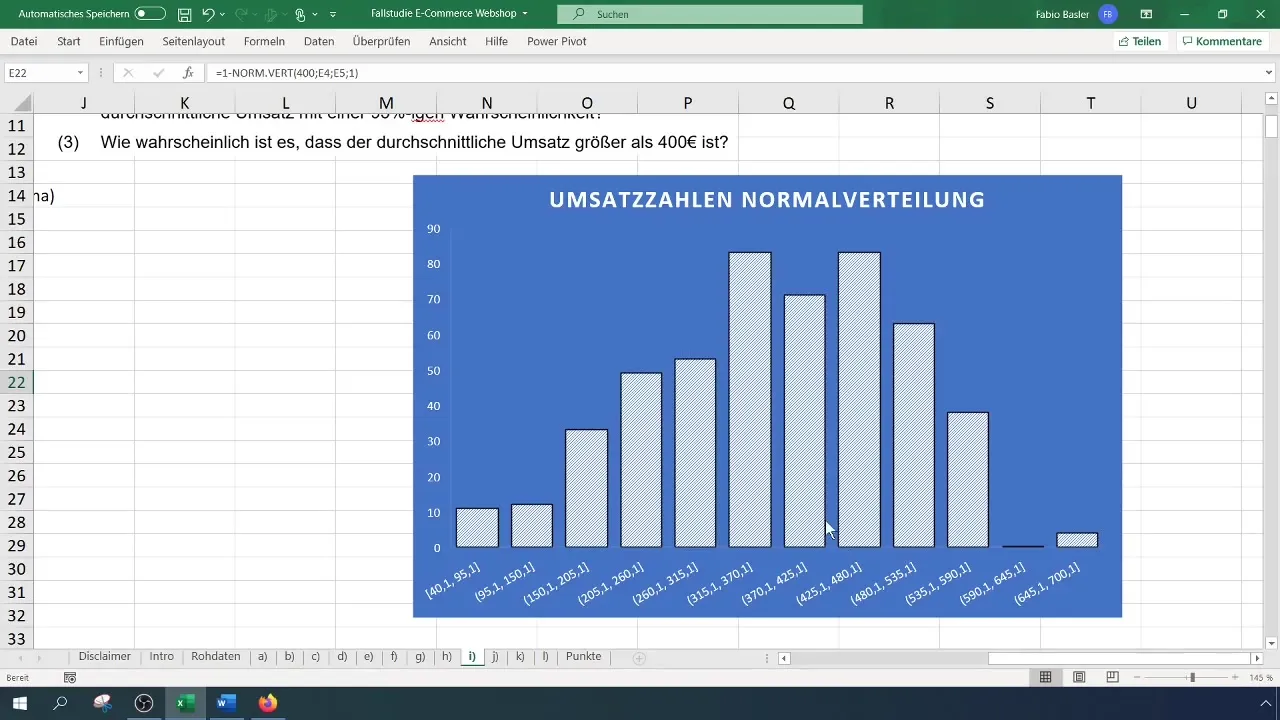
First, select the revenue data in your Excel table and copy it into a new column. In the menu bar, click on "Insert" and select "Chart". Here, choose a histogram to visually represent the distribution. You can select an empty histogram to display the standard values of your data.

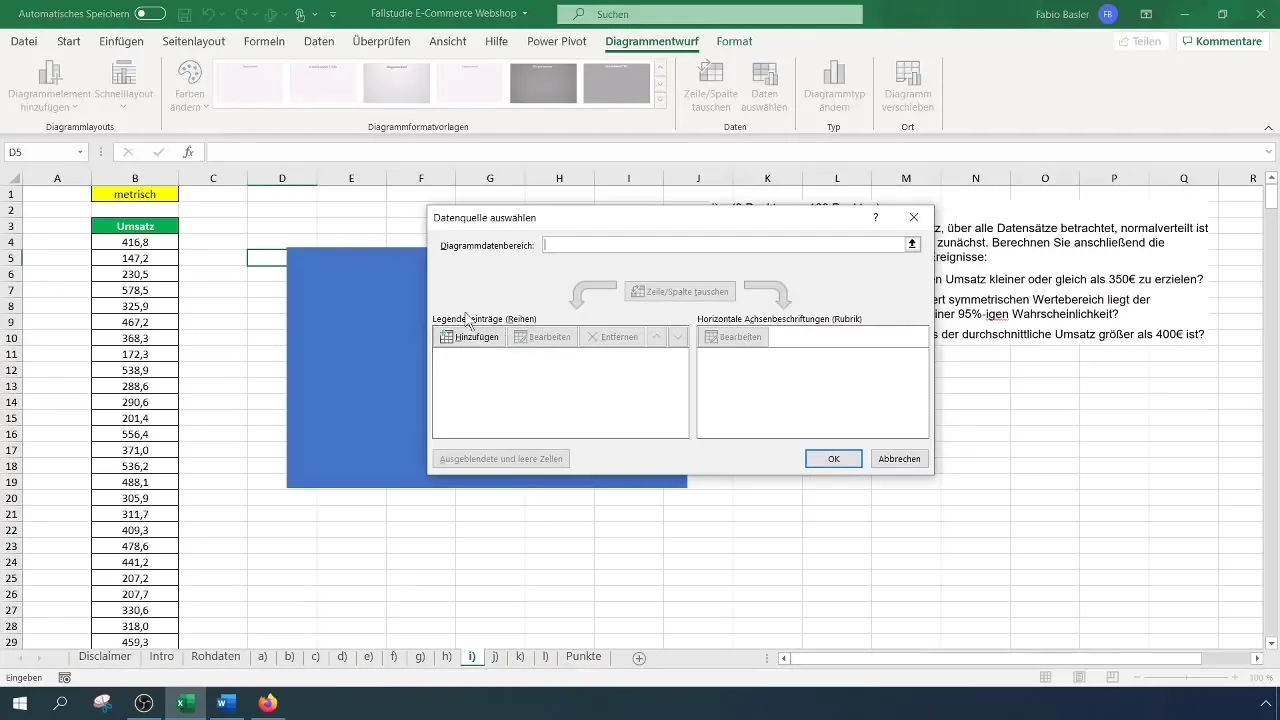
Right-click on the chart and select "Select Data". In the opening window, add your revenue data as the first data series. In the row values, select all data points by holding the Shift key and selecting the values.
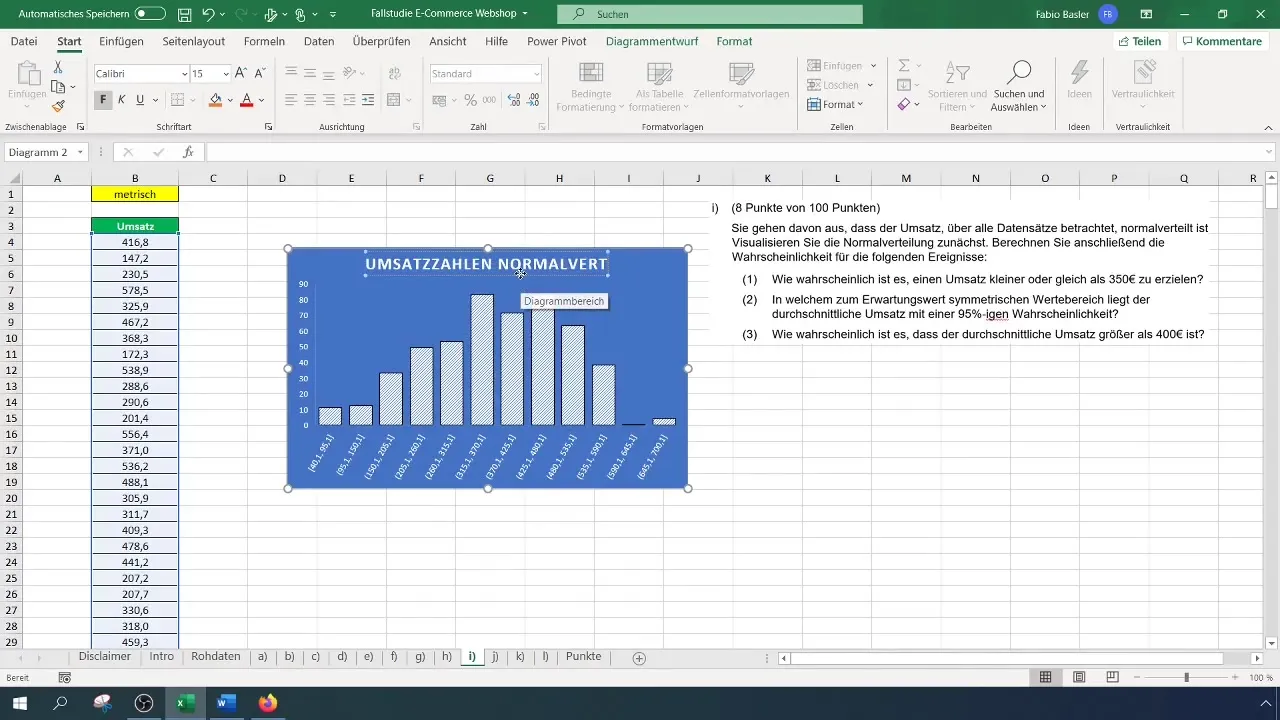
Once the data is displayed in the histogram, you can customize the chart title to make it more representative. For example, change the title to "Revenue Figures Normal Distribution". Ensure that the bell curve is recognizable; this indicates a normal distribution.
Calculating Probabilities
The next task is to determine the probability that the revenue is less than or equal to €350. For this, you need the mean and standard deviation of the revenue data.
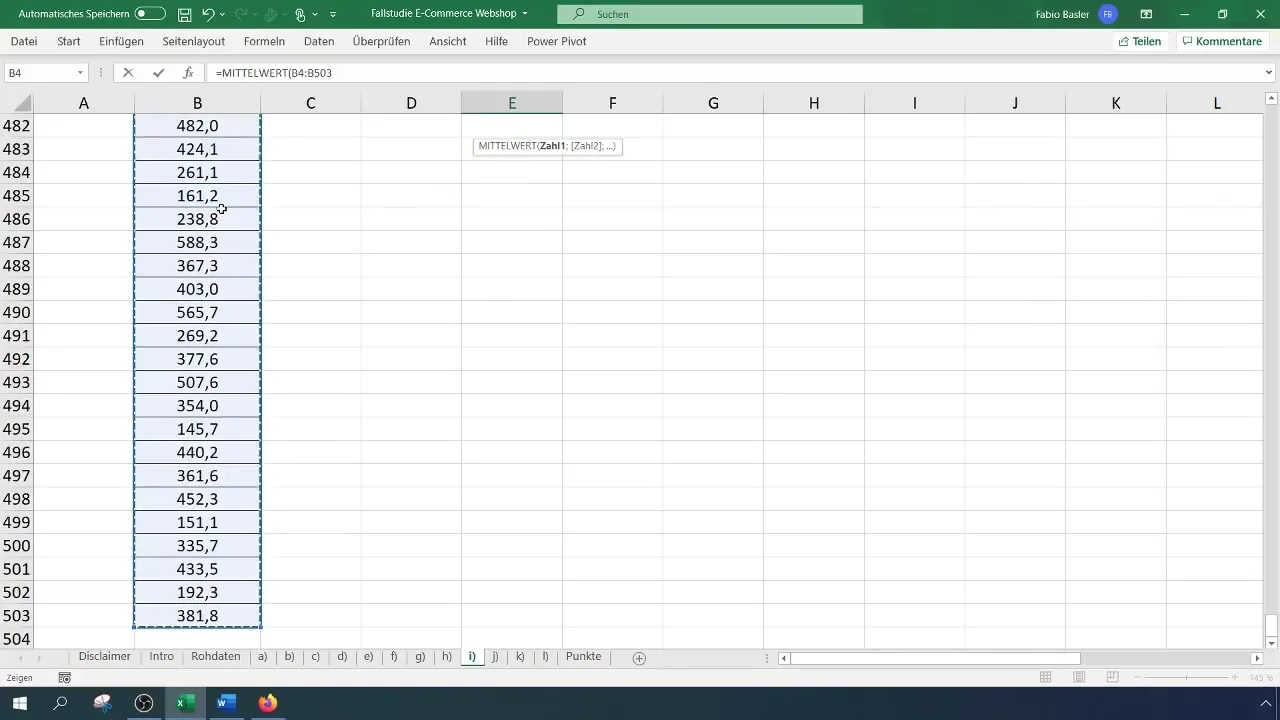
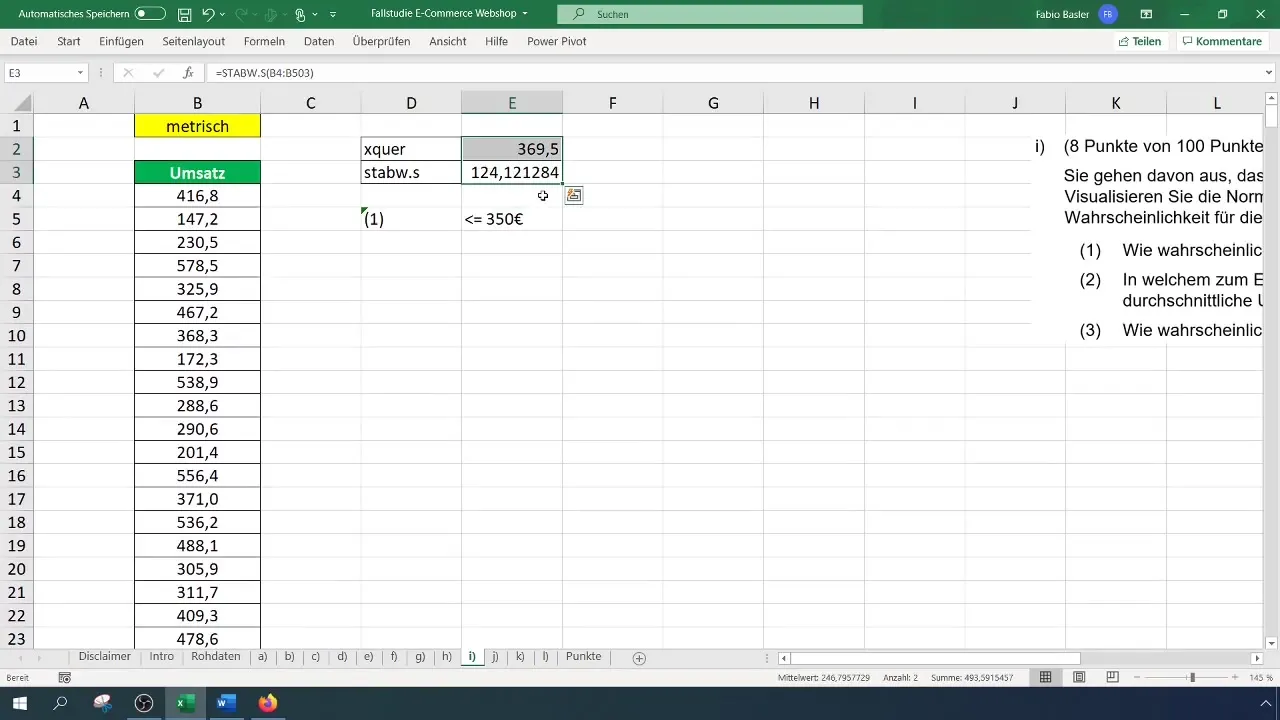
To calculate the mean, use the formula =AVERAGE(A1:A100) (Here, replace A1:A100 with the actual data range). In your example, this could result in an average revenue of €369.
For the standard deviation, use the formula =STDEV.P(A1:A100), and this could result in approximately €124.12 in your case.
Now you can calculate the probability for revenue of €350. This is done using the formula: =NORM.DIST(350; mean; standard deviation; TRUE). Insert the respective values and press Enter.
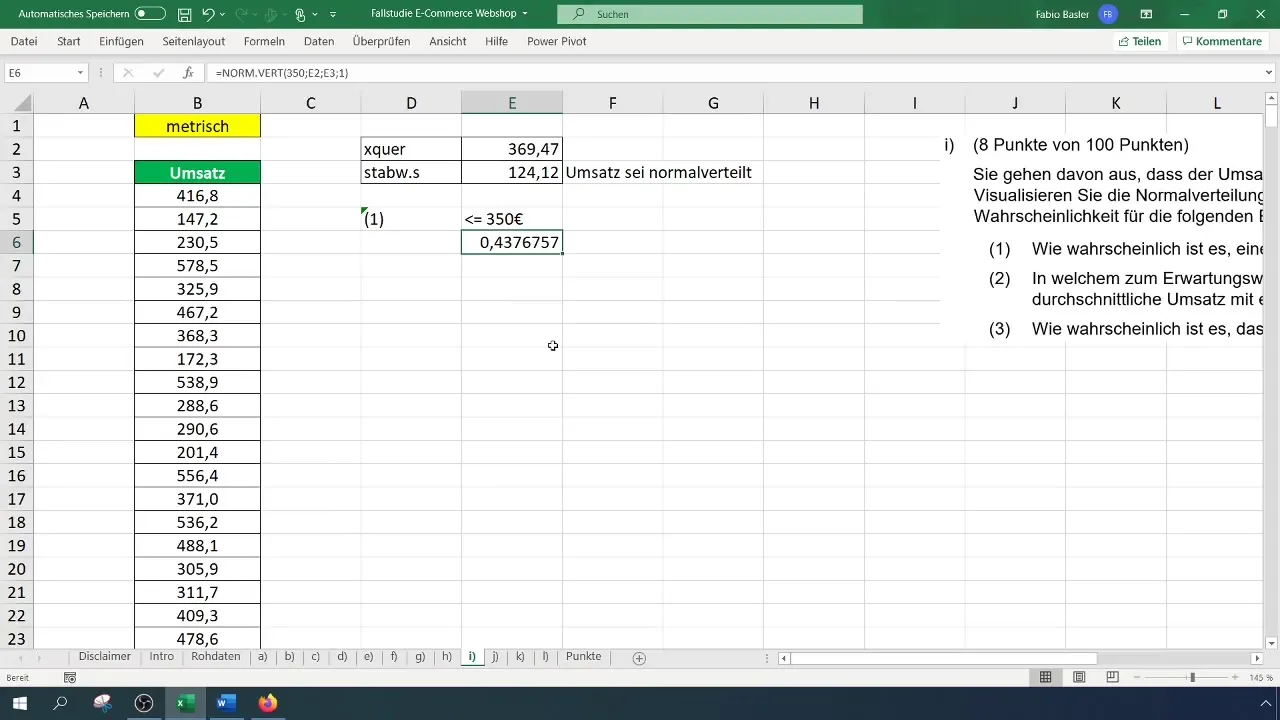
The result of this calculation could show you that the probability of achieving revenue less than or equal to €350 is approximately 43.8%. To illustrate this, format the values and switch to percentage representation.
Calculating the Symmetric Value Range around the Expected Value
The next goal is to determine the symmetric value range around the expected value with a probability of 95%. For this, you must find the quantitative value for 95%.
This is done by entering the formula =NORM.S.INV(0.95) into a cell, which will give you the quantile value of 1.65.
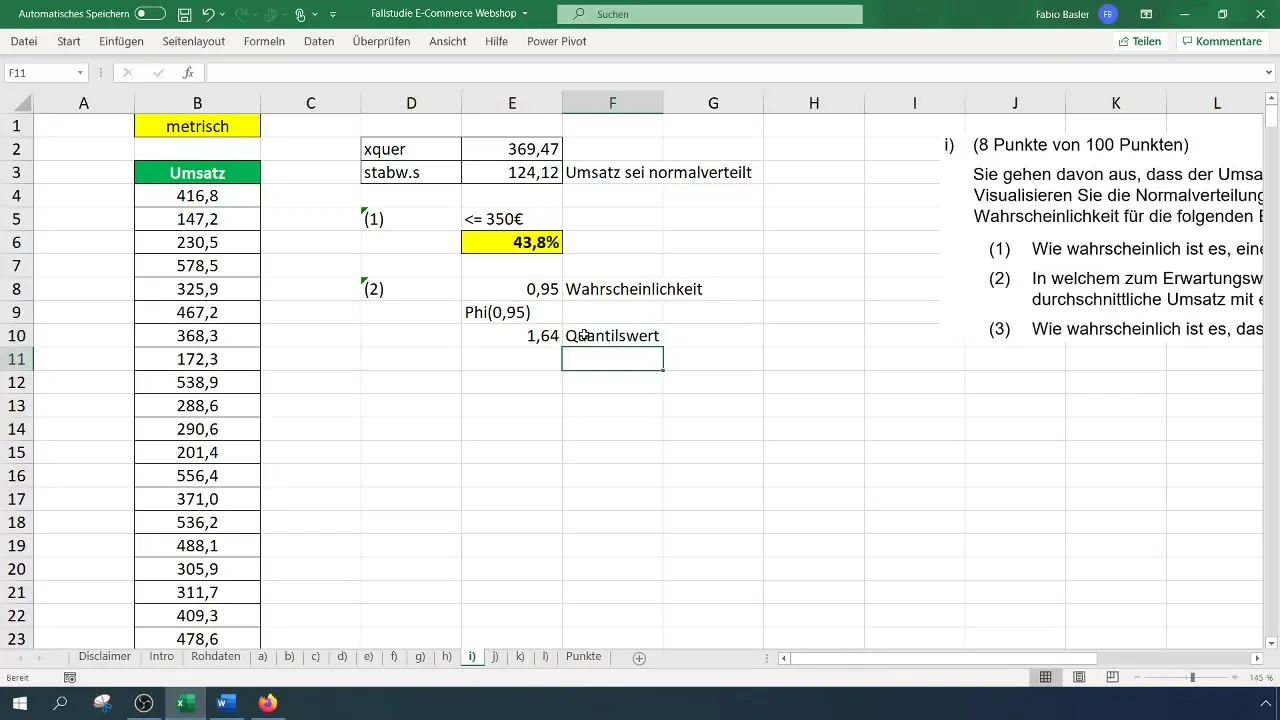
Now you insert this calculation into an equation to find the value range. The formula could look like this: Expected value + (Standard deviation * Quantile value). Insert the respective values and calculate the symmetric value range.
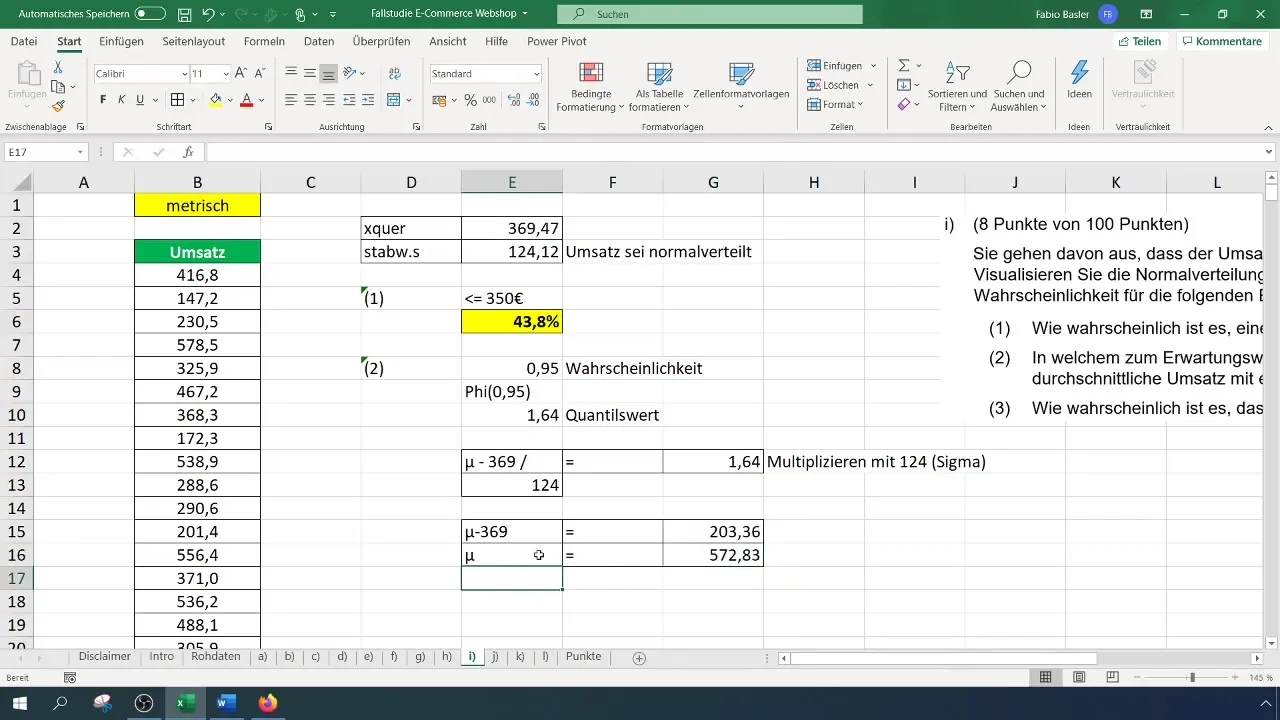
For example, if you receive a value of 572 euros, this means that with a probability of 95% you can expect a turnover within this range.
Probabilities for higher turnovers
For the final calculation, you will determine the probability that the turnover is greater than 400 euros. To do this, use the formula =1 - NORM.DIST(400; mean; standard deviation; TRUE).
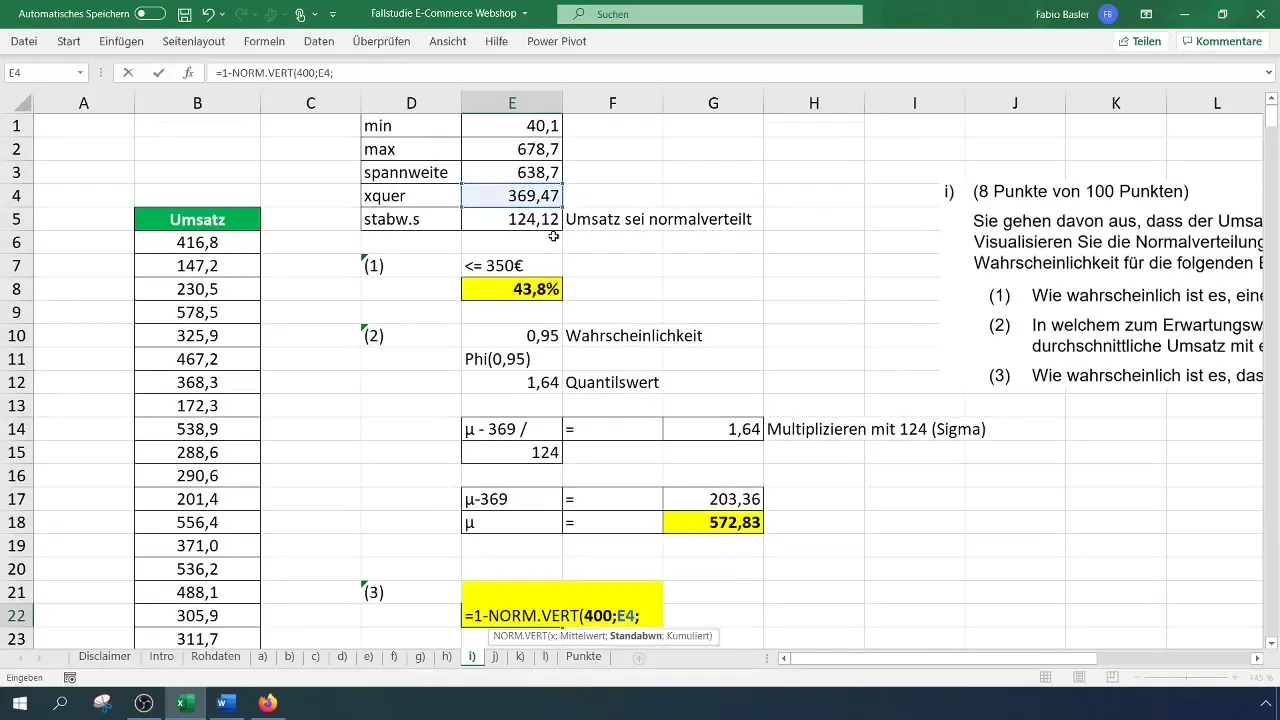
The probability could also be around 40% here. These values are worth questioning. By looking at the scale in the histogram, you can understand the consistency of the percentage of higher turnovers.
Summary
In this guide, you have learned how to use Excel to calculate probabilities using the normal distribution. Based on practical examples from a survey, you have learned how to handle data graphically and computationally. Understanding these concepts will help you successfully implement statistical analyses in your projects.
Frequently Asked Questions
How do I calculate standard deviation in Excel?Use the formula =STDEVP(data range) to calculate the standard deviation.
Can I use normal distribution for non-normal data?Normal distribution is best suited for data that are normally distributed. Otherwise, the result could be misleading.
How can I customize charts in Excel?Click on the charts and select the formatting options in the menu bar to customize the chart according to your needs.


