The calculation of confidence intervals is an essential part of statistical analysis, especially when it comes to drawing conclusions about a population from a sample. In this guide, I will show you how to calculate a two-tailed confidence interval for the average revenue of a survey in Excel. You will learn what different steps are necessary to go from raw data to the final confidence interval and how to implement this methodology in Excel.
Key Insights
- A two-tailed confidence interval indicates within which limits the true average revenue can lie with a certain level of confidence.
- For the calculation, you need the mean, the standard deviation, the sample size, and the corresponding t-quantile.
- Excel provides you with the necessary functions to calculate these values and visually represent the confidence interval.
Step-by-Step Guide
Step 1: Prepare Data
First, you should prepare the relevant data in Excel. For this example, we are only considering the regular customers, as the average revenue is to be calculated only for this group.

You can select and copy the data on your worksheet to paste it into a new area. This is done to filter your analysis for the respective customer groups.

Step 2: Gather Basic Information
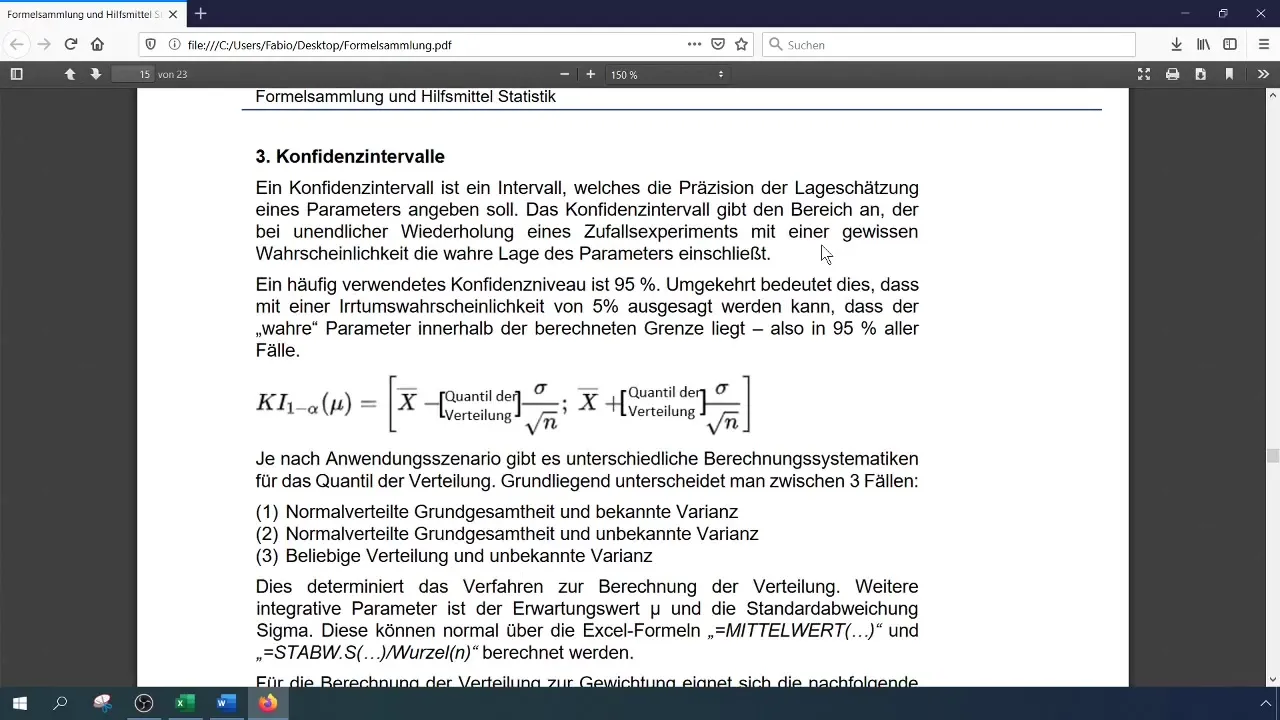
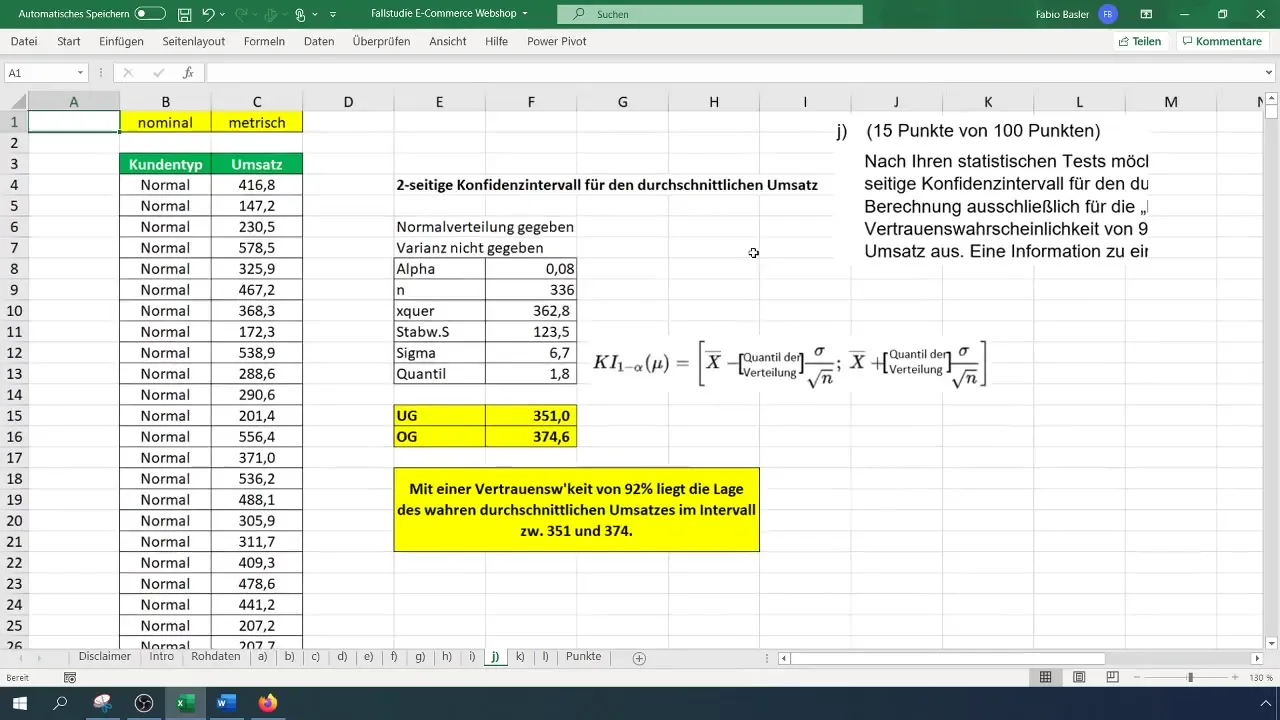
Create a simple table in Excel where you record all the important parameters. These include the sample size (n), the mean (x̄), the standard deviation (σ), and the relevant quantile. We already know that we are assuming a normal distribution and do not have variance available.

Step 3: Calculate Sample Size (n)
To determine the number of observations for regular customers, you need to cut out the relevant data and find the count using the function =COUNT(). In this case, you should get 336 observations from the filtered data.
Step 4: Calculate Mean (x̄)
Calculate the mean of revenues by applying the formula =AVERAGE(). This will give you the average revenue for regular customers, which in our example is 362.80 euros.
Step 5: Determine Standard Deviation (σ)
Use the formula =STDEV.S() to calculate the standard deviation. This is required for inductive statistics, so we use the standard deviation for the sample. The calculated value is 123 euros.
Step 6: Calculate Sigma (σ / √n)
Now, calculate the standard deviation for the mean by dividing the standard deviation by the square root of the sample size. Use the formula: =Standard Deviation/SQRT(Sample Size).
Step 7: Find t-Quantile
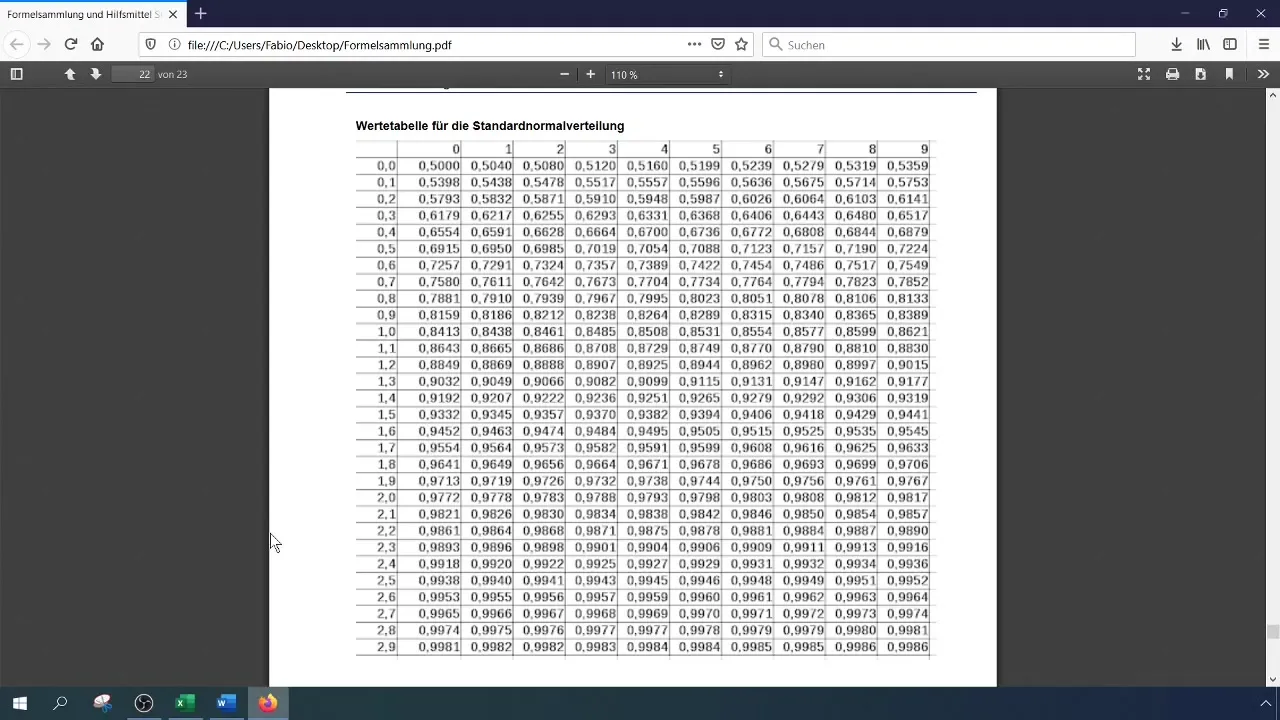
Since we have a normal distribution with an unknown variance, we need to find the t-quantile. Use the Excel function =T.INV.2T() specifying the alpha level (0.08) and the degrees of freedom (n-1). In your case, this results in a t-value of 1.8.
Step 8: Calculate Lower Bound of Confidence Interval
Now calculate the lower bound of the confidence interval. The formula is: =Mean - (t-Value * Sigma). This gives you the lower bound, which in our example is 351 euros.
Step 9: Calculate Upper Bound of Confidence Interval
Now you can calculate the upper bound of the confidence interval. The formula is similar, except this time you add the t-value to your mean: =Mean + (t-Value * Sigma). This gives you an upper bound of 374 euros.
Step 10: Representing the Confidence Interval
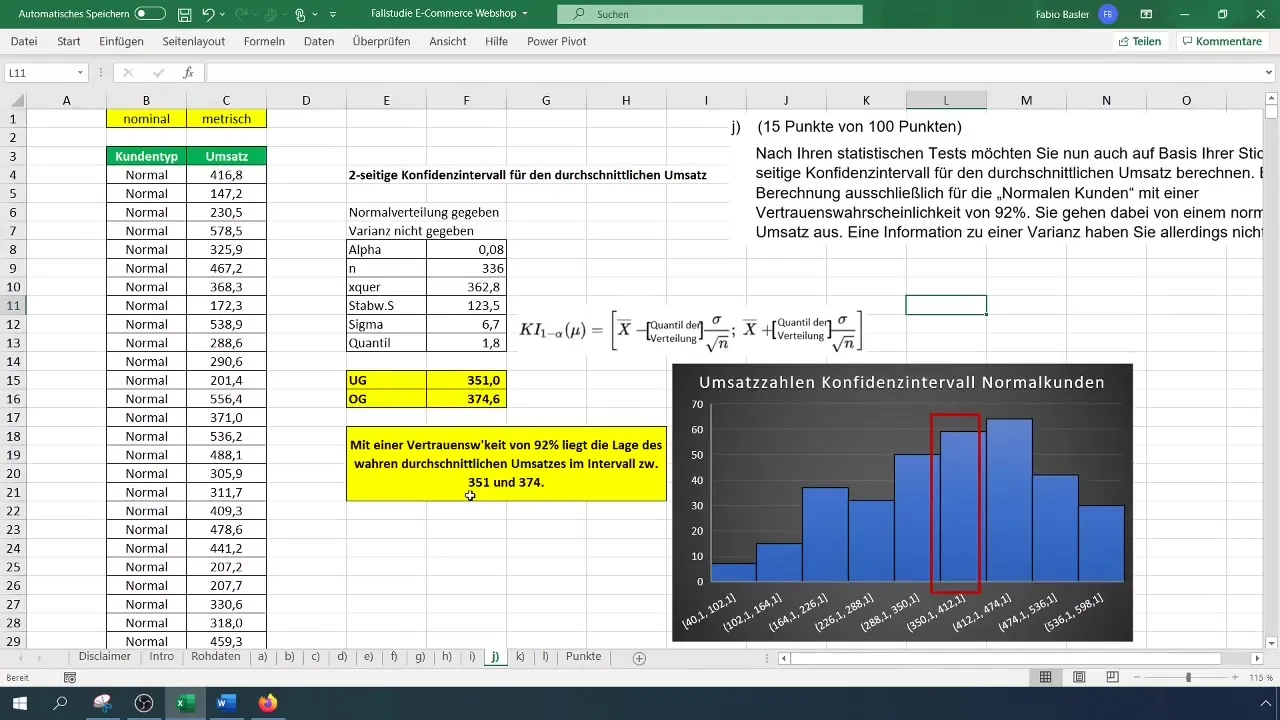
To visualize your results, you can create a histogram in Excel and mark the confidence interval on it. Draw a line between the lower and upper bounds to show the range within which the true average revenue of regular customers lies with a confidence level of 92%.
Step 11: Interpretation and Conclusion
You can now conclude that with a 92% confidence probability, the actual average revenue of normal customers lies between 351 and 374 euros. This is important for further decisions in your company.
Summary
In this tutorial, you have learned how to calculate a two-sided confidence interval for the average revenue in Excel. You have gone through all the necessary steps, from data preparation to graphical representation and interpretation of the results.
Frequently Asked Questions
What is a two-sided confidence interval?A two-sided confidence interval provides the values within which an estimated parameter, such as the average, lies with a certain level of probability.
How do I calculate the mean in Excel?You can calculate the mean using the formula =AVERAGE(), followed by the cells containing the data.
Why is it important to know the standard deviation?The standard deviation helps to understand the dispersion or variation of the data around the mean, which is crucial for calculating a confidence interval.
How do I find the t-quantile in Excel?The t-quantile can be calculated using the function =T.INV.2T() with the specific alpha level and degrees of freedom.
What role does the confidence level play?The confidence level indicates the probability that the interval contains the true parameter. Higher levels lead to wider intervals.


