The regression analysis is an essential tool for investigating and quantifying the relationships between different variables. In this guide, I will show you how to perform a regression analysis in Excel to model a linear functional relationship between various performance characteristics of a company and its revenue. We are particularly interested in determining which of the characteristics has the strongest impact on revenue. Follow this process step by step with me.
Main Insights
- Performing a regression analysis in Excel to determine relationships between variables.
- Interpreting the goodness of fit of the regression analysis based on the coefficient of determination.
- Evaluating statistical significance using p-values and F-values.
- Calculating the relative importance of independent variables using the beta coefficient.
Step-by-Step Guide
To successfully perform the regression analysis in Excel, follow these steps:
Step 1: Prepare and Insert Data
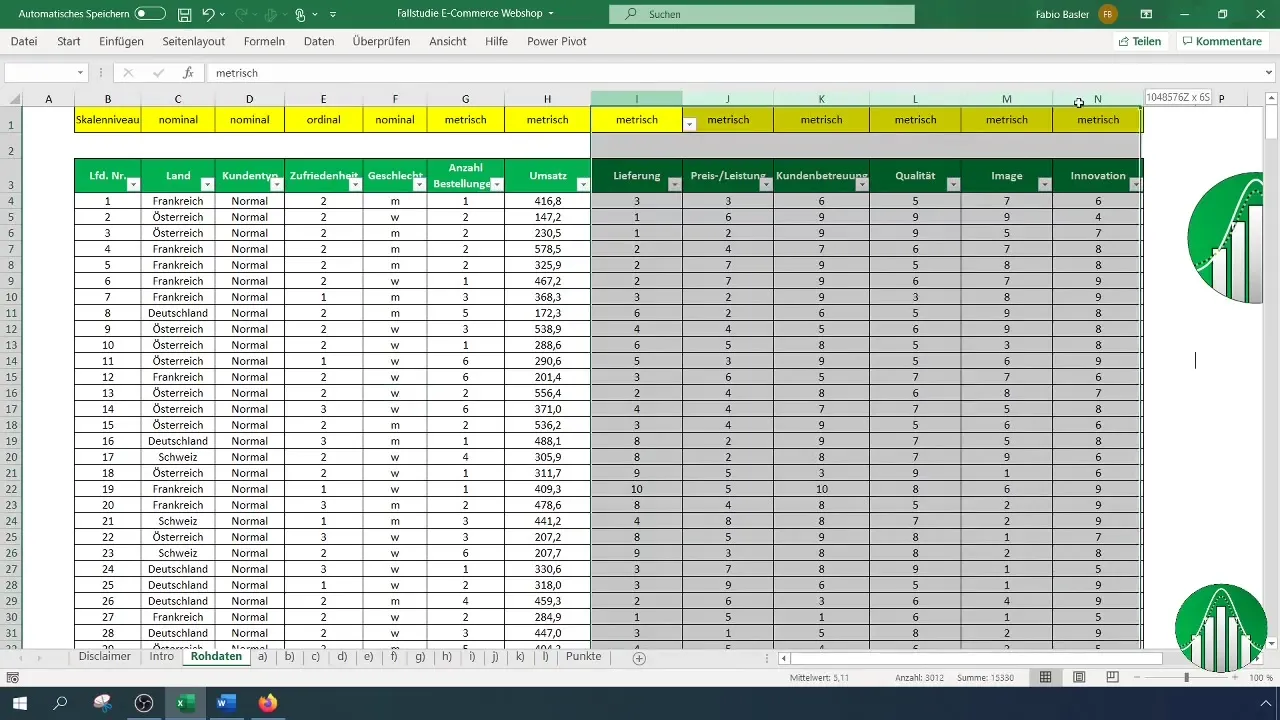
Before conducting the regression analysis, you must enter all relevant data into Excel. This includes the list of performance characteristics (such as delivery, value for money, customer service, etc.) and the revenue you wish to investigate.
Step 2: Select Independent and Dependent Variables
Identify the dependent variable – in this case, revenue – and the independent variables you wish to analyze. Highlight the data for the independent variables (X1 to X6) and the dependent variable.
Step 3: Activate Data Analysis Tool
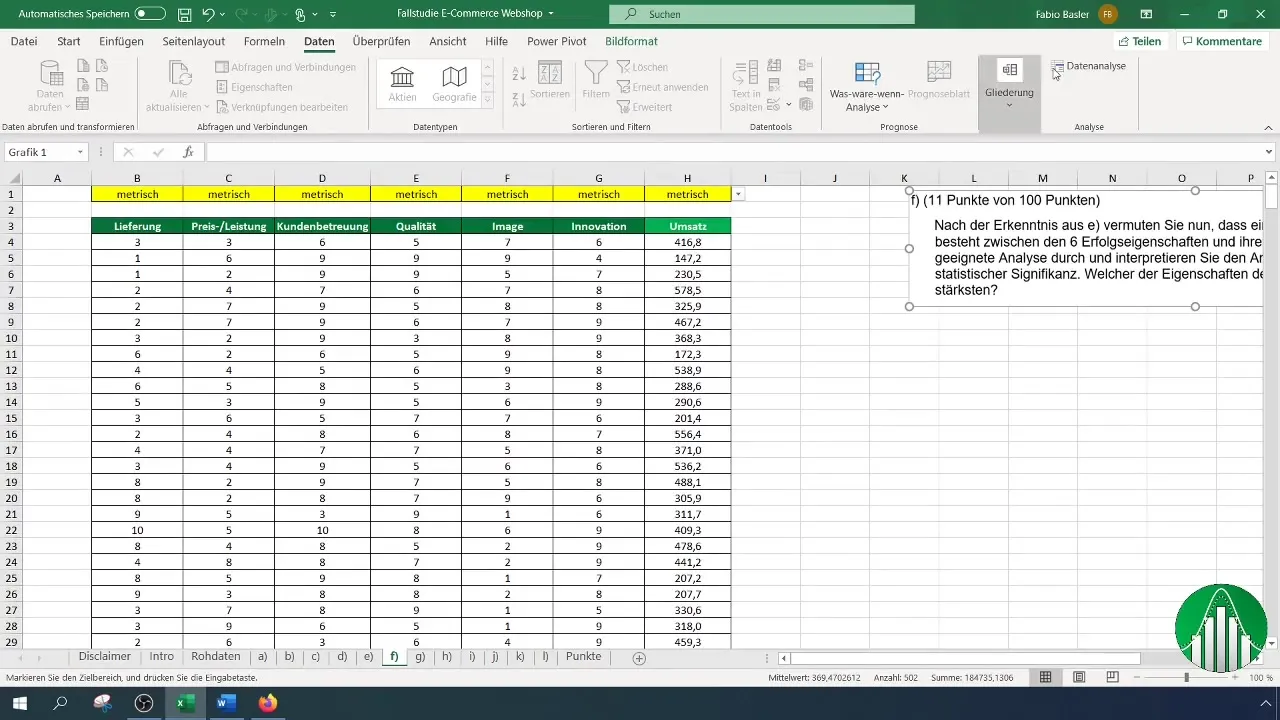
Activate the Data Analysis Tool in Excel from the ribbon. Go to "Data" and look for the "Data Analysis" icon, which provides you with various statistical functions.
Step 4: Choose Regression
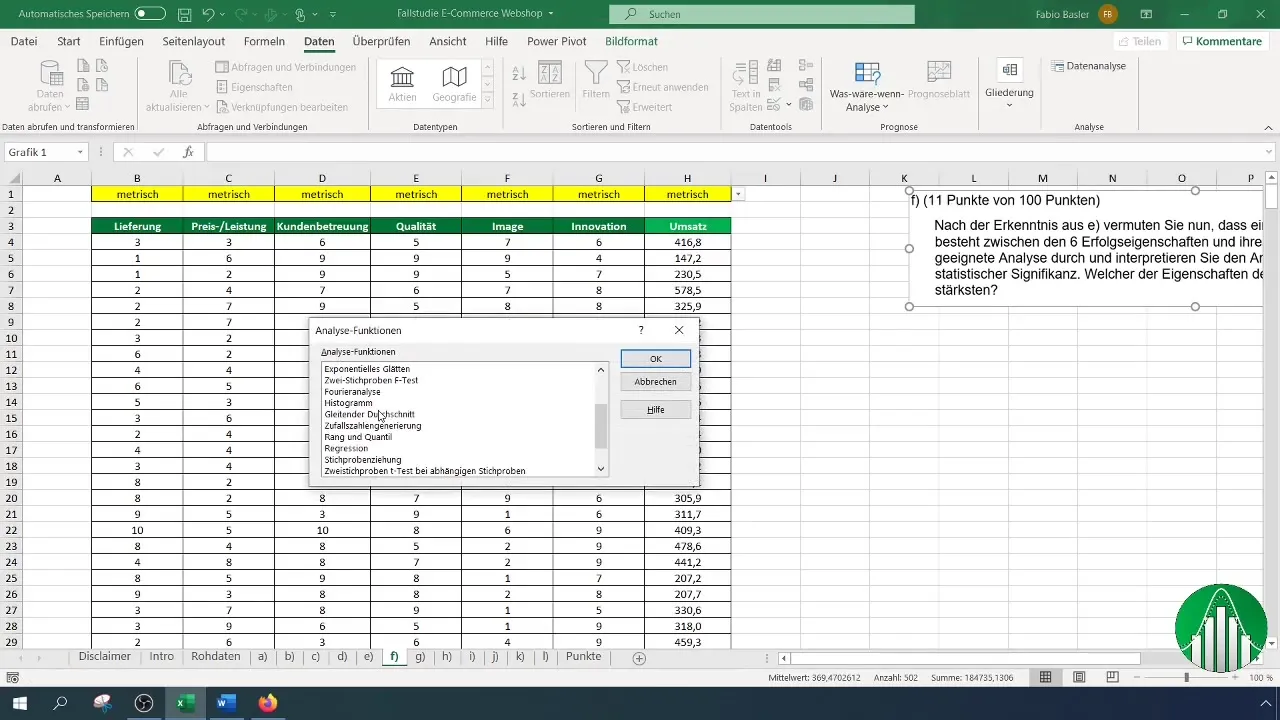
Select the "Regression" option from the list of available analysis tools. This allows you to conduct a regression analysis.
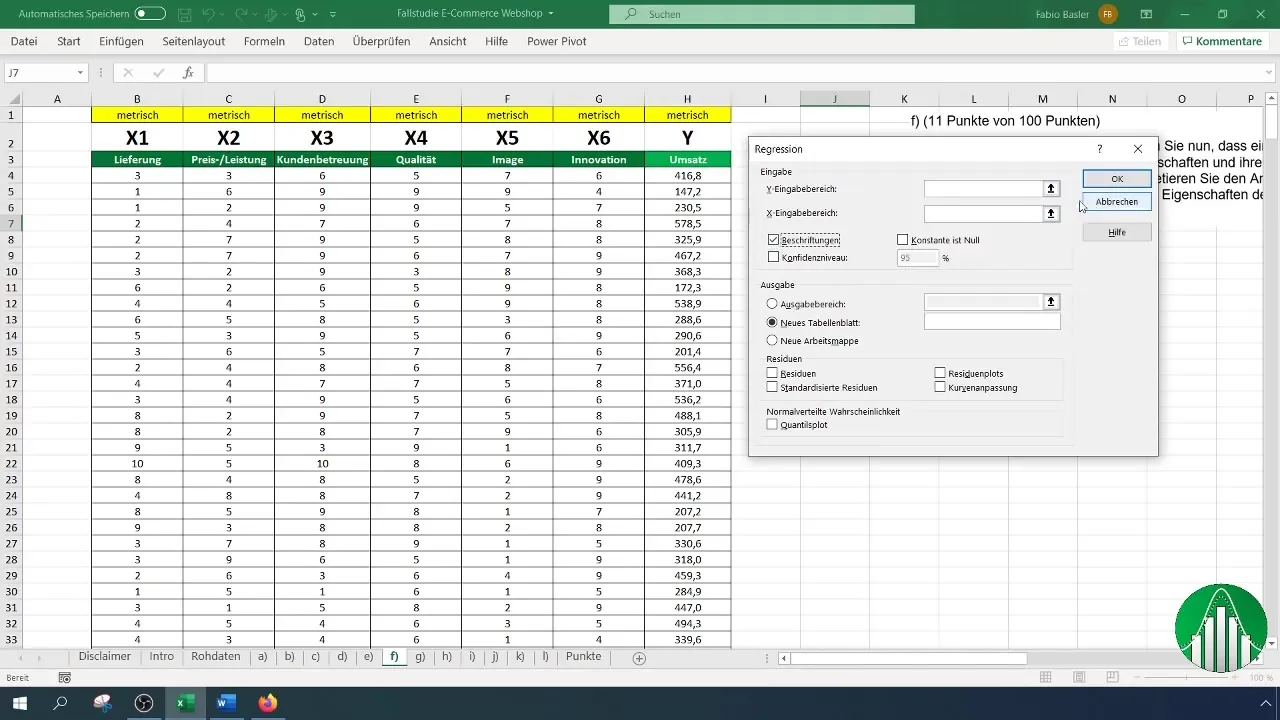
Step 5: Configure Regression Input
In the regression input, select the range for your dependent variable (revenue) and the independent variables (performance characteristics). Make sure to enable labels so that the variables are correctly identified.
Step 6: Define Output Range
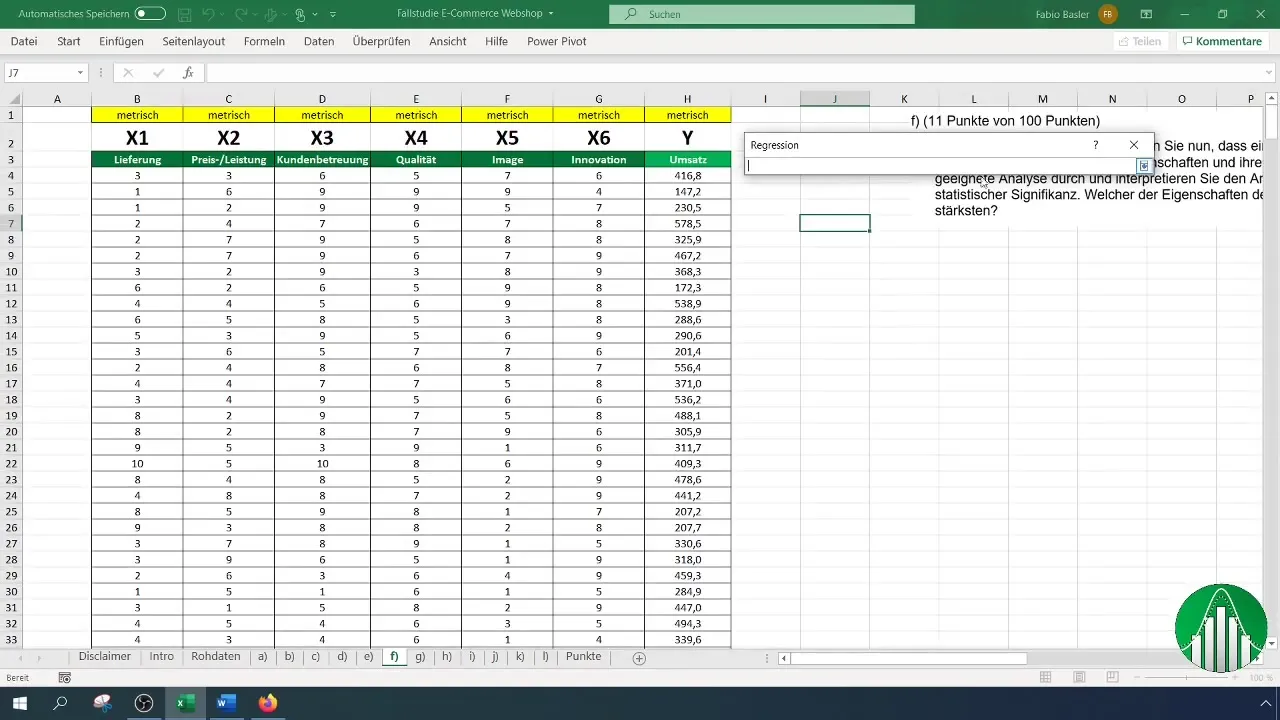
Define the output range where you want to see the results of your analysis. You can place this directly to the right of your dataset to keep the data organized.
Step 7: Verify Confidence Level
Ensure that the confidence level is set to 95%, which is a standard value in most statistical analyses. This relates to the confidence in the results of your analysis.
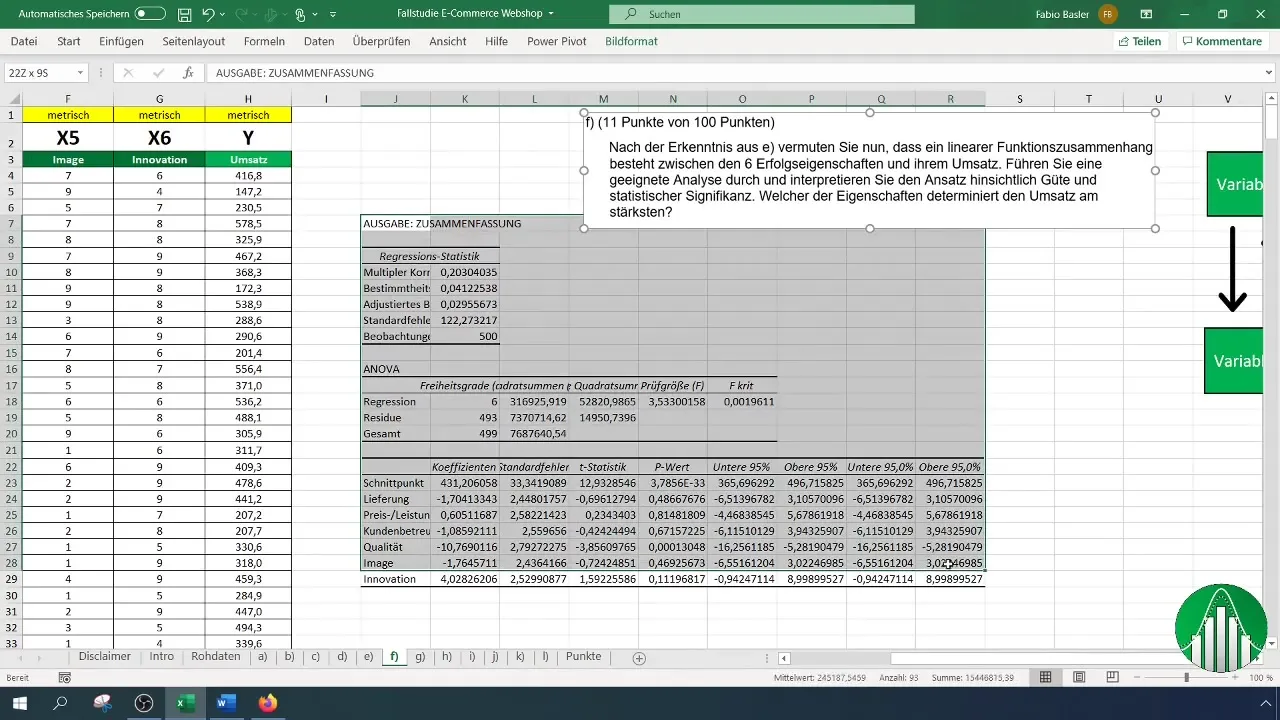
Step 8: Interpret Results
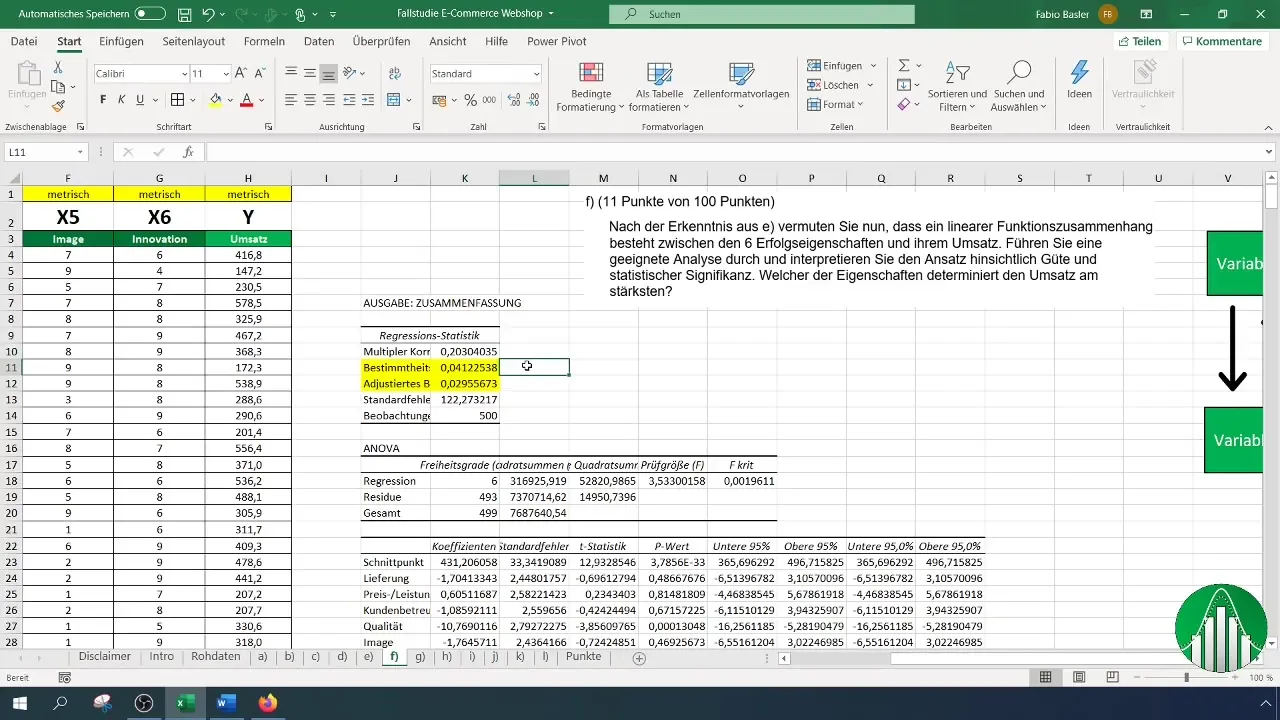
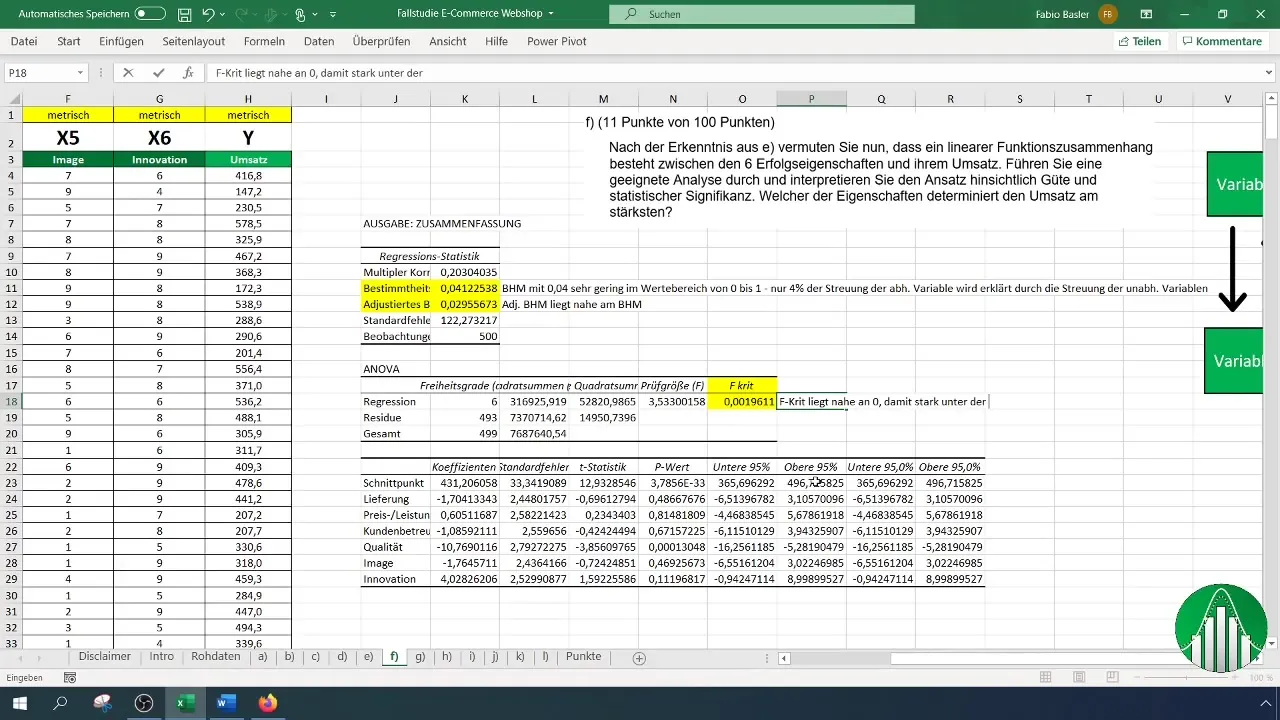
Once the analysis is complete, the results will be displayed in Excel. Begin by interpreting the coefficient of determination (R²), which ranges from 0 to 1. A value of 0.041 indicates that only 4% of the variance in revenue is explained by the independent variables.
Step 9: Evaluate Statistical Significance
Check the p-values and F-value of your analysis. A p-value below 0.05 indicates high statistical significance, meaning that the results are valuable in the context of your hypotheses.
Step 10: Calculate Relative Importance of Variables
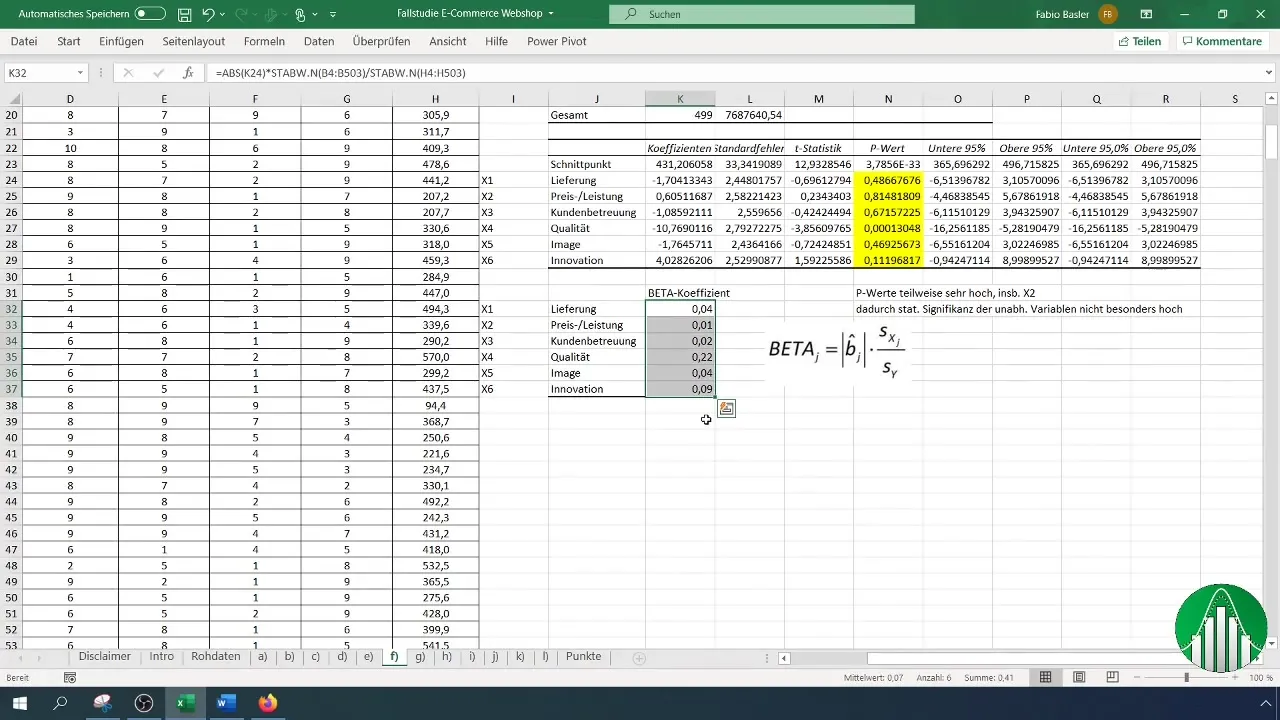
Calculate the beta coefficient for each independent variable. This coefficient indicates how strongly an independent variable influences the dependent variables. Higher values signal a greater relative importance.
Summary
In this guide, you learned how to conduct a regression analysis in Excel. You learned how to prepare your data, perform the analysis, and interpret the results. The insights from this technique are crucial for identifying the factors that influence your company's revenue.
Frequently Asked Questions
What is a regression analysis?A regression analysis is a statistical method to analyze the relationship between a dependent and multiple independent variables.
How do I interpret the p-value?A p-value below 0.05 indicates that the result is statistically significant, meaning that the resulting relationship is not random.
What is the coefficient of determination (R²)?The coefficient of determination is a measure of how well the independent variables explain the variability of the dependent variables.
How do I calculate the beta coefficient?The beta coefficient is calculated by multiplying the coefficient of the variables by their standard deviation and dividing by the standard deviation of the dependent variables.
Where can I find the Data Analysis Tool in Excel?You can find the Data Analysis Tool under the "Data" menu in the top menu bar of Excel.


