Working with charts in Excel is not just about creating them. An essential aspect is the efficient management, customization, and formatting of these charts to present them in the best possible way. In this guide, you will learn how to effectively manage your charts in Excel. Let's go through the different steps to ensure that your charts not only look good but also clearly communicate the desired information.
Key Takeaways
- Adjusting the chart size
- Utilizing formatting options
- Grouping multiple charts
- Effective handling of chart selection
Adjusting the Chart Size
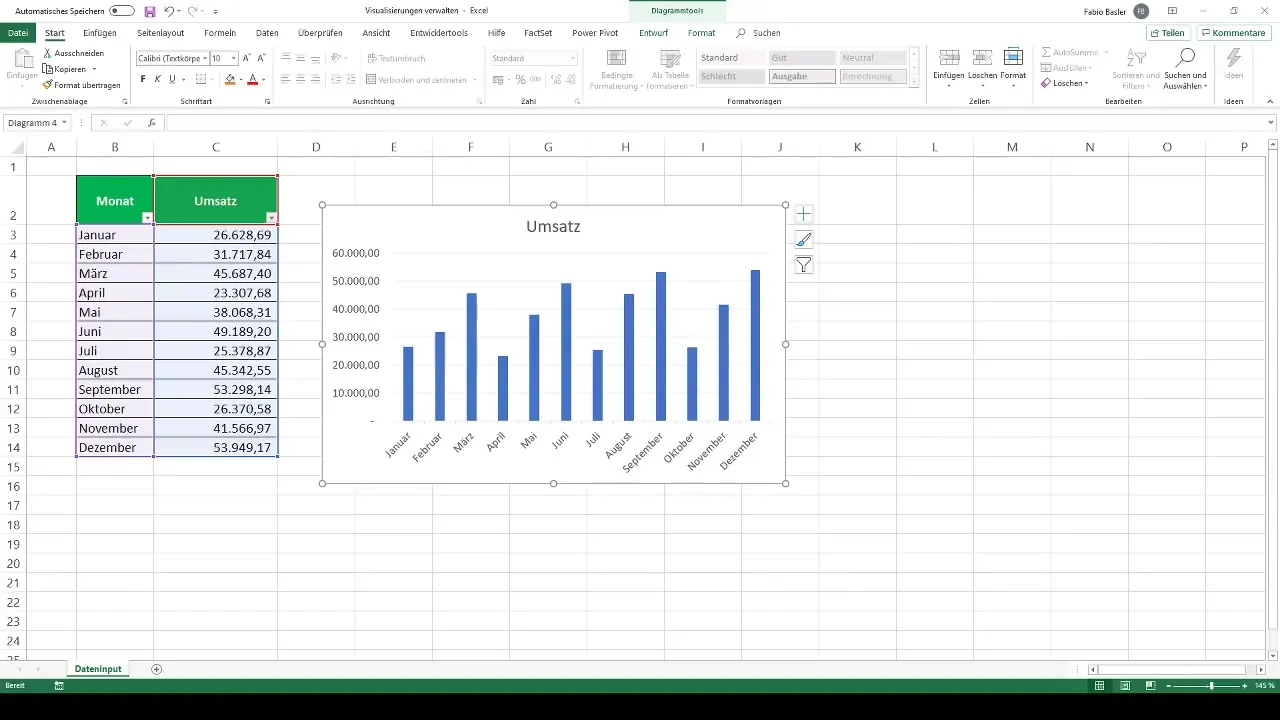
First, let's look at how you can adjust the size of your chart. Have you already created a chart, such as a bar chart? It's important to change the dimensions proportionally to ensure that the chart fits within the available space.
To adjust the size, you can drag the corners or sides of the chart. Make sure to hold down the Shift key while resizing. This way, the aspect ratio remains the same, and the chart looks appealing. If you want to position the chart in a specific location, you can also adjust the position.

Furthermore, there is the option to change the size through formatting options. Right-click on the chart and choose "Format Chart Area." There, you can manually enter the height and width of the chart.
Utilizing Formatting Options
After adjusting your chart's size, it's time for formatting. A classic step is changing the background color. Again, go to the formatting options, and you will find a set of tools to change the fills for different parts of your chart.
Here, you can decide whether your chart should have a uniform fill color, a pattern, or no fill at all. You can also adjust the chart's border and choose different line styles or colors.

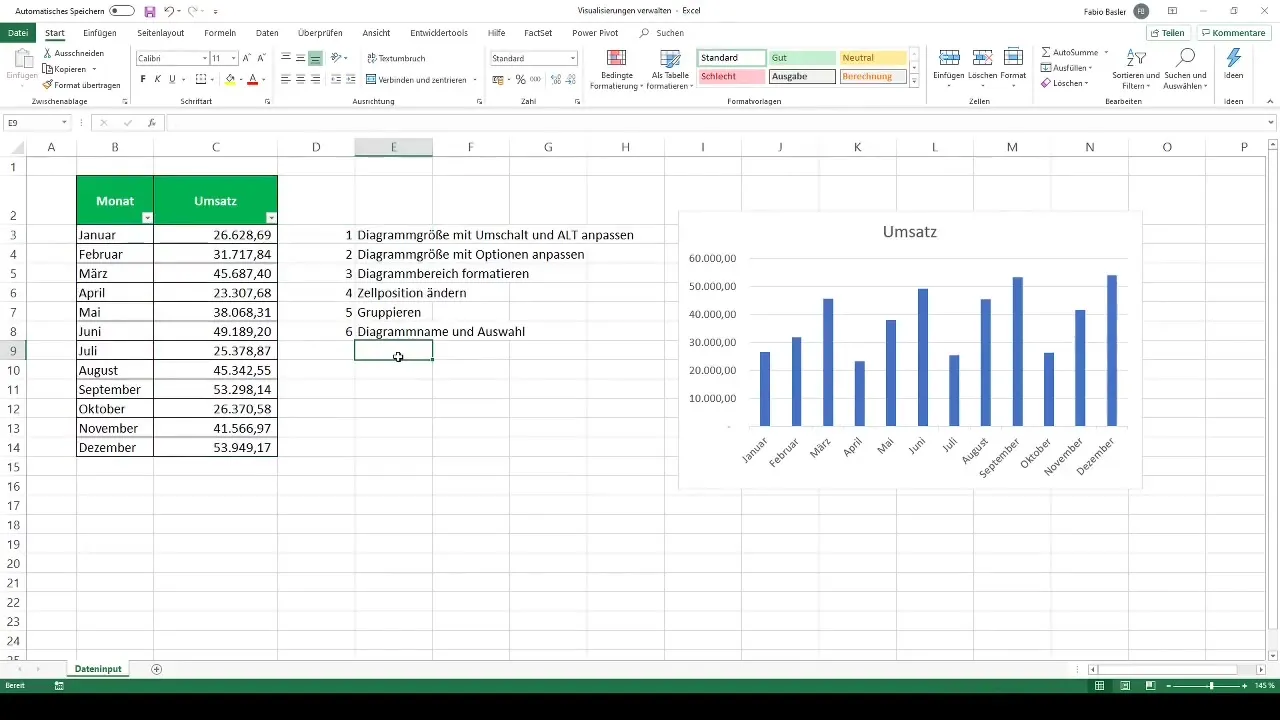
An interesting function is adjusting the properties of the charts, such as size and cell position. By default, charts in Excel are often bound to the cells where they were created. This means that if you make cells narrower or change their contents, the chart will be proportionally adjusted or moved.
To change this function, go to the size adjustment options and select the setting that allows you to position the chart independently of the cells.

Grouping Charts
If you have multiple charts that are related, it is helpful to group them. This way, they will retain uniform changes and be viewed as a single unit. To group charts, select the first chart and hold the Control key while clicking on the second chart.
Right-click and select "Group." Now, both charts are grouped together and can be moved or edited together.
Naming and Selecting Charts
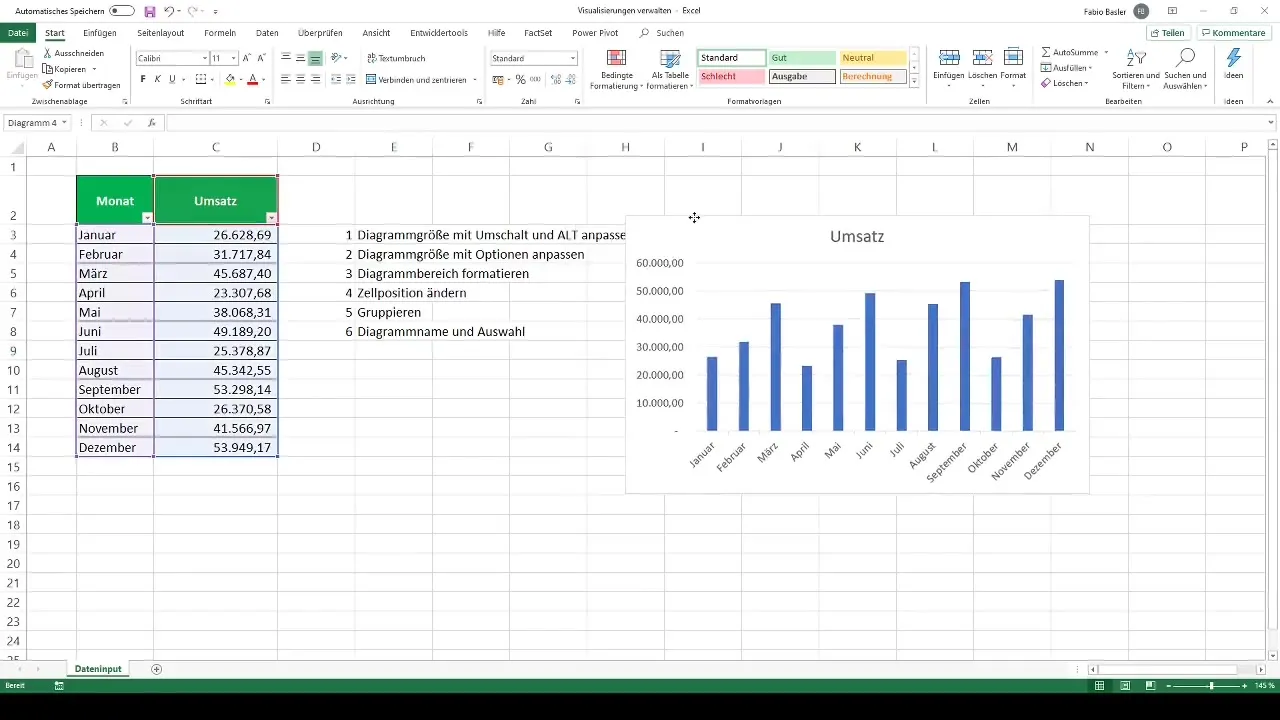
Another useful function is the ability to name charts meaningfully. Click on the chart to select the chart name on the top left. Through the Format menu, you can change the name, which is particularly helpful when working with multiple charts.
To select a specific chart, the selection pane in Excel is very useful. Through the Format menu, you can open the selection pane and choose the individual charts. This makes it easy to switch between different charts and make adjustments.
Summary
In this guide, you have now learned how to manage charts in Excel. Starting from adjusting their size, utilizing formatting options, to grouping and selection features. Each of these elements contributes to making your charts look professional and clearly communicate what you want to represent.
Frequently Asked Questions
How do I adjust the size of a chart in Excel?You can drag the corners of the chart while holding down the Shift key to maintain the aspect ratio.
How do I change the background color of a chart?Right-click on the chart and select "Format Chart Area" to change the fill.
How do I group multiple charts?Select the charts while holding the Control key, then right-click and choose "Group".
How do I name a chart in Excel?Click on the chart and change the name in the Format menu at the top left.
What do I do if the chart moves when changing cells?Change the size adjustment settings to keep the chart position independent of the cells.


