Statistical calculations are an essential part of data analysis, especially in an E-commerce environment. Historical data analysis enables determining probabilities that are crucial for businesses. In this guide, you will learn how to calculate probabilities using the Poisson distribution in Excel, based on a case study of a survey.
Main takeaways: The Poisson distribution allows determining the probability of events occurring within a fixed time frame. In this example, you will calculate the probability of more than two but up to four customers making a purchase in an E-commerce shop within an hour, as well as the probability of more than two customers making a purchase overall.
Step-by-step guide
Let's start by calculating the probabilities for the described events.
Step 1: Understand basics of the Poisson distribution
First and foremost, it is important that you understand what the Poisson distribution is. This discrete probability distribution is used to quantify the number of events in fixed time periods. In the current example, we have an average of five purchases per hour. You express this as a lambda value (λ = 5).
Step 2: Prepare data in Excel
Open Excel and prepare a new table. Ensure that you have the relevant parameters (Lambda and the number of desired events) clearly visible.
Step 3: Determine probabilities for customer purchases
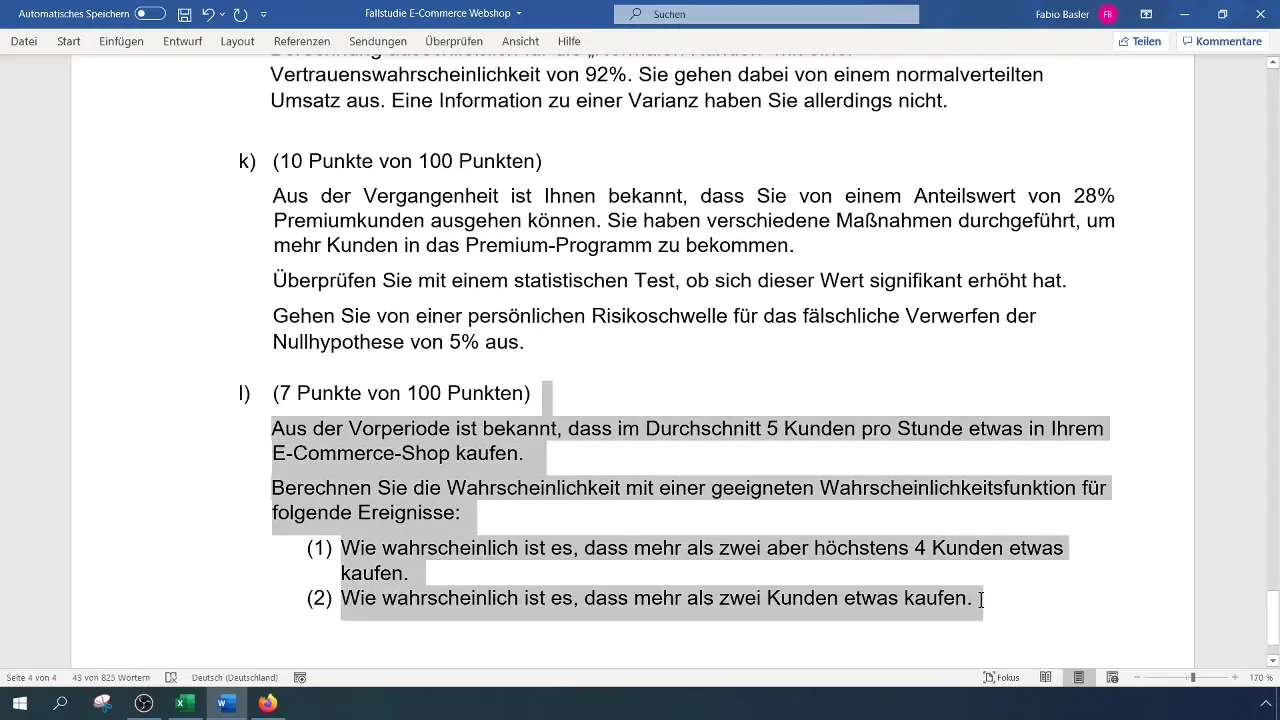
For the first scenario, you want to calculate the probability of more than two but up to four customers making a purchase. To do this, you need to calculate the probabilities for two and four customers, then determine their difference.
Step 4: Use Excel formula for the Poisson distribution
Use the function POISSON.WAHRSCHEINLICHKEIT to calculate the probabilities. The formula is as follows:
- For two buyers: =POISSON.WAHRSCHEINLICHKEIT(2; 5; TRUE).
- For four buyers: =POISSON.WAHRSCHEINLICHKEIT(4; 5; TRUE).
Step 5: Interpret results
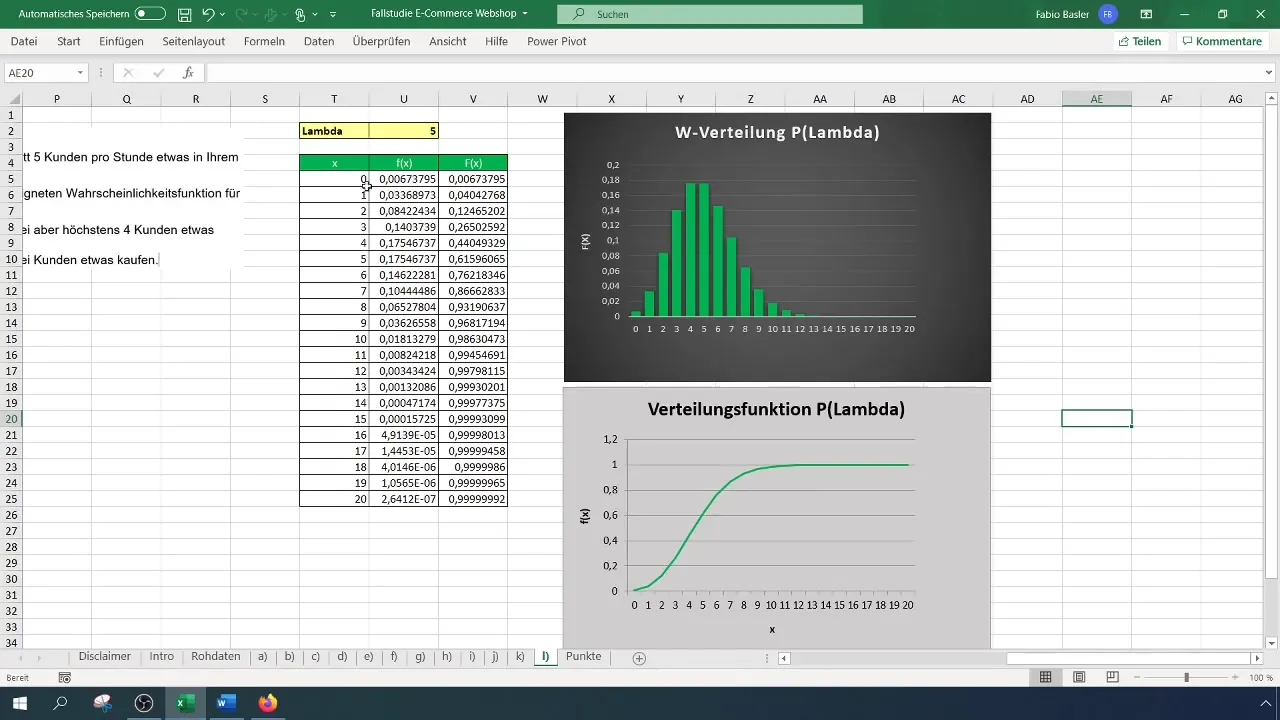
After applying the formulas, you will obtain two probabilities, for example, 12% for two customers and 44% for four customers. Subtracting the probability for two buyers from that for four buyers gives you a probability of 32% that more than two but up to four customers will make a purchase.
Step 6: Calculate additional probabilities
Now, you need to calculate the probability that more than two customers will make a purchase in your E-commerce shop. To do this, first calculate the probability for exactly two buyers and subtract this result from 1.
Step 7: Use Excel formula for more than two buyers
The Excel formula is: =1 - POISSON.WAHRSCHEINLICHKEIT(2; 5; TRUE). This gives you the probability that more than two customers will make a purchase, which in this case is 88%.
Step 8: Summary of results
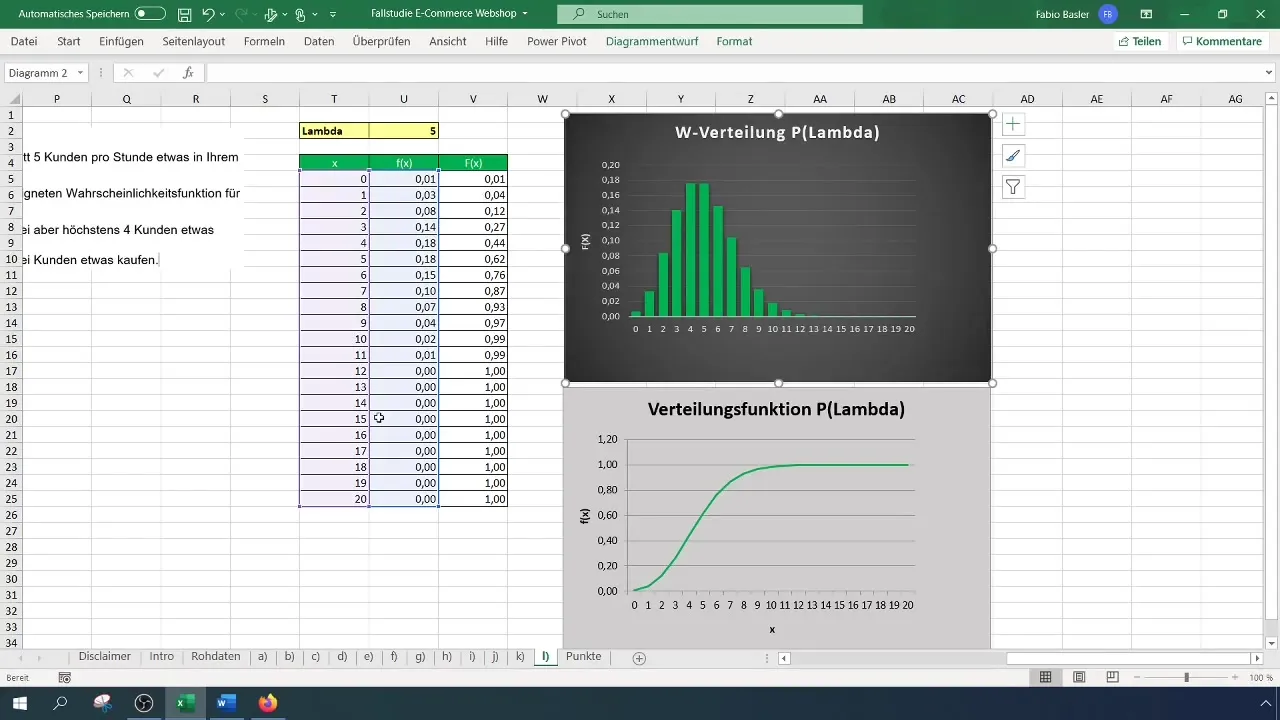
After completing all calculations, note down the key probabilities. You have found that the probability of more than two but up to four customers ordering is 32%, while the probability of more than two customers making a purchase overall is 88%.
Summary
In this guide, you have learned how to use the Poisson distribution to calculate probabilities in Excel. You have gone through steps to calculate and interpret probabilities for specific events.
Frequently Asked Questions
What is the Poisson distribution?The Poisson distribution is a discrete probability distribution that indicates how many times an event occurs within a fixed time period.
How do I calculate probabilities with the Poisson distribution in Excel?You use the function POISSON.WAHRSCHEINLICHKEIT to calculate probabilities for different values.
What does a lambda value of 5 mean?A lambda value of 5 means that on average five events (e.g., purchases) occur in the defined time span (e.g., an hour).
What values do I need to specify for the Poisson distribution?You need to specify the number of desired events (x), the mean (λ), and whether you want to calculate cumulative probabilities.
Why is the Poisson distribution important for E-commerce?The Poisson distribution helps analyze purchase patterns and predict the probability of customer activities, which can support important decisions in marketing and inventory management.


