In the field of data analysis, it is crucial to make informed decisions based on statistical hypothesis tests. This guide shows you how to perform a one-sided hypothesis test for the proportion in Excel. Using the example of a survey analyzing the proportion of premium customers, you will learn how to perform crucial statistical calculations in Excel and efficiently apply these insights.
Key Findings
- Calculating a one-sided proportion value is done by targeted formulas in Excel.
- Hypothesis tests allow you to statistically verify the validity of assumptions.
- It is important to correctly formulate the null hypothesis and the alternative hypothesis in order to draw the right conclusions.
Step-by-Step Guide
Analyze the Initial Situation
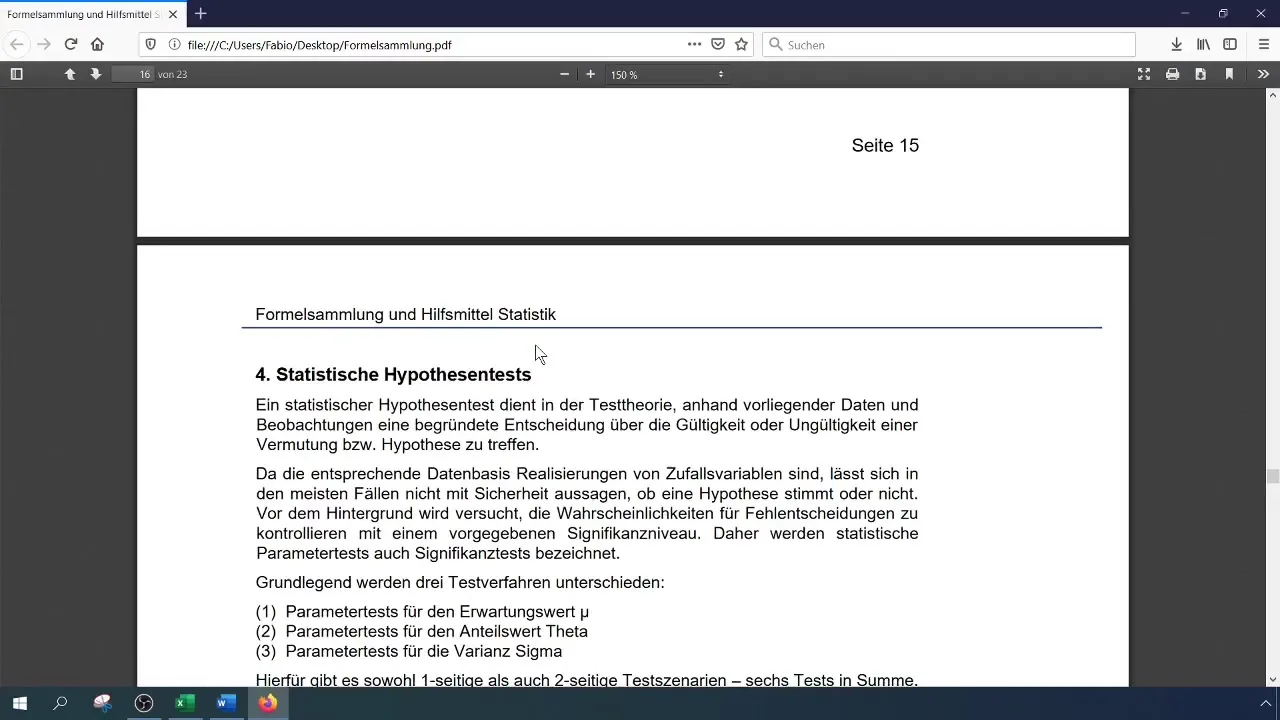
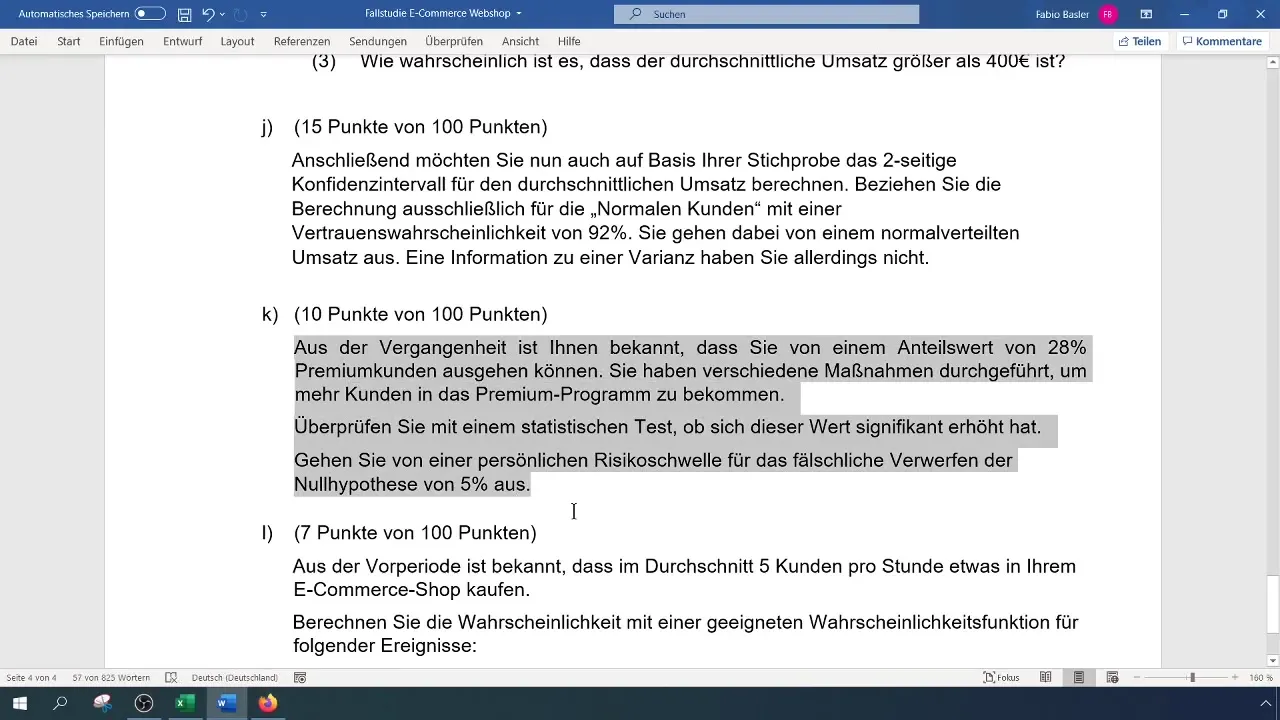
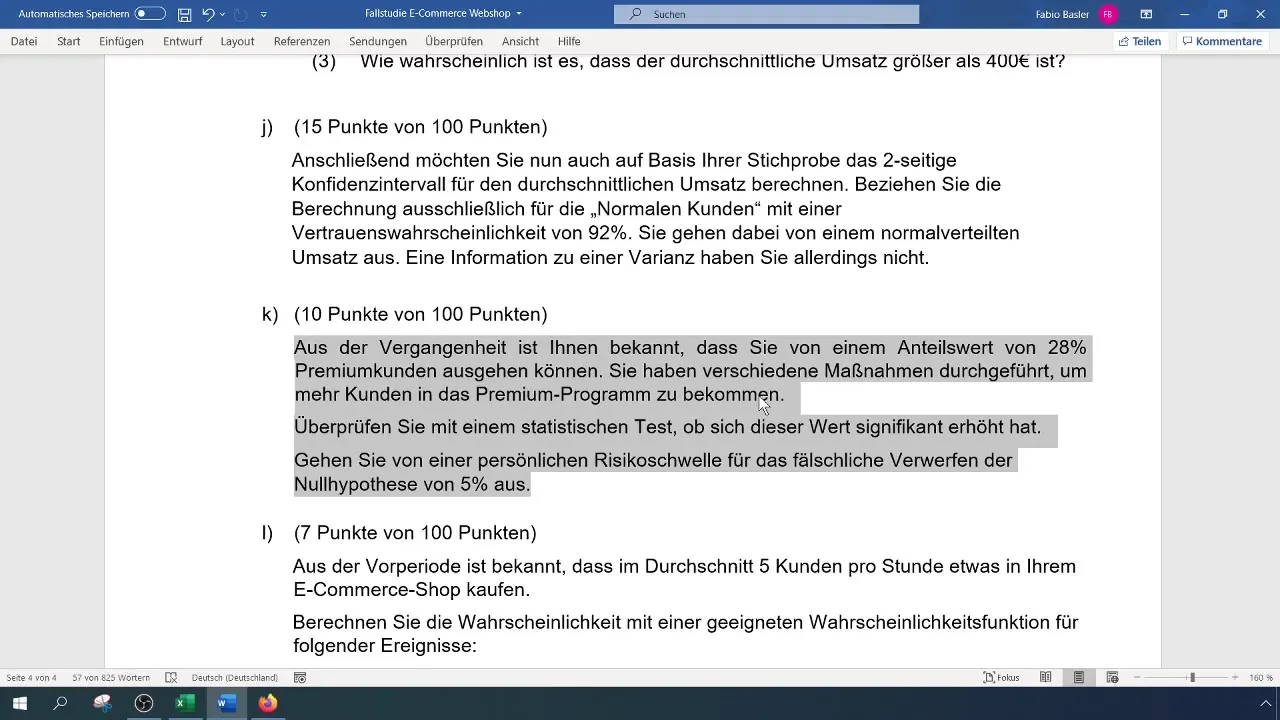
At the beginning of the test, you must clarify the initial situation. Your survey revealed that the proportion of premium customers is 28%. You want to find out if this value has significantly increased after various customer acquisition measures have been taken. Start by reading the task description from the source.

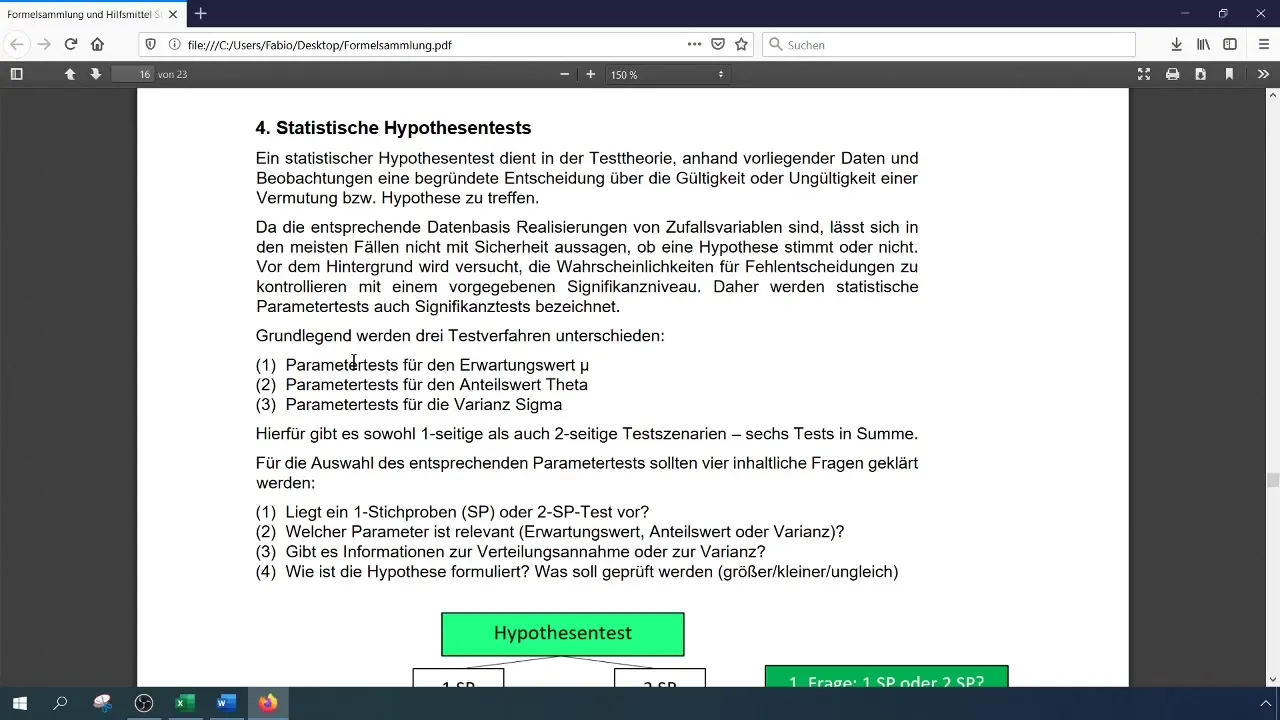
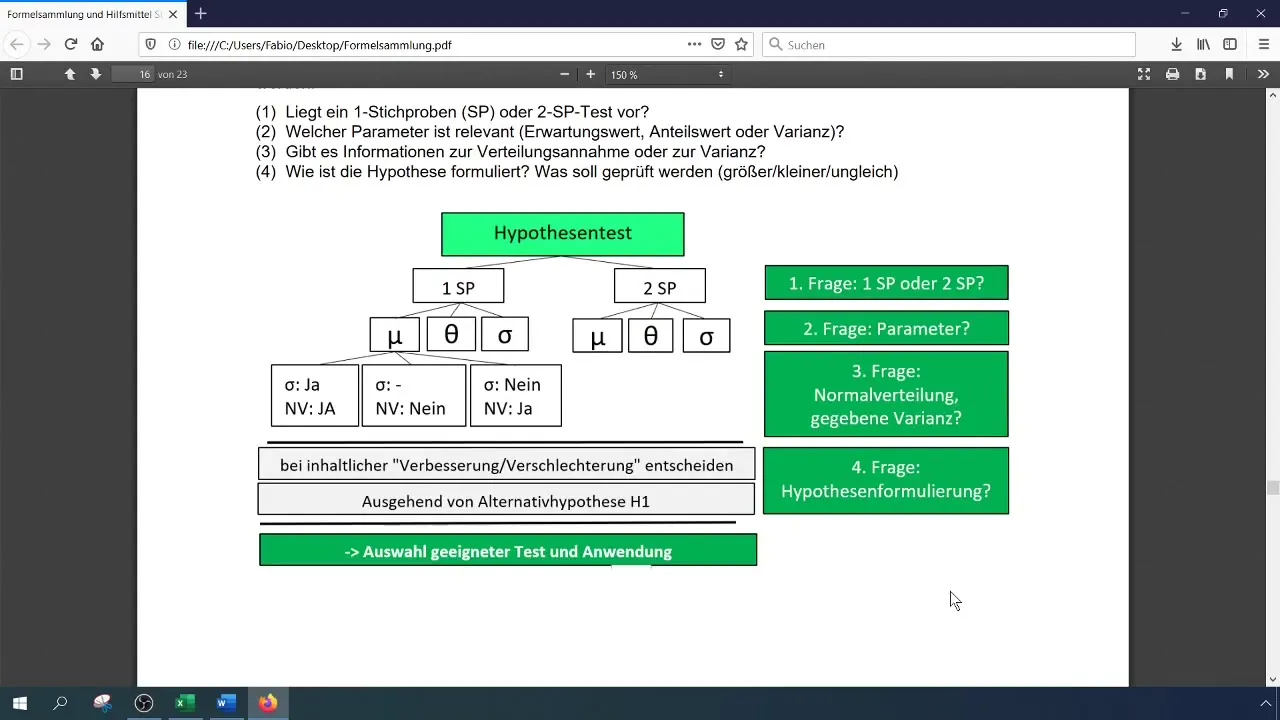
Introduce the Hypothesis Test
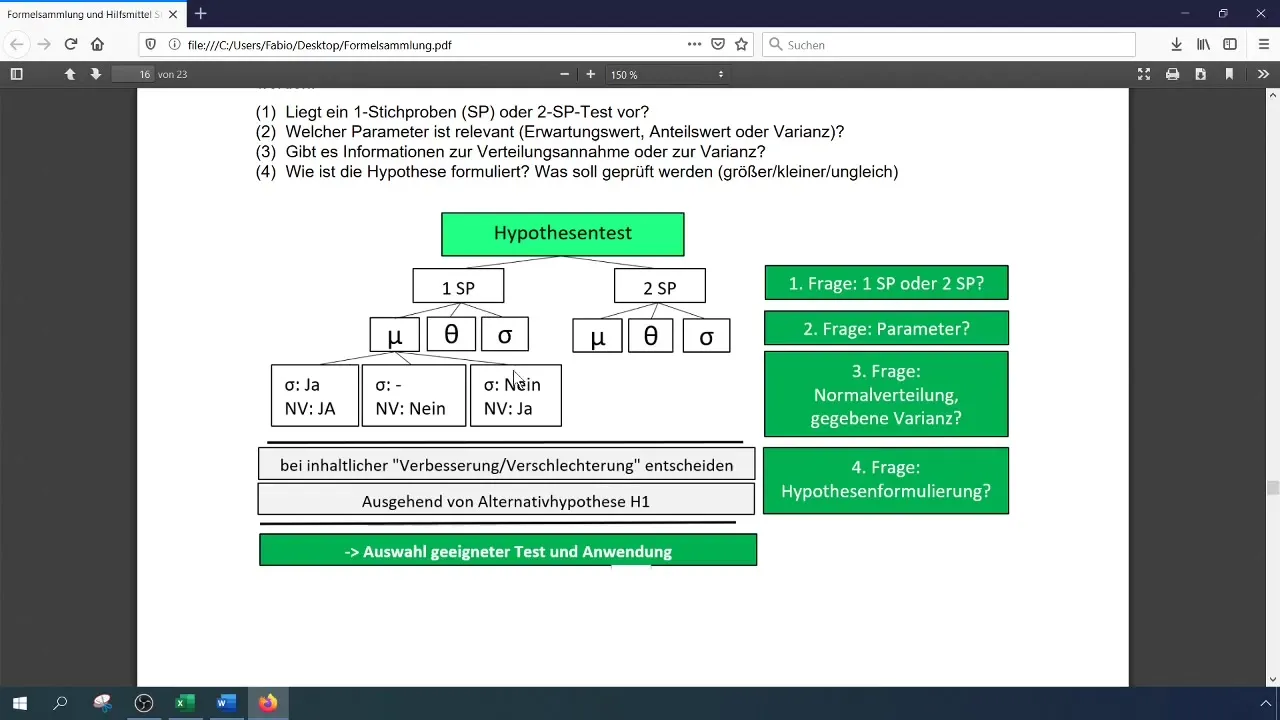
A statistical hypothesis test allows you to make decisions about the validity of a hypothesis. You will formulate the null hypothesis (H0) and the alternative hypothesis (H1). Traditionally, the null hypothesis is formulated to show that the current proportion value remains 0.28, while H1 indicates that this value has increased.
Clarify Formulations and Parameters
It is essential to clearly define the hypothesis:
- H0: θ ≤ 0.28
- H1: θ > 0.28 With this approach, you can clearly define what you want to test.
Prepare the Raw Data
Before starting the calculations, the raw data must be processed. Make sure that no filters are applied to the data. Remove any filters to ensure that all data is captured.
Count Premium Customers
Now it's time to count the number of premium customers. This can be done using the "COUNTIF" function in Excel. To use this formula, define a criteria range and your criterion, namely the "Premium" type.
Enter Sample Numbers
After counting the premium customers and obtaining the value of 164, you can calculate what proportion this is of the total number of customers (500).
Calculate the Test Statistic
Calculate the standard error of the hypothesis. Use the approach you learned earlier to obtain the standard deviation.
Test Hypotheses
Now the exciting part comes. You need to compare the computer-generated test numbers. Use a normal distribution table and determine the critical value. In this case, the critical value for 5% is 1.64.
Comparisons and Decisions
Now compare the test statistic with the critical value. If the test statistic is greater than the quantile value, then you can reject the null hypothesis. A result of 2.39 is greater than 1.64, which means that the premium customers have significantly increased.
Final Checking of the Result
In summary, your test shows that the proportion of premium customers has not only increased in the sample, but the results can also be extrapolated to the population at large.
Summary
In this guide, you have learned how to perform a one-sided hypothesis test for the proportion value using Excel. The entire methodology trains you in formulating hypotheses, calculating test statistics, and interpreting results. Make sure to always interpret upcoming tests according to the customer's and data's specifics.
Frequently Asked Questions
Where can I find the critical value in the normal distribution?The critical value can be looked up in a standard normal distribution table.
What happens if the test statistic is less than the critical value?In this case, you cannot reject the null hypothesis, which means that the hypothesis can be refuted.


