The Camera feature in Excel is an often overlooked yet powerful tool that helps you visually represent information and make reports more appealing. This guide shows you how to effectively use the Camera feature in your Excel workbooks to easily and quickly visualize data. From creating charts to inserting into reports – the possibilities are diverse.
Key Takeaways
- The Camera feature allows you to insert screenshots of cell ranges as graphics into reports.
- You can activate the Camera through the Quick Access Toolbar.
- The captured images are dynamic and update automatically when changes are made to the source data.
Step-by-Step Guide
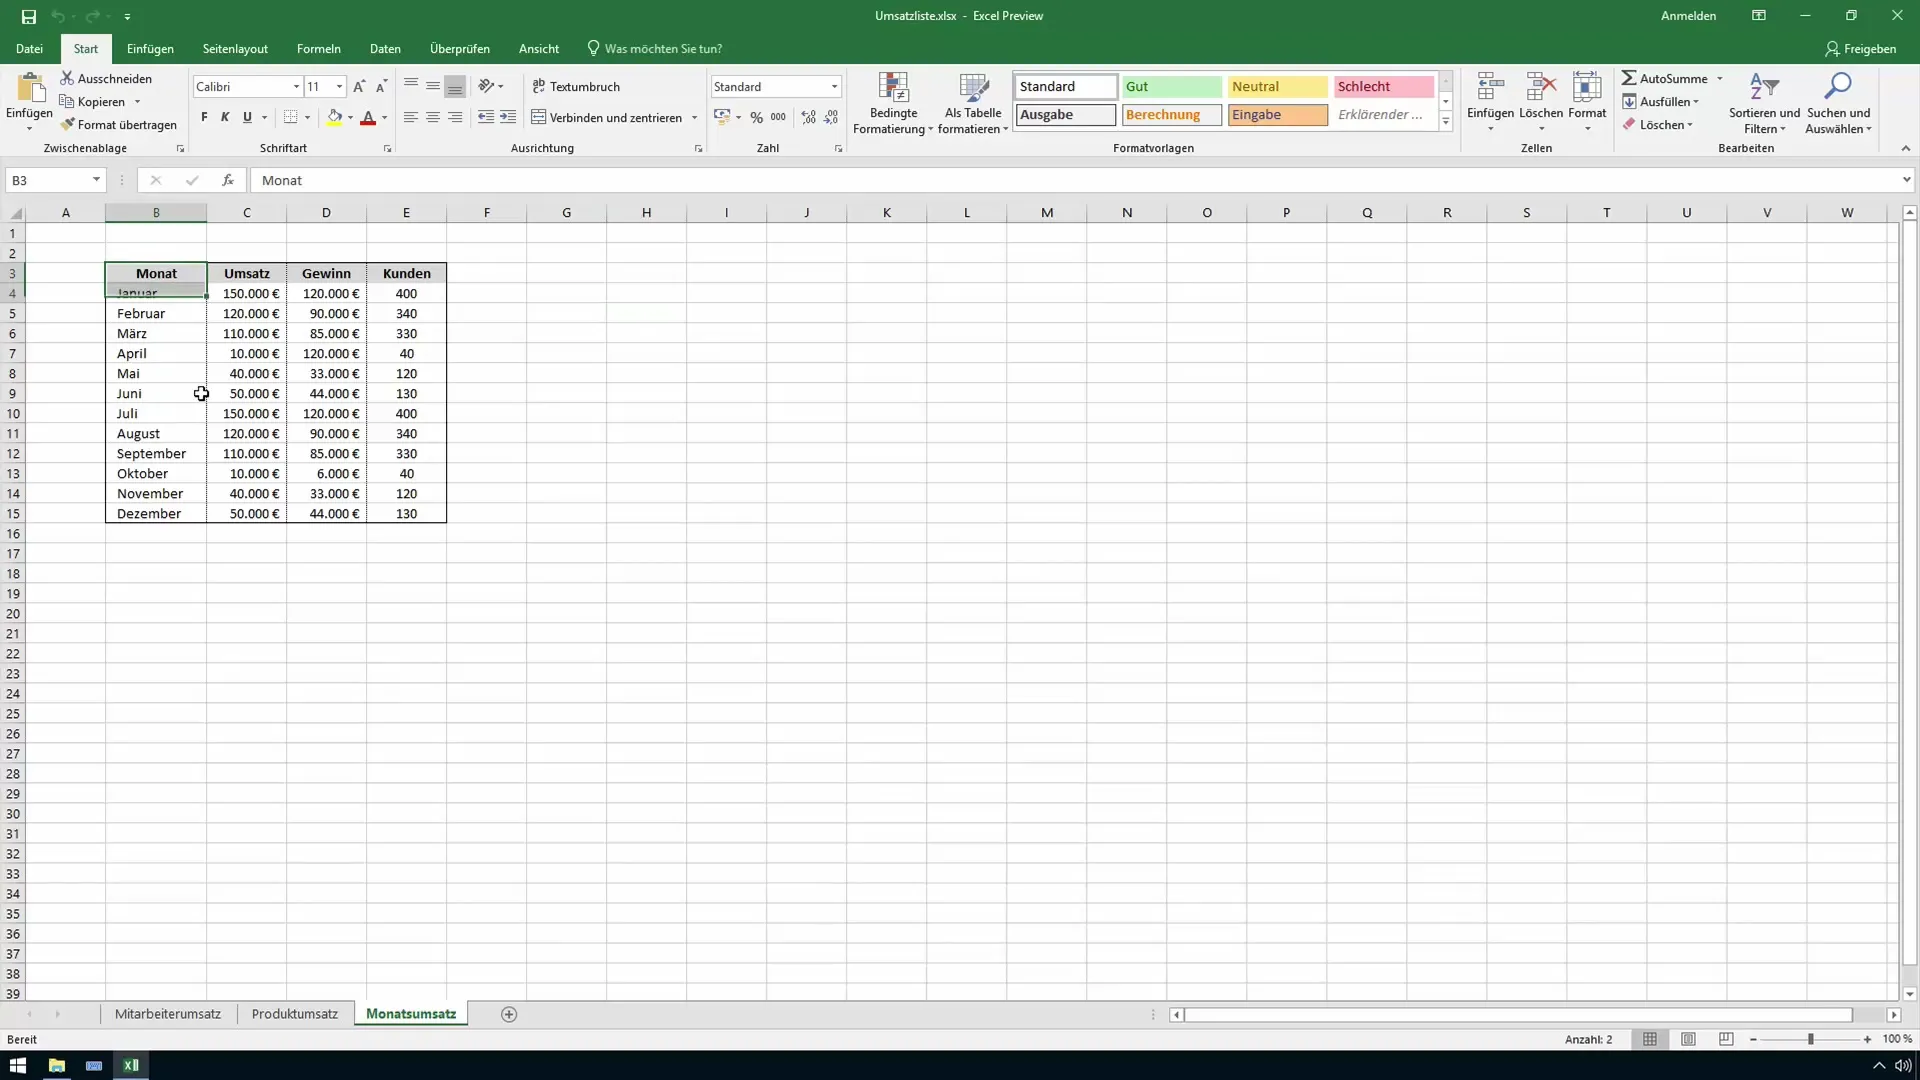
Start by opening the saleslist.xlsx file. First, create a small SmartArt graphic from the various sales. Navigate to the area in the file where your sales data is located.
To create a graphic, select an appropriate chart, such as a column chart. After some adjustments, you will have your sales chart, which you can name accordingly.
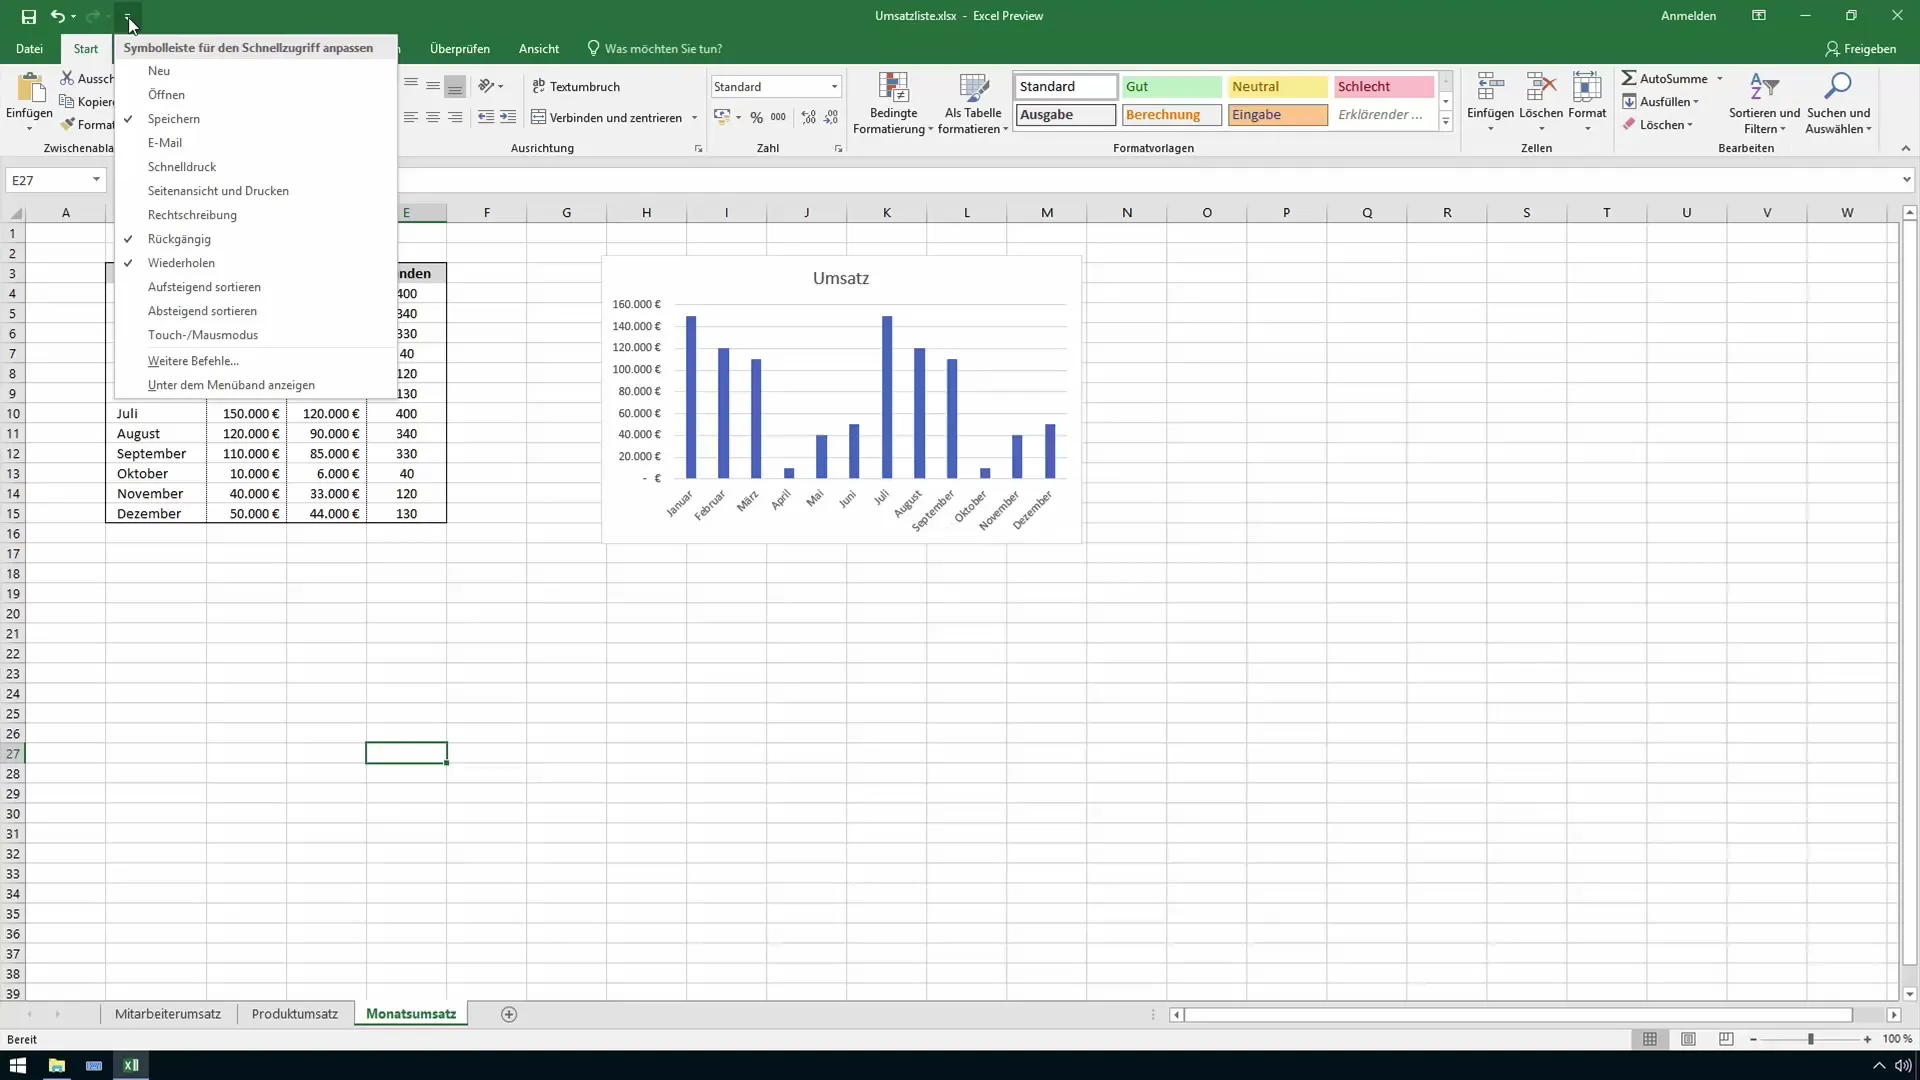
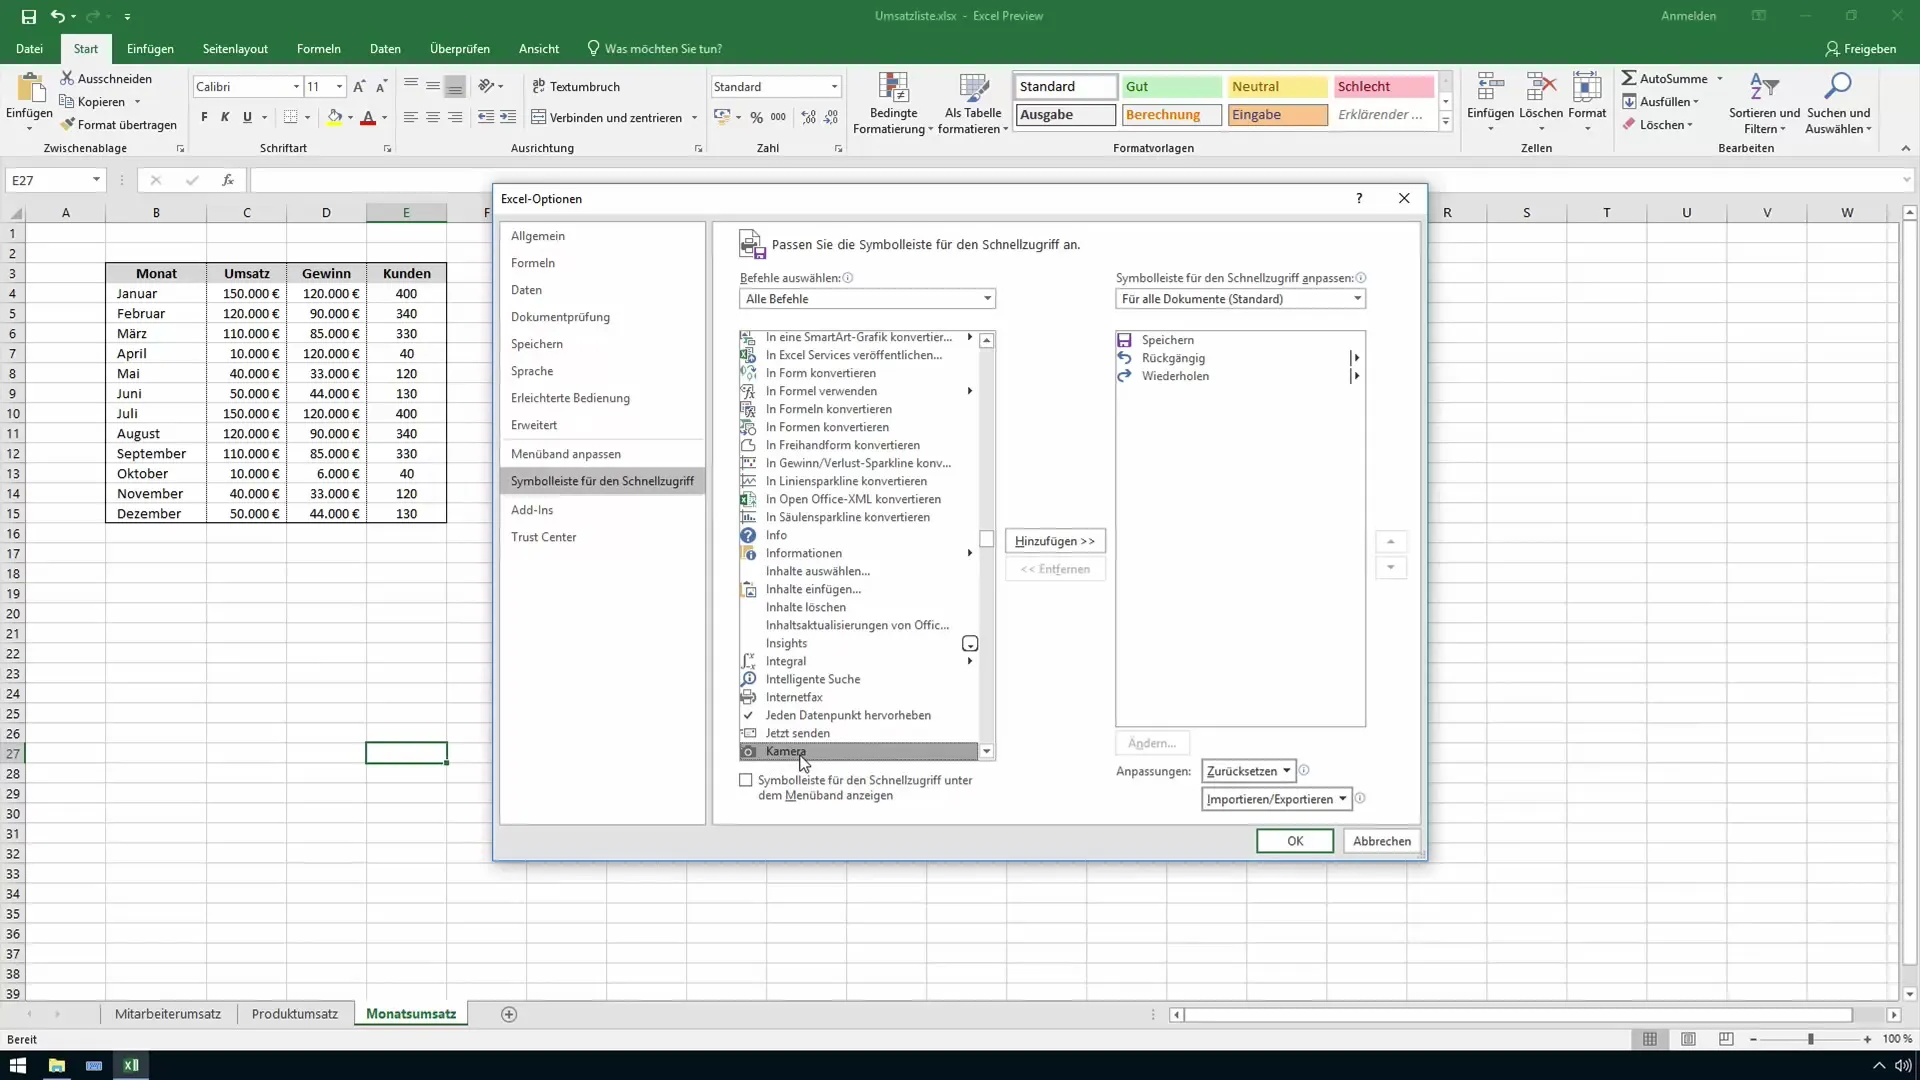
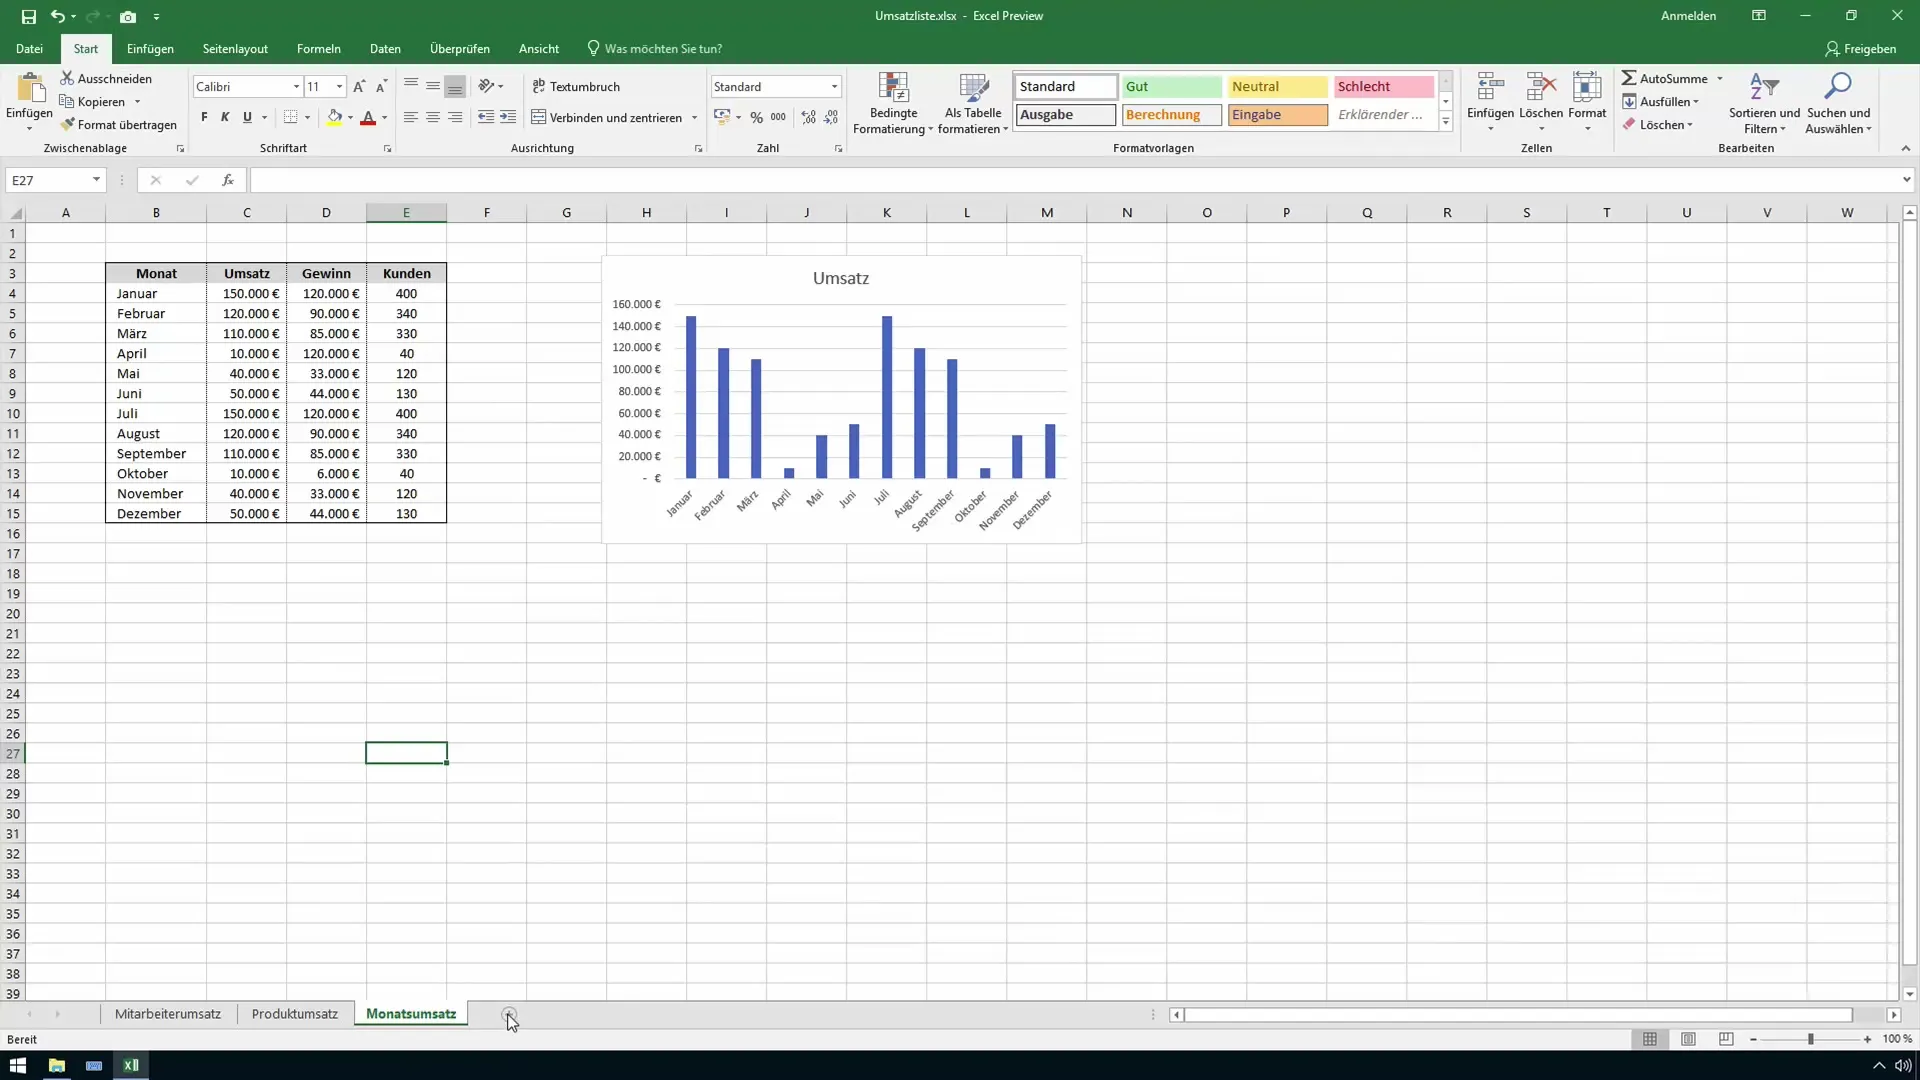
Now switch to the Quick Access Toolbar and search for the Camera feature. Click on "All Commands". There, select the Camera and add it to your Quick Access Toolbar.
With the Camera, you can now create a new table called "Report Table". In this table, you can record various sales, such as employee sales or product sales, and work with the Camera.
To use the Camera, highlight the desired range. By clicking on the camera icon, this range will be prepared as a screenshot.
Your cursor will change to a crosshair. Click where you want to insert the screenshot in your report table. Once the screenshot is in the desired location, it may take a few seconds to appear.
If an error message appears in the clipboard, this is a known issue that can occur in Excel 2019. Nevertheless, the screenshot should now appear correctly in your table.
If you wish, you can also add product sales to your report table. Personalize the colors of the charts to achieve more appealing layouts.
Once you are done with the color design, you can insert the chart by selecting the camera icon again and returning to the report. The chart can now be edited just like any other graphic.
Click and drag the inserted graphic to position it where desired. It can also be rotated or resized.
If you want to insert graphics from an original chart, note that the Camera function only works on the cell level. The temporary camera image does not work on graphics like charts.
This means that for necessary adjustments, you must border the cells. For example, you could select a specific cell and create a screenshot with the camera icon.
Now you can work with the linked data. If your data changes, the screenshot will update automatically.
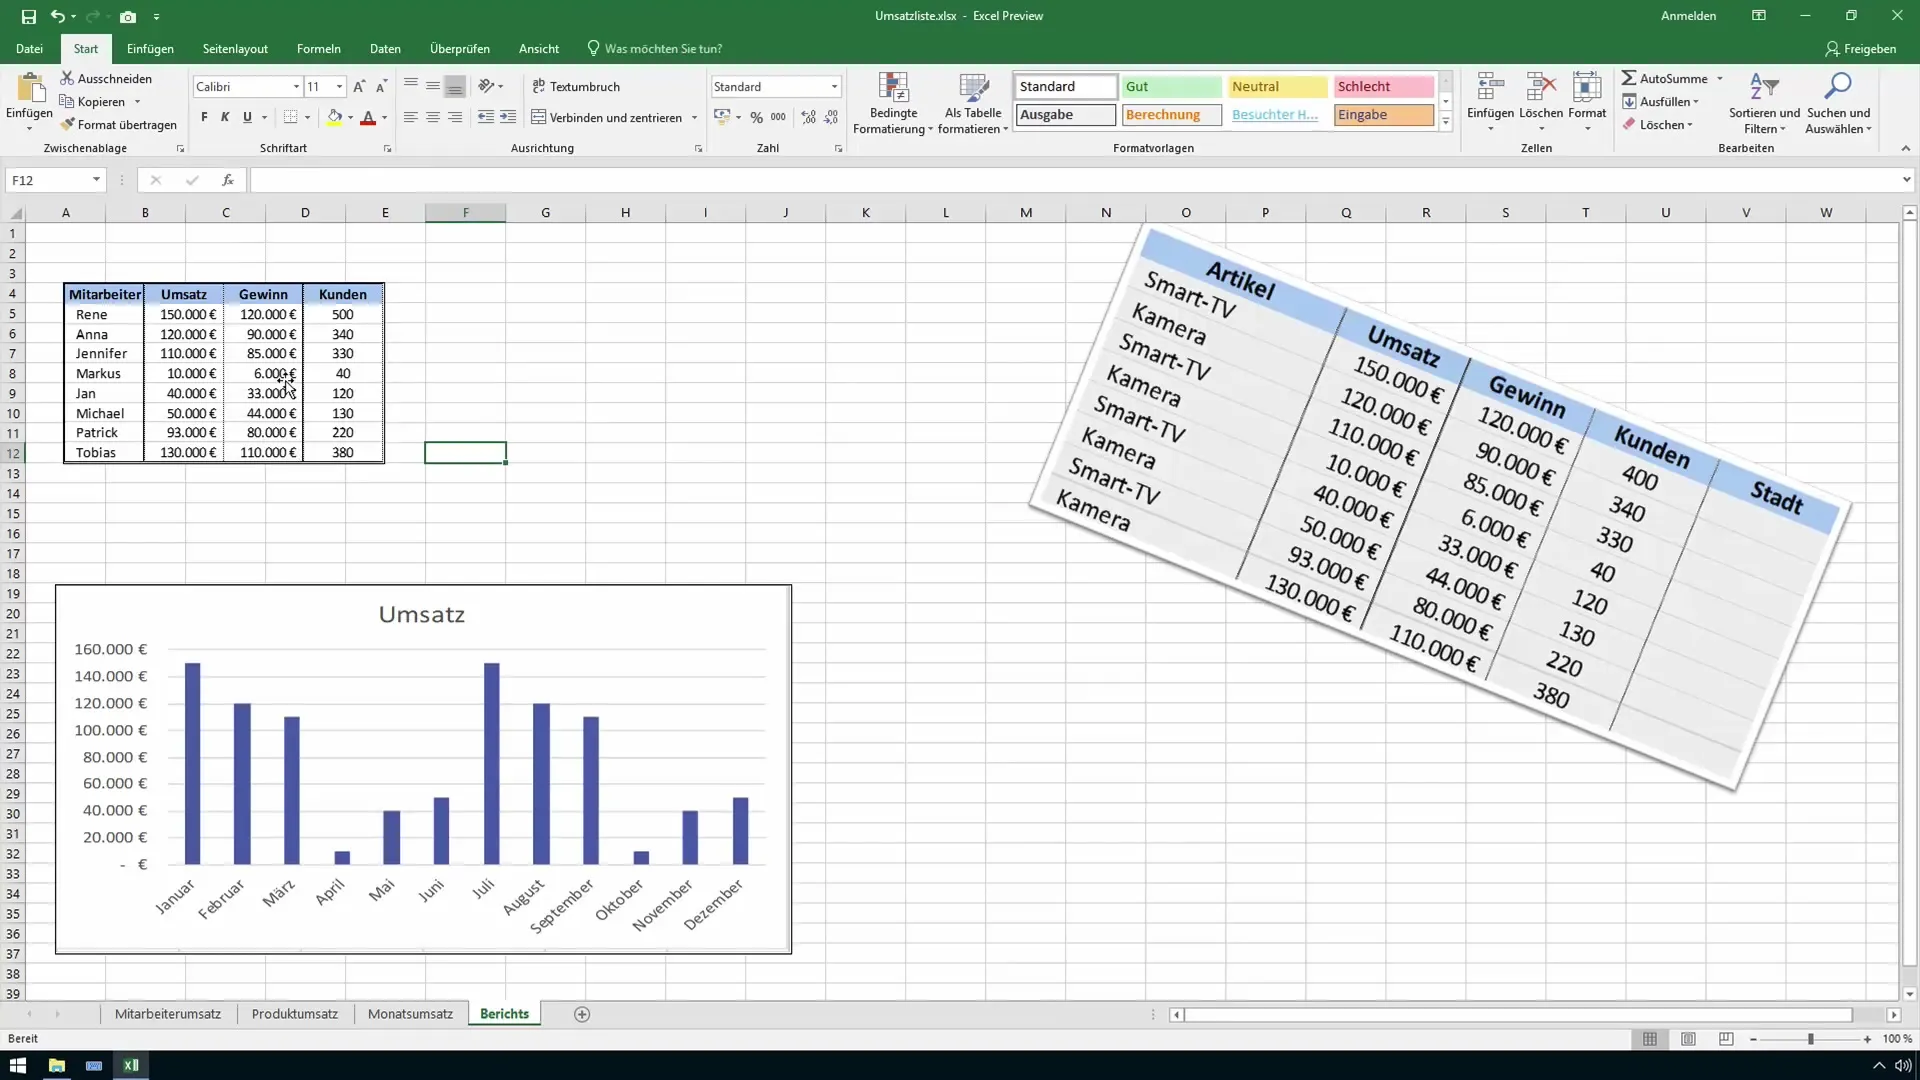
If you desire dynamic adjustments in the report, it is recommended to learn some tricks for using the camera icon.
Additionally, you can also specify the areas you want to save. This is done through simple Excel formulas and helps you keep track.
The option for static is also available, so you can save the images and charts you have created. This can be helpful when you need a fixed view of your data.
If you wish to print the reports, adjust the print layout to ensure everything is readable.
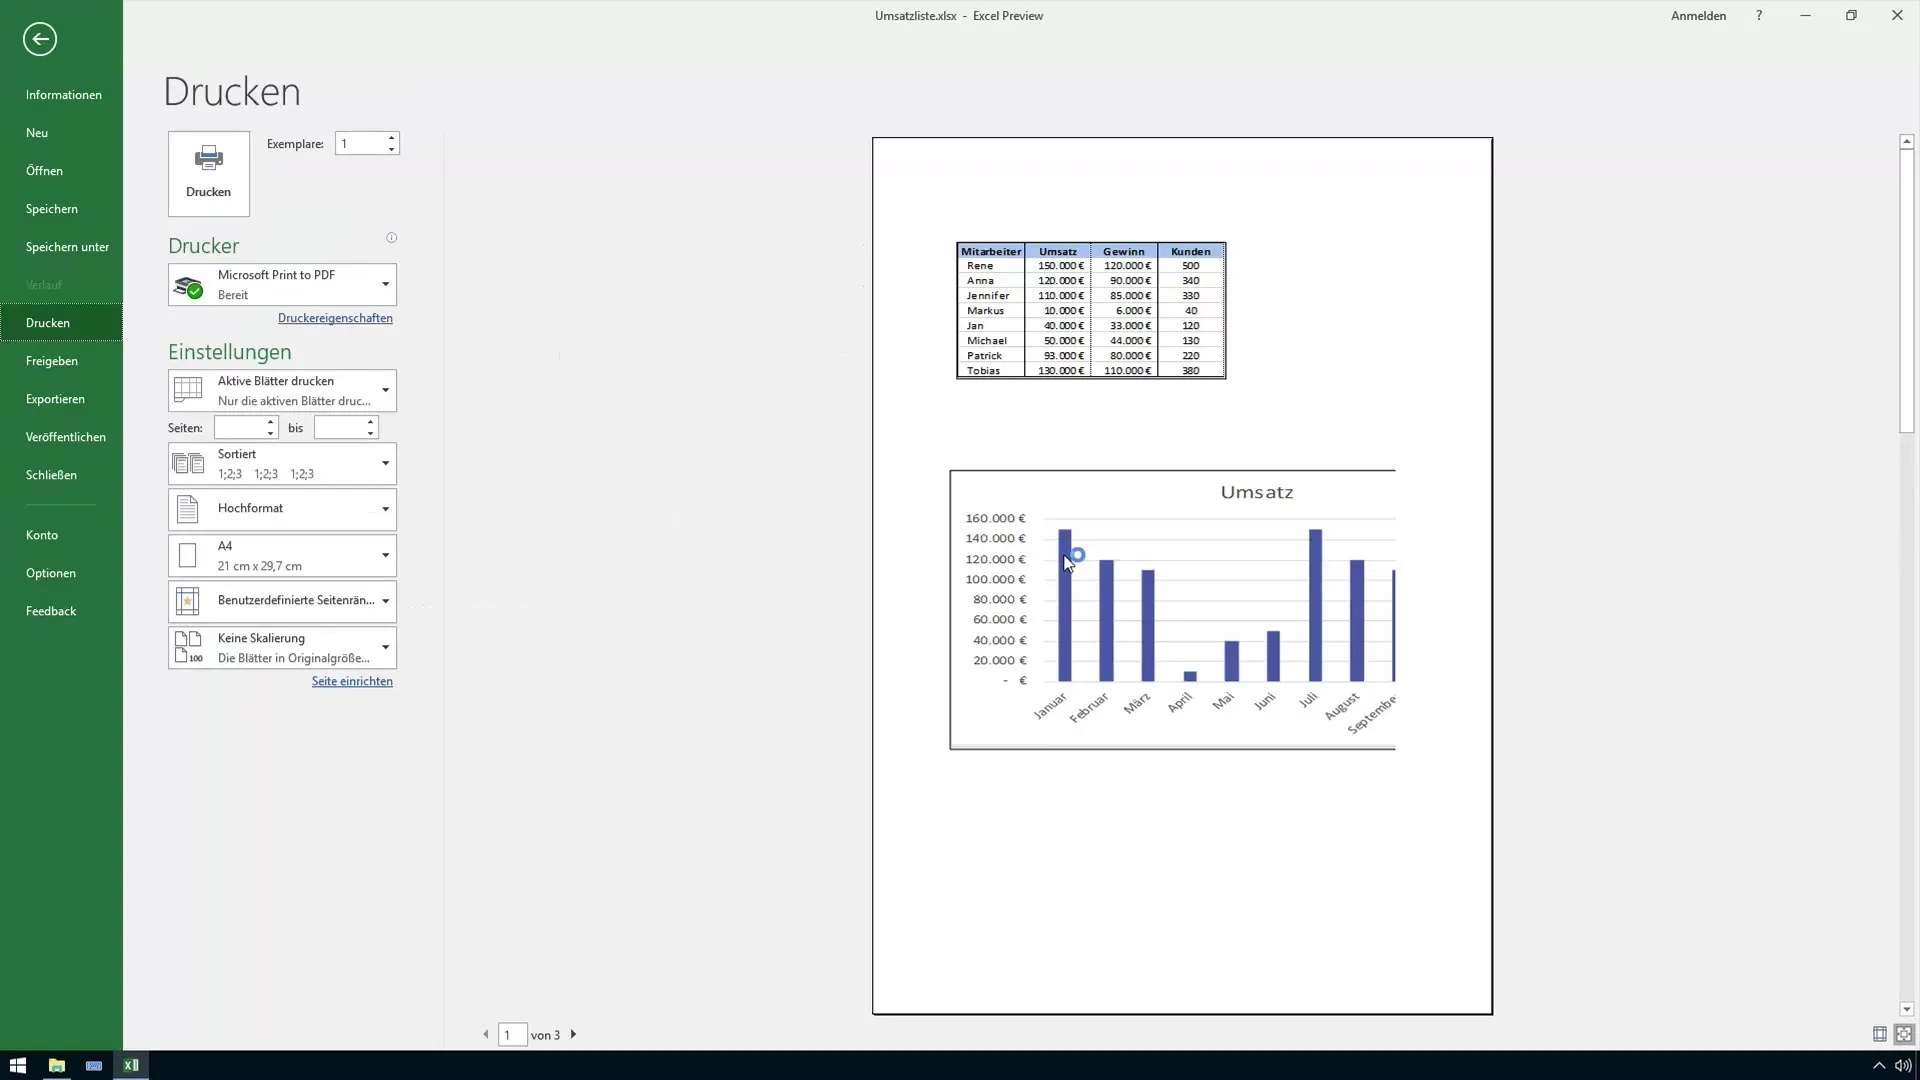
This was an introduction to using the camera function in Excel for your report creation. If you have any questions or comments, let me know. In the next video, I will present more helpful Excel tips.
Summary
With the camera function in Excel, you can directly insert cell ranges into your reports and design them in an appealing way. By creating visual representations of your data, you will get reports that are both informative and visually appealing.
Frequently Asked Questions
How do I activate the camera function in Excel?Go to "More Commands" in the Quick Access Toolbar and select "Camera".
Can I also insert complete charts with the camera?No, the camera function only works at the cell level.
How do the screenshots in my report update?The screenshots update automatically when the source data changes.
Can I customize the colors and design of the charts?Yes, you can adjust the color schemes and layout of your charts as you wish.
