In data analysis there are some tools that are particularly valuable. Pivot tables are certainly among them, as they allow you to evaluate large amounts of data quickly and clearly. Especially in multidimensional analysis, pivot tables offer a user-friendly way to filter out and visualize important information. Let's dive in and explore the benefits and functions of these powerful tables.
Main Insights
- Pivot tables enable efficient multidimensional data analysis.
- They allow data evaluation and visualization without altering the original datasets.
- Pivot tables help you represent large amounts of data in a clear way and determine important metrics.
The Basics of Pivot Tables
Pivot tables are a special type of tables that can be used in Google Sheets to analyze data in various ways. The term "Pivot" comes from the English word for "pivot" and describes the ability to view the data from different perspectives.

The greatest advantage of pivot tables lies in their flexibility. They allow you to reorganize the data as needed and conduct complex analyses without altering the original data. This enables you to easily identify patterns and gain crucial insights.

Application of Pivot Tables
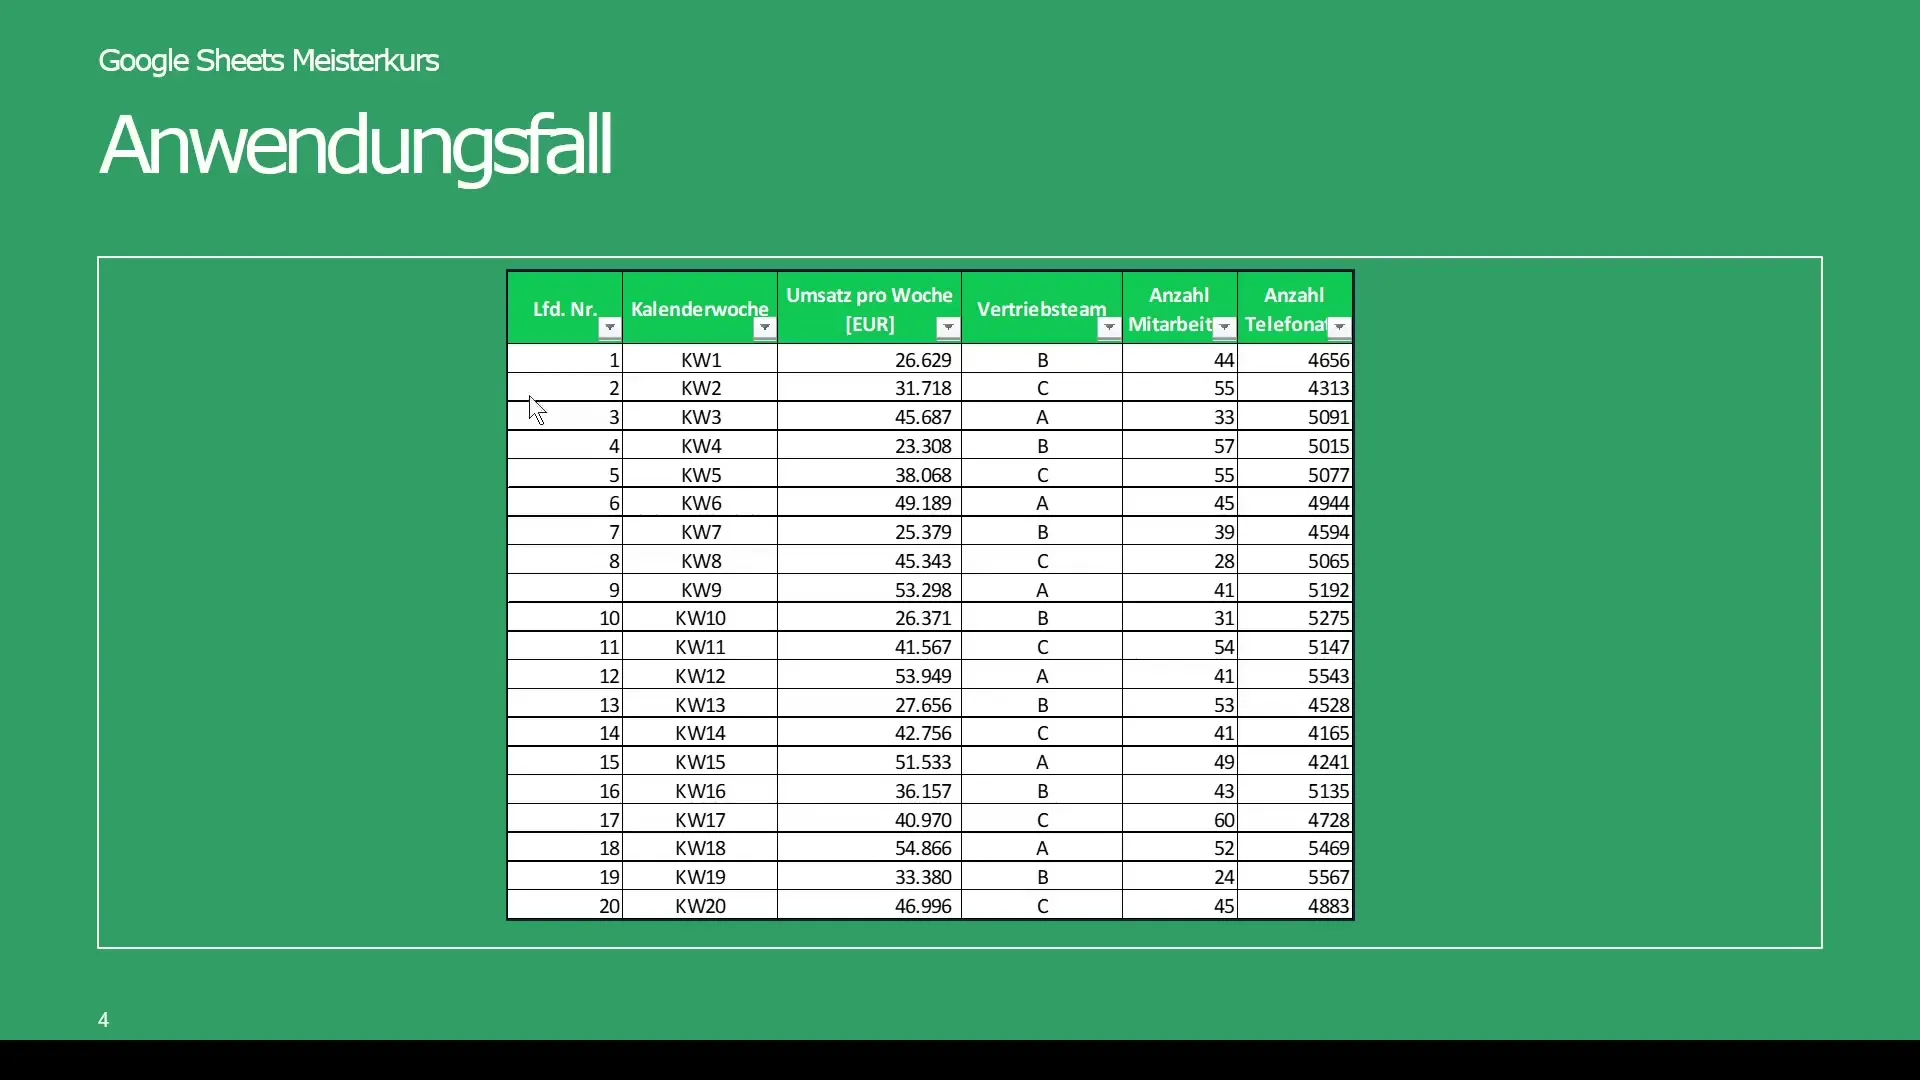
Imagine you want to analyze your company's sales figures over several calendar weeks. Instead of working with small data sets, you now have the option to examine the total sales with respect to different sales teams. With pivot tables, for example, you can filter out specific sales above €40,000 and further analyze them through suitable visualizations.

In Google Sheets, it looks like this: You have a table with various columns, including a running number, calendar weeks, revenue, and sales teams. Normally, you could analyze this data through manual filters and formulas, but pivot tables make this significantly easier and more efficient.

Step-by-Step Guide to Creating a Pivot Table
Step 1: Prepare Data
First, make sure your data in Google Sheets is well-structured. Ensure that each column has a header and the data is arranged in consecutive rows.

Step 2: Create Pivot Table
To create a pivot table, go to Data in the top menu and then select Pivot Table. You can choose the option of whether you want to insert the table in a new sheet or in the current sheet.

Step 3: Add Data Fields
Once the pivot table is created, a new menu on the right side will open where you can add the data fields. Here you can select the different data fields you want to analyze. For example, you may want to add revenue data, calendar weeks, and sales teams.

Step 4: Arrange Data
Arrange the data in the pivot table. You can arrange data in rows, columns, and values. This flexibility allows you to analyze revenues by sales team and calendar week, for example.

Step 5: Conduct Analysis
Now you can analyze your data. You may be interested in total sums or average values. You can also perform specific calculations such as variances or standard deviations to make more informed decisions.
Summary
Using pivot tables in Google Sheets offers countless possibilities for data-driven decision-making. They not only allow for comprehensive analysis, but also for easy manipulation and visualization of data. You can extract important information without altering the original data, saving time and increasing efficiency.
Frequently Asked Questions
What are pivot tables and how do they work?Pivot tables are special tables in Google Sheets that allow multidimensional analysis and representation of large amounts of data.
How can I create a pivot table in Google Sheets?Go to the Data menu and select Pivot Table. Then add the desired data fields and arrange them.
Can I visualize data with pivot tables?Yes, pivot tables allow for easy creation of charts and graphs to visually represent the analyzed data.
Do pivot tables help me identify patterns?Absolutely, by reorganizing data in pivot tables, you can more easily identify patterns and trends.
Why are pivot tables useful for sales analysis?They enable you to filter large amounts of data and analyze them based on specific criteria, helping you make informed decisions.


