The Gantt Chart is an essential tool for planning and visualizing projects in Microsoft Project. It allows you to visually represent the progress of your tasks and understand the respective dependencies. However, the standard view is often not satisfactory. Therefore, it makes sense to personalize the display and design of your Gantt chart. In this guide, I will show you how to effectively customize the Gantt chart in Microsoft Project to create a clear and more appealing representation.
Main Insights
- Customizing the colors and shapes in your Gantt chart can make a big difference in visualizing your project.
- Microsoft Project offers various options for customizing bar shape, color, and pattern.
- It is important to create a Gantt chart that suits your preferences and needs.
Step-by-Step Guide
To customize your Gantt chart in Microsoft Project, follow these steps:
1. Access the Gantt Chart Tools
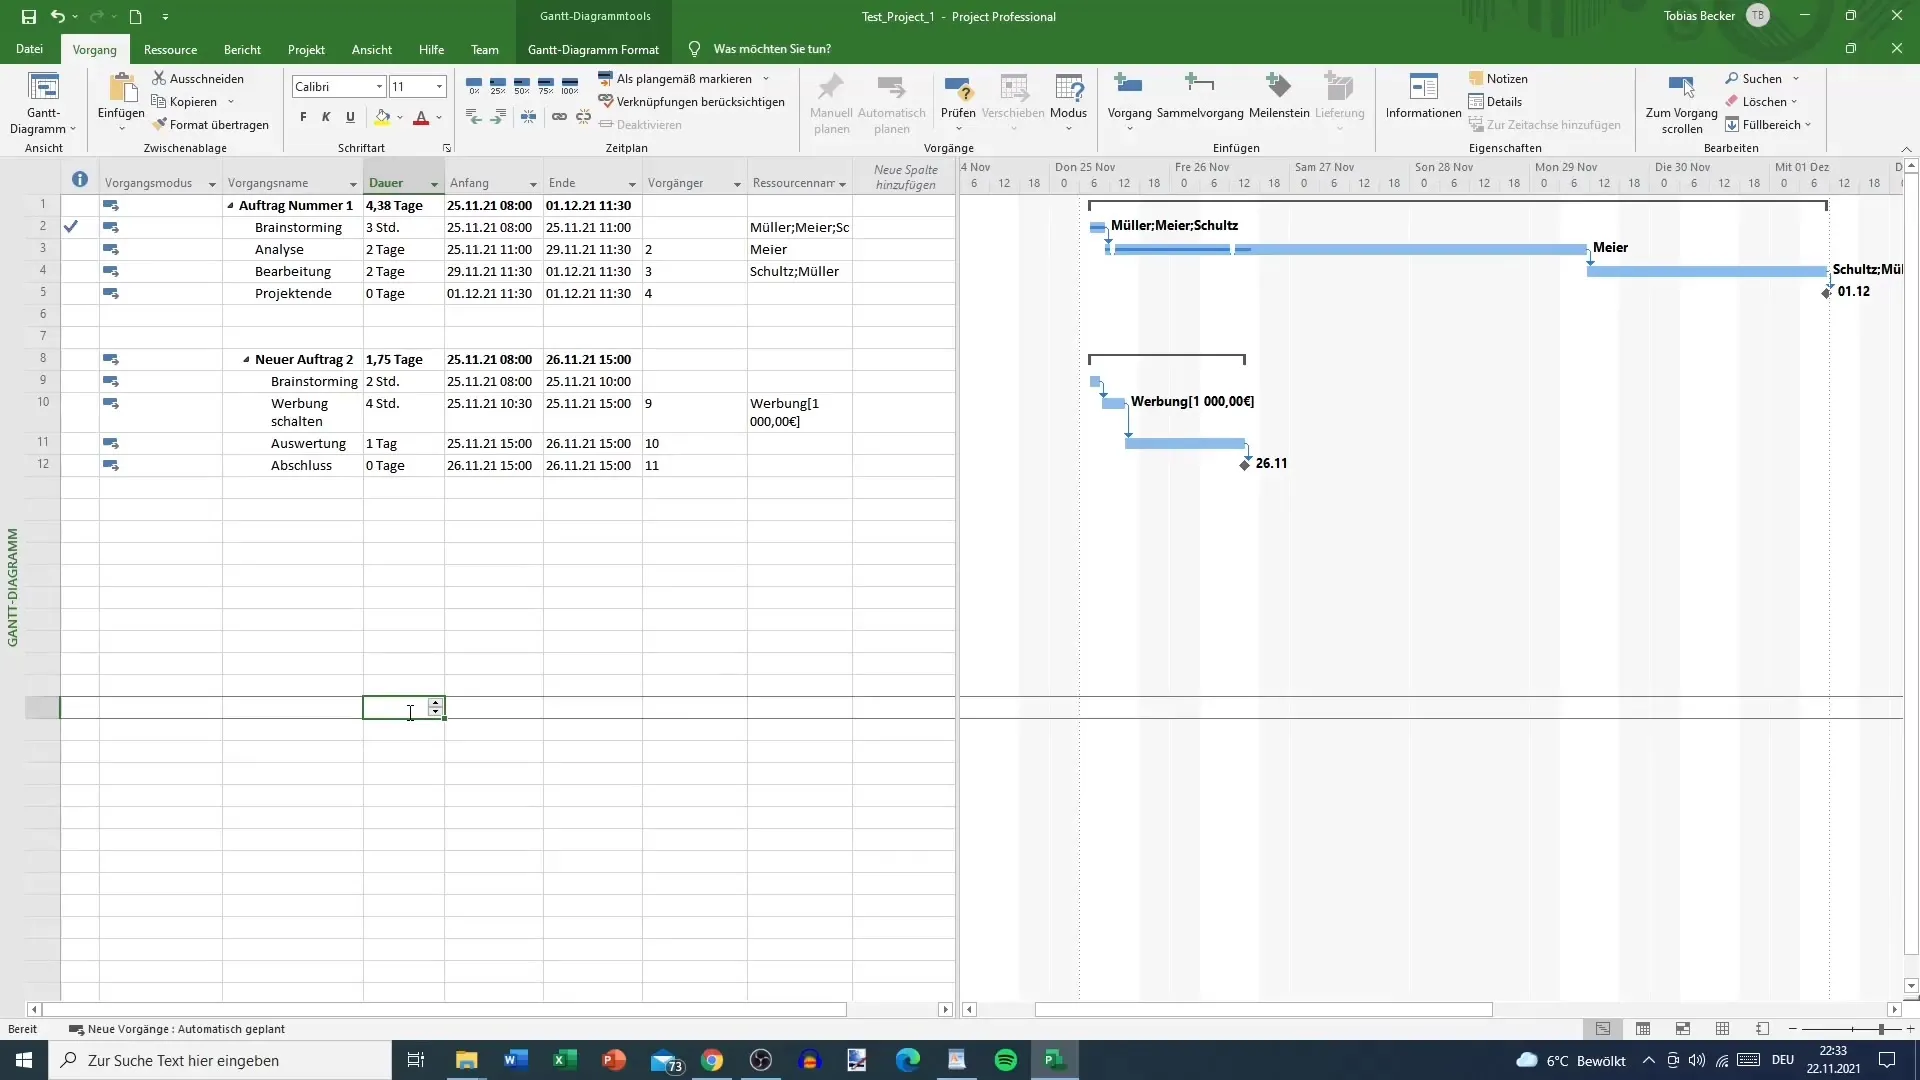
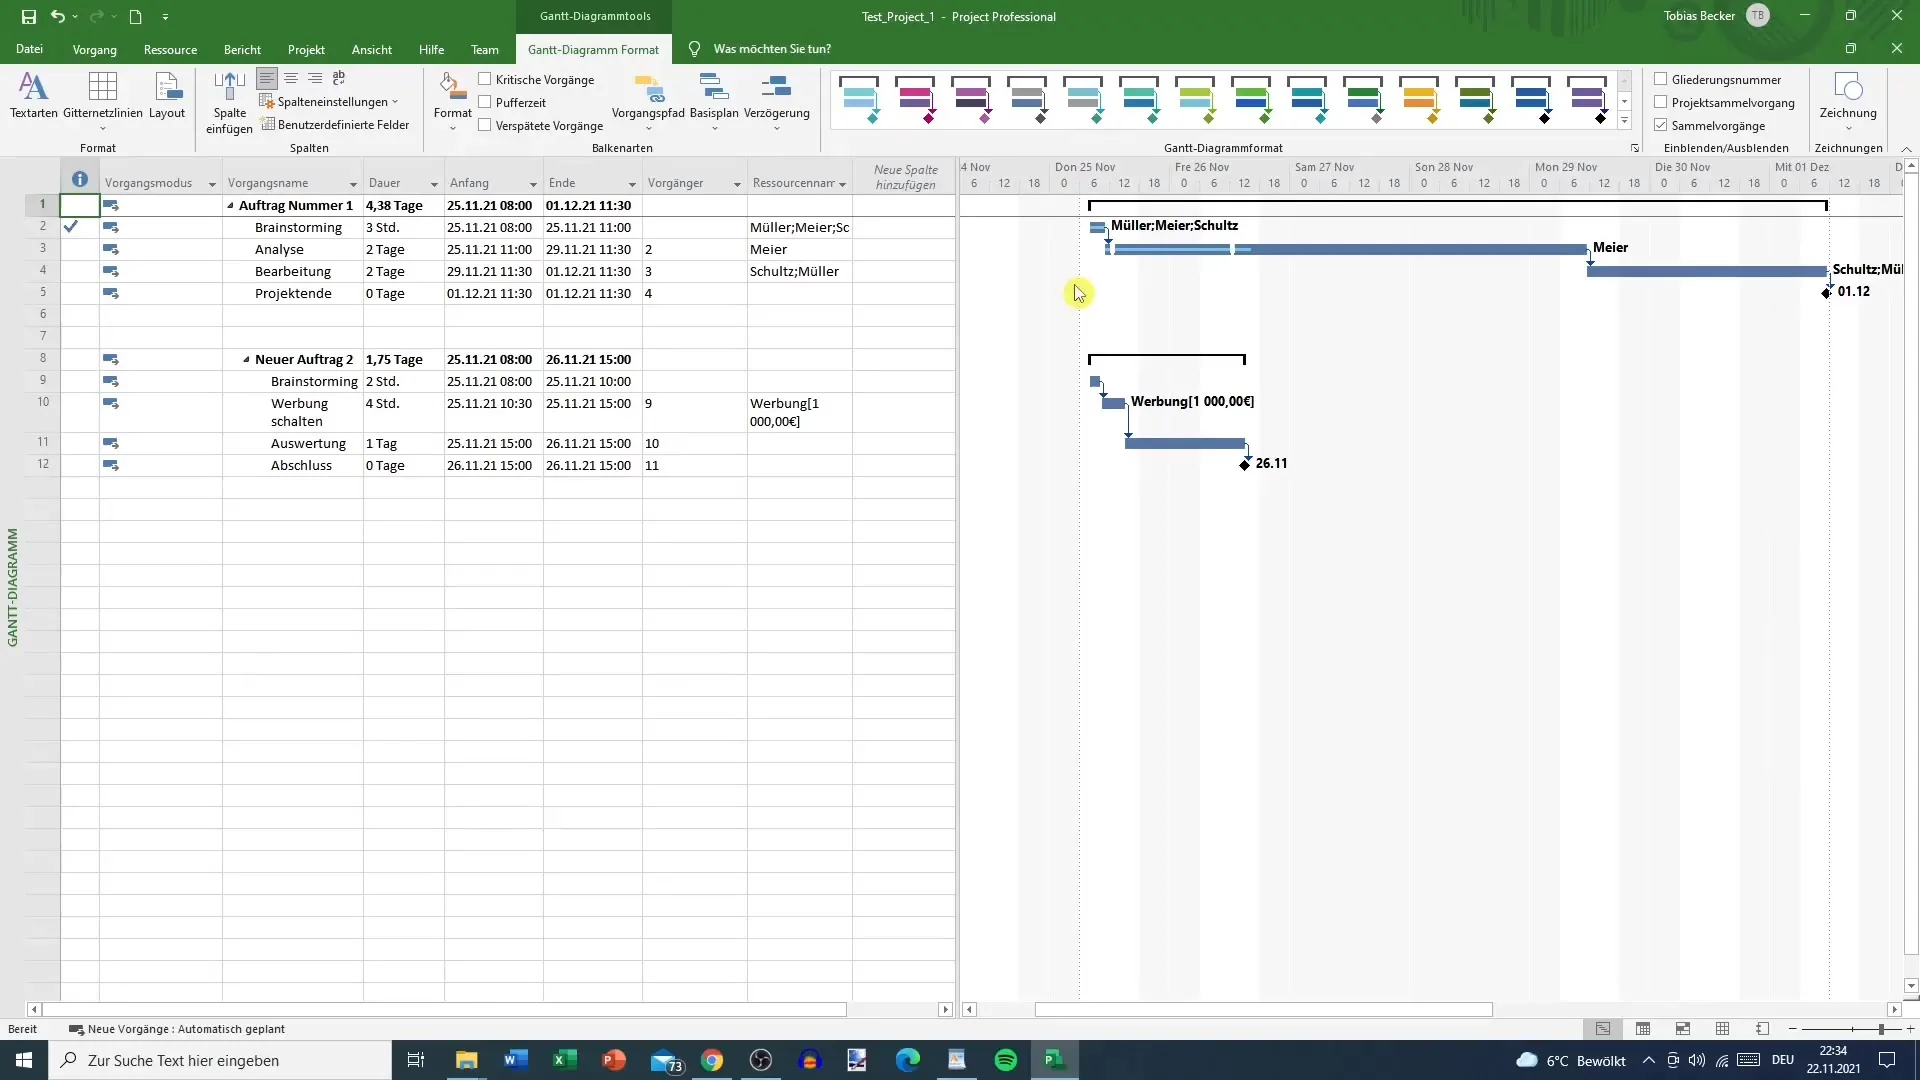
To make adjustments, you first need to access the corresponding tools. Click on the "Gantt Chart" tab in the top menu. Here you will find specific options for editing the chart elements.

2. Customize Colors
In the editing interface, there are numerous color options you can choose from. The default color is often a bright blue. However, you have the option to choose different colors such as purple, yellow, or dark pink to make your chart more individual. Make sure the selected colors are visually appealing and do not affect the readability of the chart.
3. Modify Bar Shapes
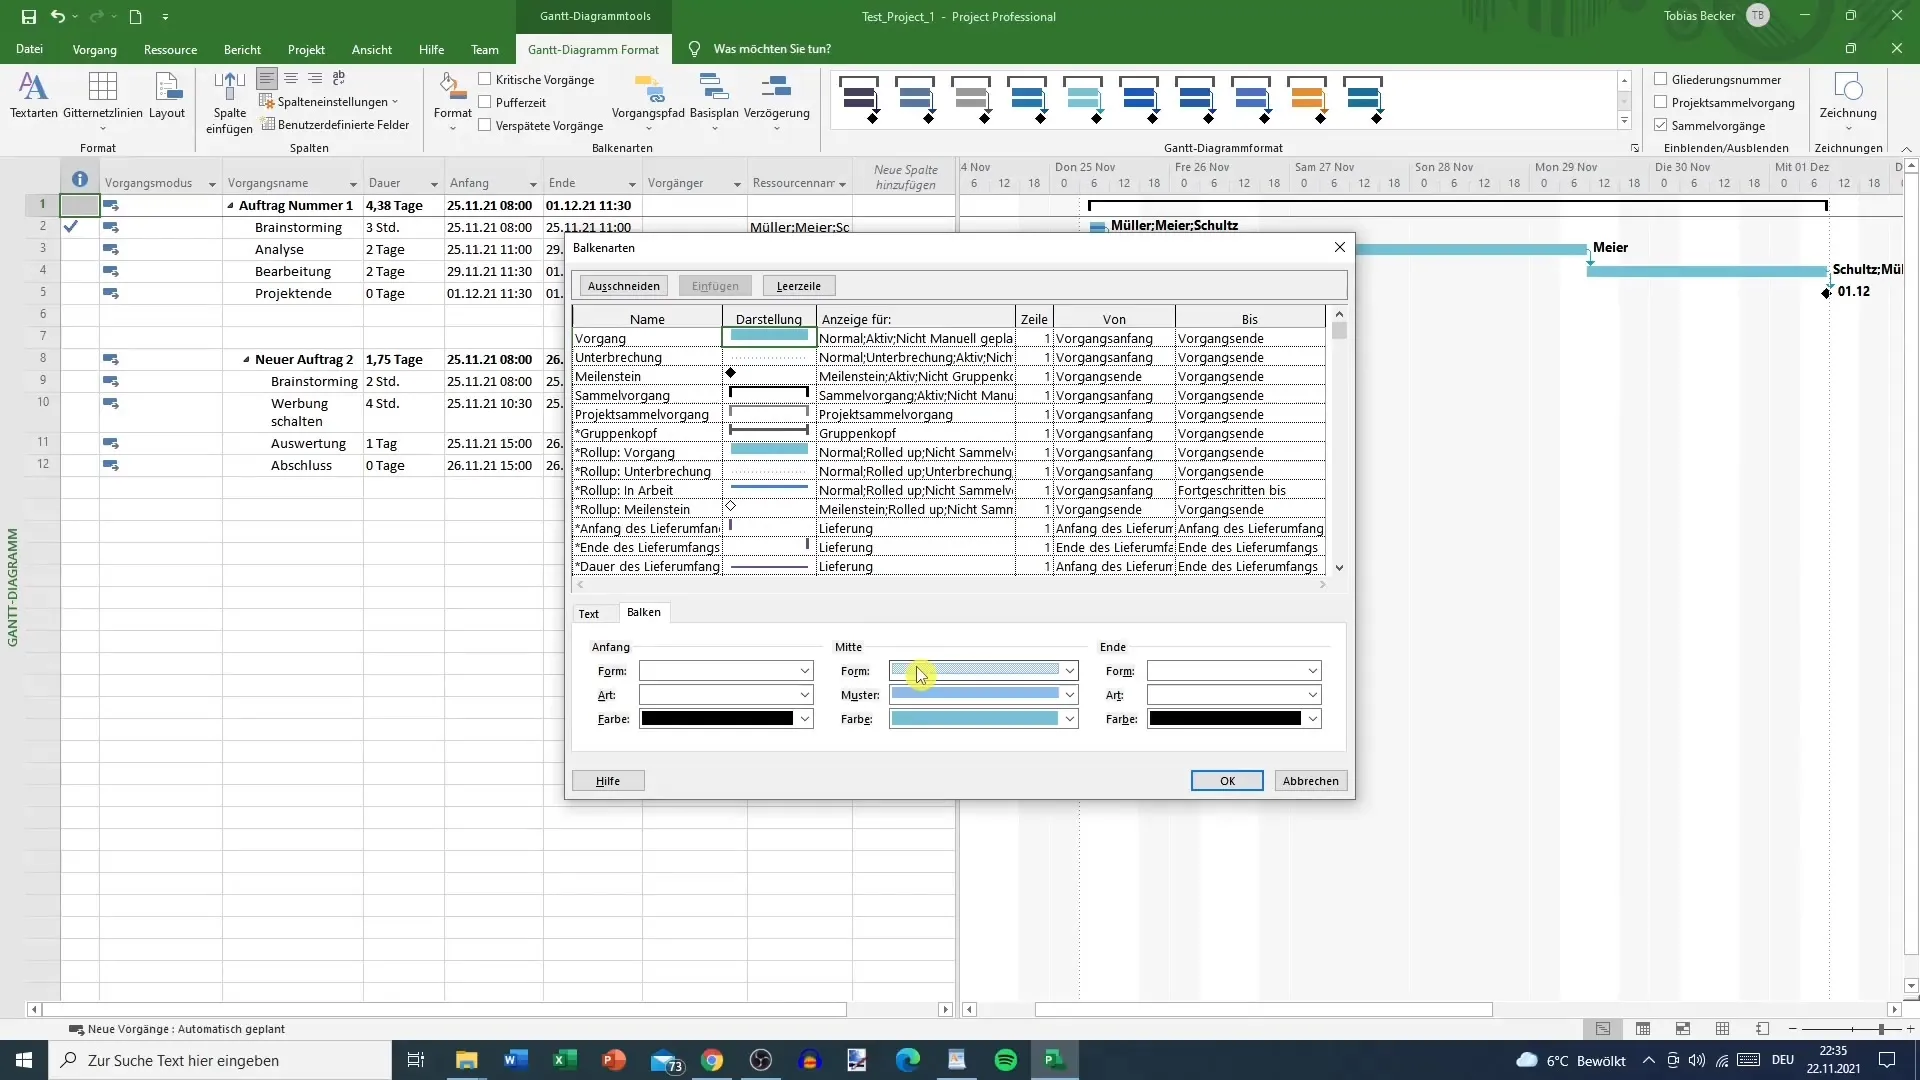
Now comes the exciting part: the bar shapes. Click on the option to edit the shape of the bars. You can customize the start and end points as well as the thickness of the bars. Furthermore, you have the option to display the bars as dashed or solid. Experiment with different variations to find the look that best suits your project.

4. Customization for Specific Tasks
Each task in your project can receive different representations. For instance, you can highlight a milestone by changing its shape – perhaps to a striking shape like a heart or an arrow. The milestone is typically displayed as a small square by default, but you can also get creative here.

5. Visibility of Interruptions
It can be disruptive if interruptions in the project are displayed as dashed, especially if they are not clearly recognizable. You have the option to change this color or pattern to improve visibility. Here, you can experiment with different colors to achieve the desired look.
6. Superficial Adjustments
Keep in mind that the changes you make are purely cosmetic. The underlying data and logic of your project remain unchanged. The customizations are meant to allow you to style the display to your liking
Summary
You have learned how to customize the Gantt chart in Microsoft Project to achieve a more appealing and functional representation of your project workflows. With the right color choices, bar adjustments, and specific formatting, you can significantly improve the readability and aesthetics of your project planning. Use the features to give your Gantt chart the desired appearance and make your daily work in project management easier.
Frequently Asked Questions
How do I change the colors in the Gantt chart?You can customize the colors in the Gantt chart by selecting the desired color options in the "Gantt Chart" tab.
Can I change the shape of the bars in the Gantt chart?Yes, you can adjust the bar shapes, including start and end points as well as the bar thickness.
How do I highlight a milestone?A milestone can be highlighted by changing the shape, for example, to a heart or an arrow.
Are the customizations effective for project work?The customizations are cosmetic and improve readability without affecting the underlying data.
Can I change the pattern of interruptions?Yes, the pattern and color of interruptions can be adjusted to be more visible.


