Creating flowcharts is a remarkable skill that helps you represent processes clearly and efficiently. Especially the cross-functional flowcharts in MS Visio give you the opportunity to visually represent different areas of a company and their interactions. With this guide, you will learn step by step how to create and customize a cross-functional flowchart in MS Visio to effectively visualize your business processes.
Key Takeaways
- Cross-functional flowcharts help to depict the interactions of different departments.
- MS Visio provides specialized shapes for cross-functional flowcharts.
- Adjustments to individual shapes are straightforward to meet specific requirements.
Step-by-Step Guide
To create a cross-functional flowchart, follow these steps:
1. Create an Empty Flowchart
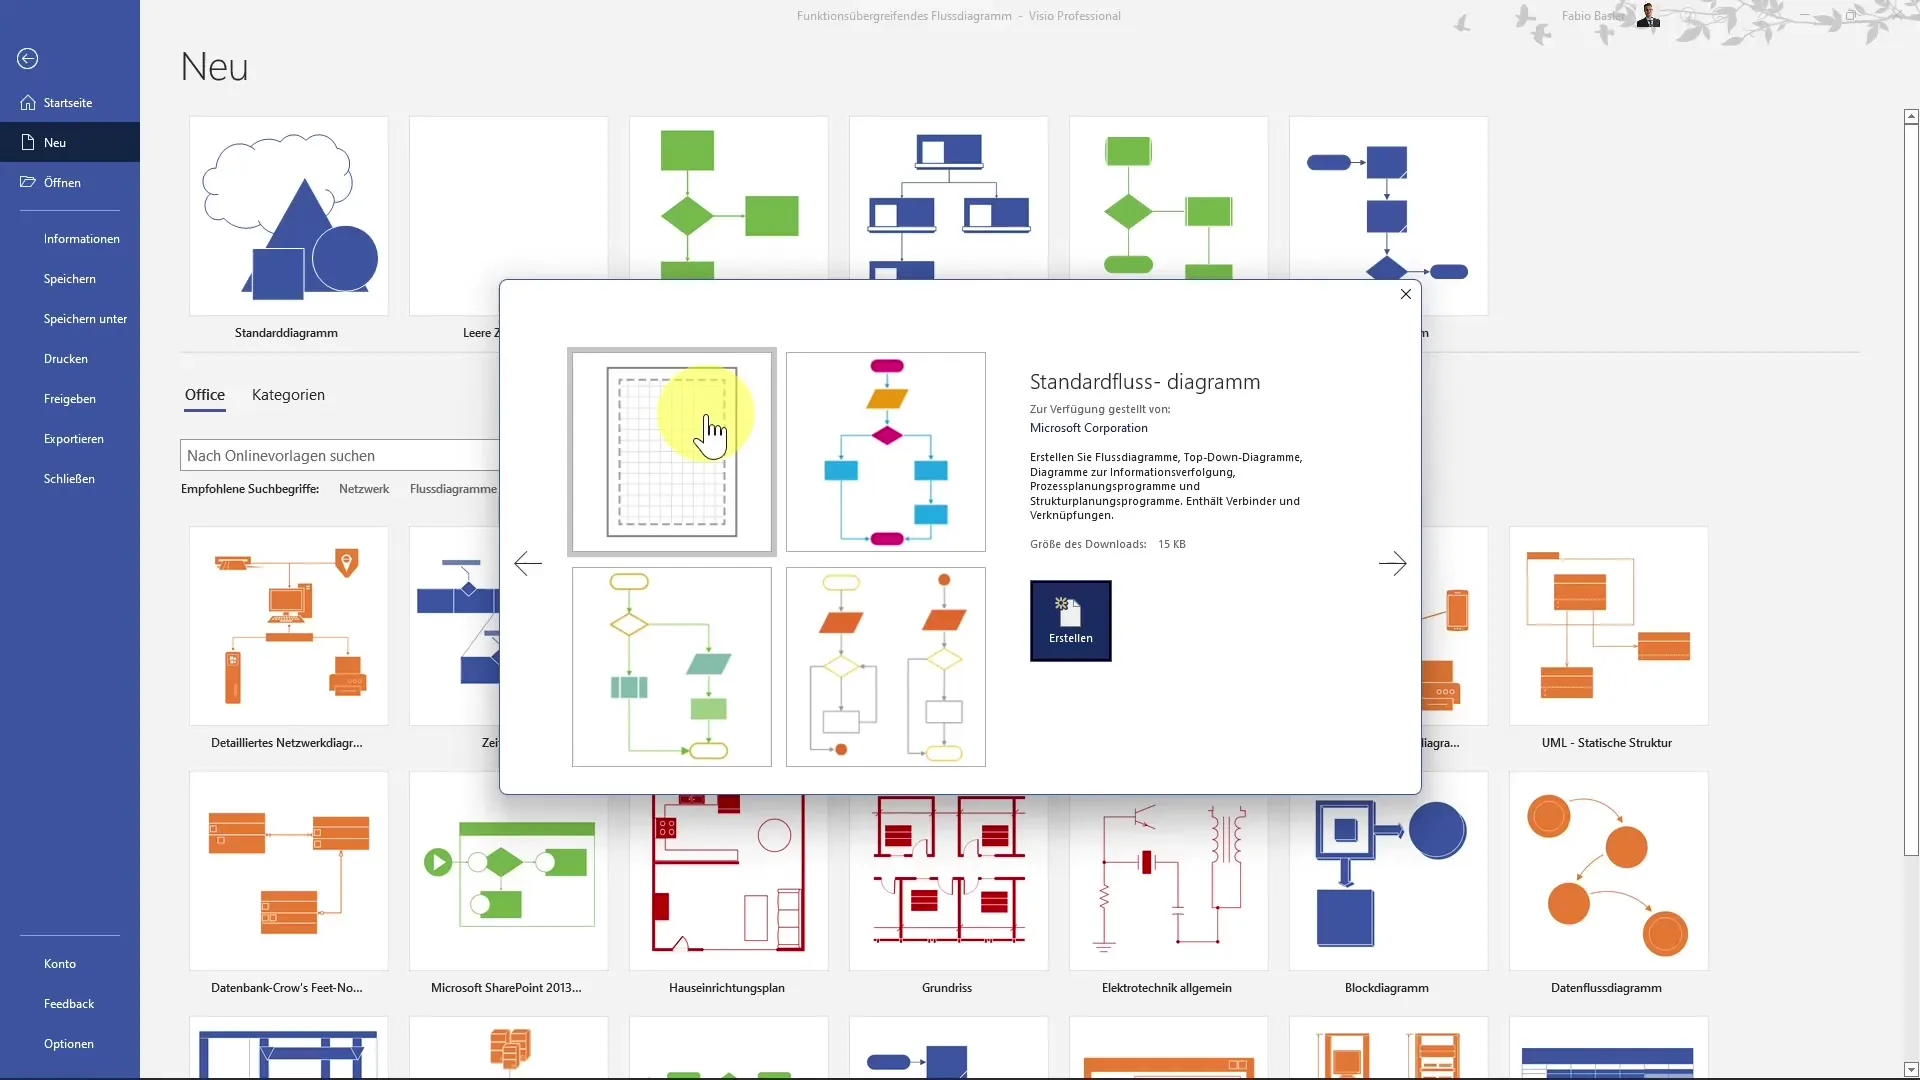
Start by creating an empty flowchart. Open MS Visio and select the "Basic Flowchart" category. Click "Create" to open your new drawing canvas.
2. Select Shapes
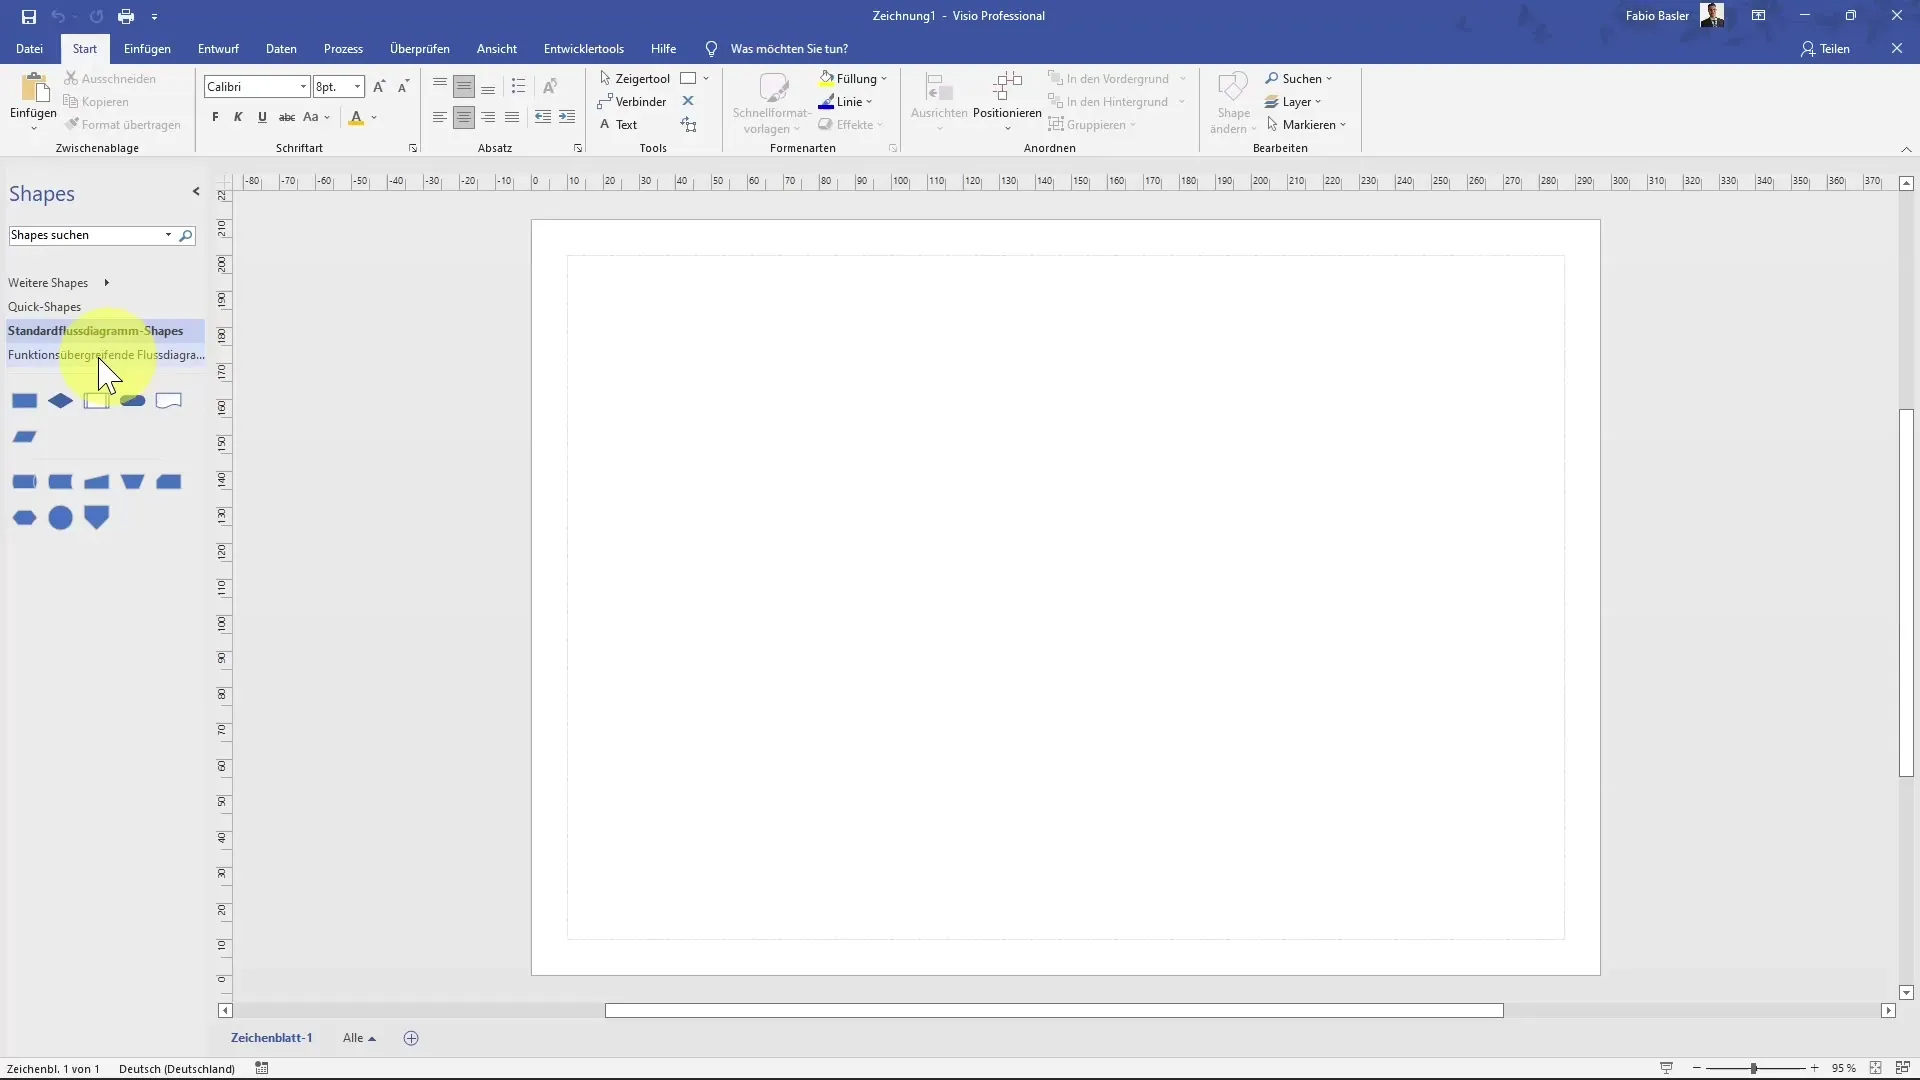
Now, on the left side, you will see the required shapes. Here you can find both standard flowchart shapes and the special cross-functional shapes under the "Flowchart" category. Choose the necessary shapes to design your diagram.
3. Add Responsibility Area
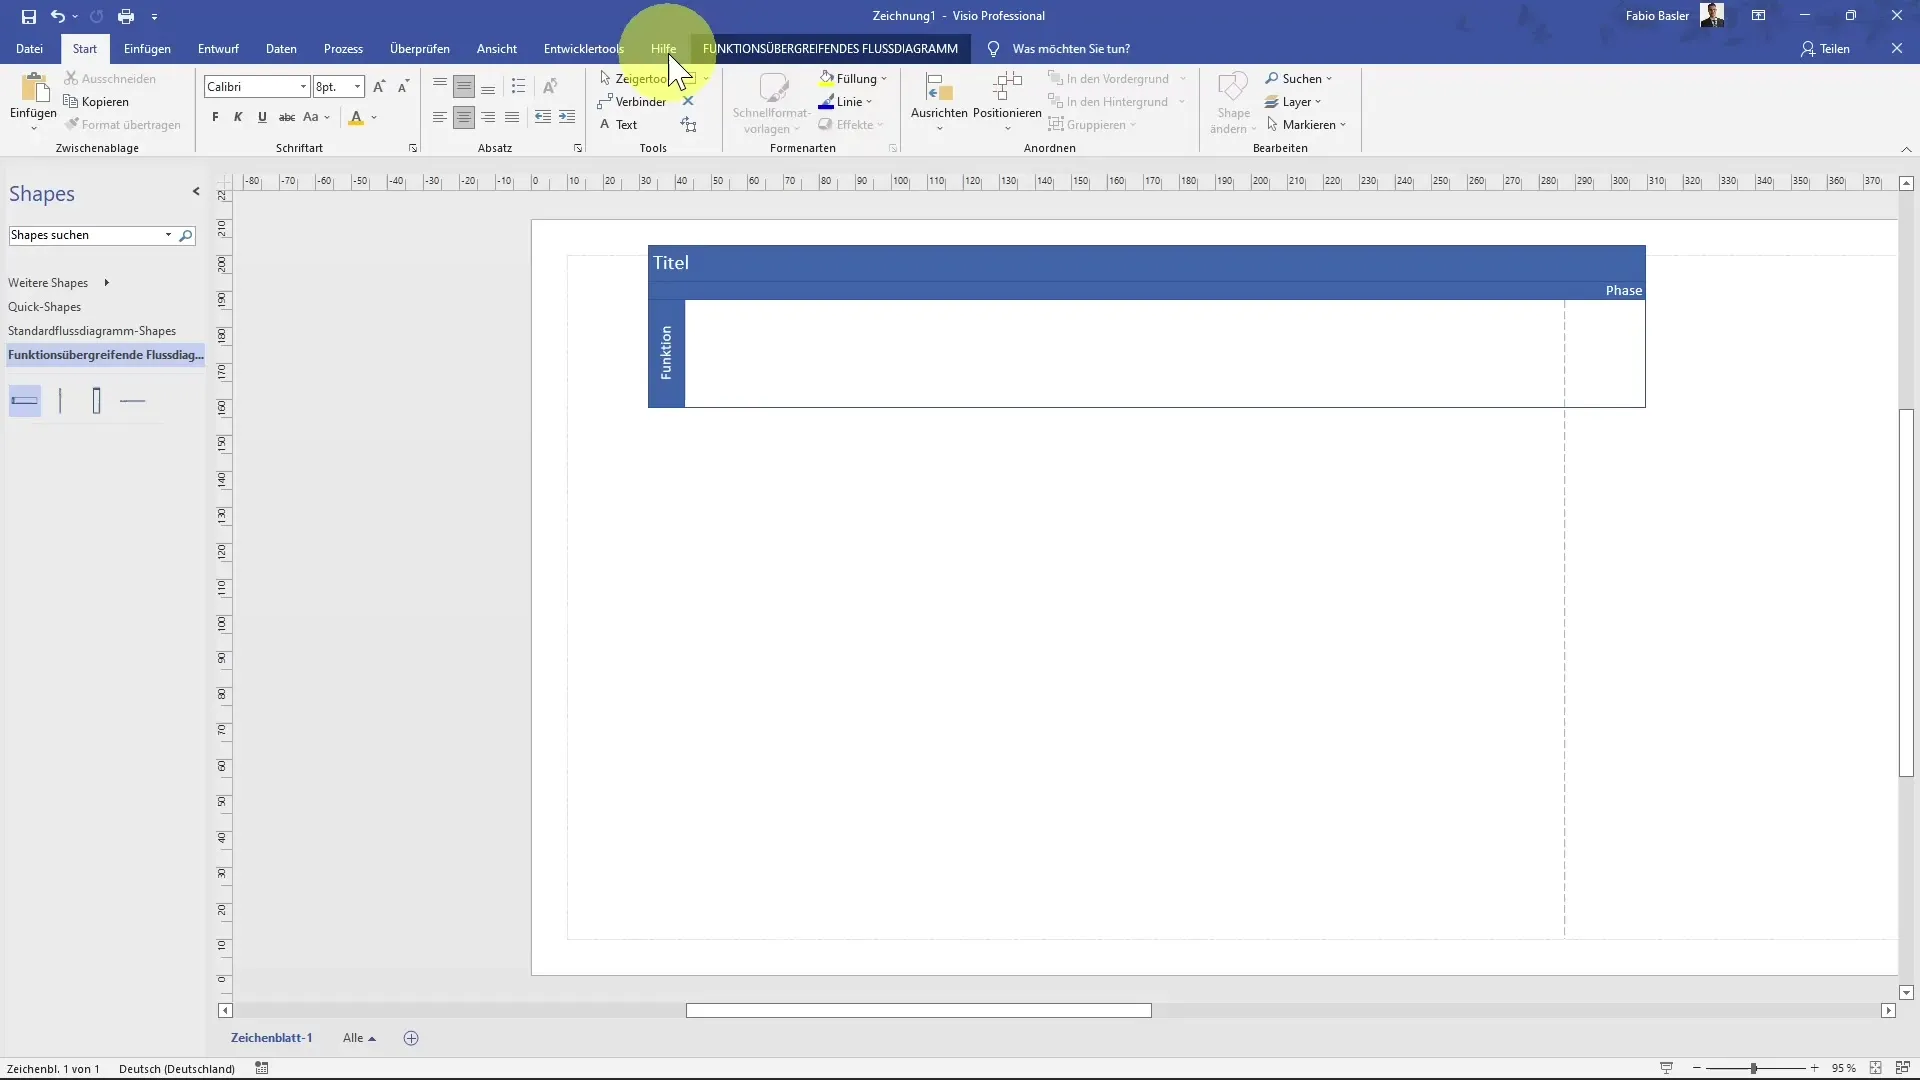
Next, add a responsibility area. When you hover over the shapes for cross-functional flowcharts, a new tab will appear above. Here you can visualize the departments involved in your process, for example, logistics.
4. Implement Functional Areas
Now you want to display additional functional areas in the diagram. You can simply select the function and with the control key pressed, drag the shape down to duplicate it. Change the label to "Sales," where information about customer prices is processed.
5. Add More Departments
Next, add the finance department responsible for controlling. Your representation should now include a total of four functional departments. Within these areas, you then add the specific process elements.
6. Use Separators
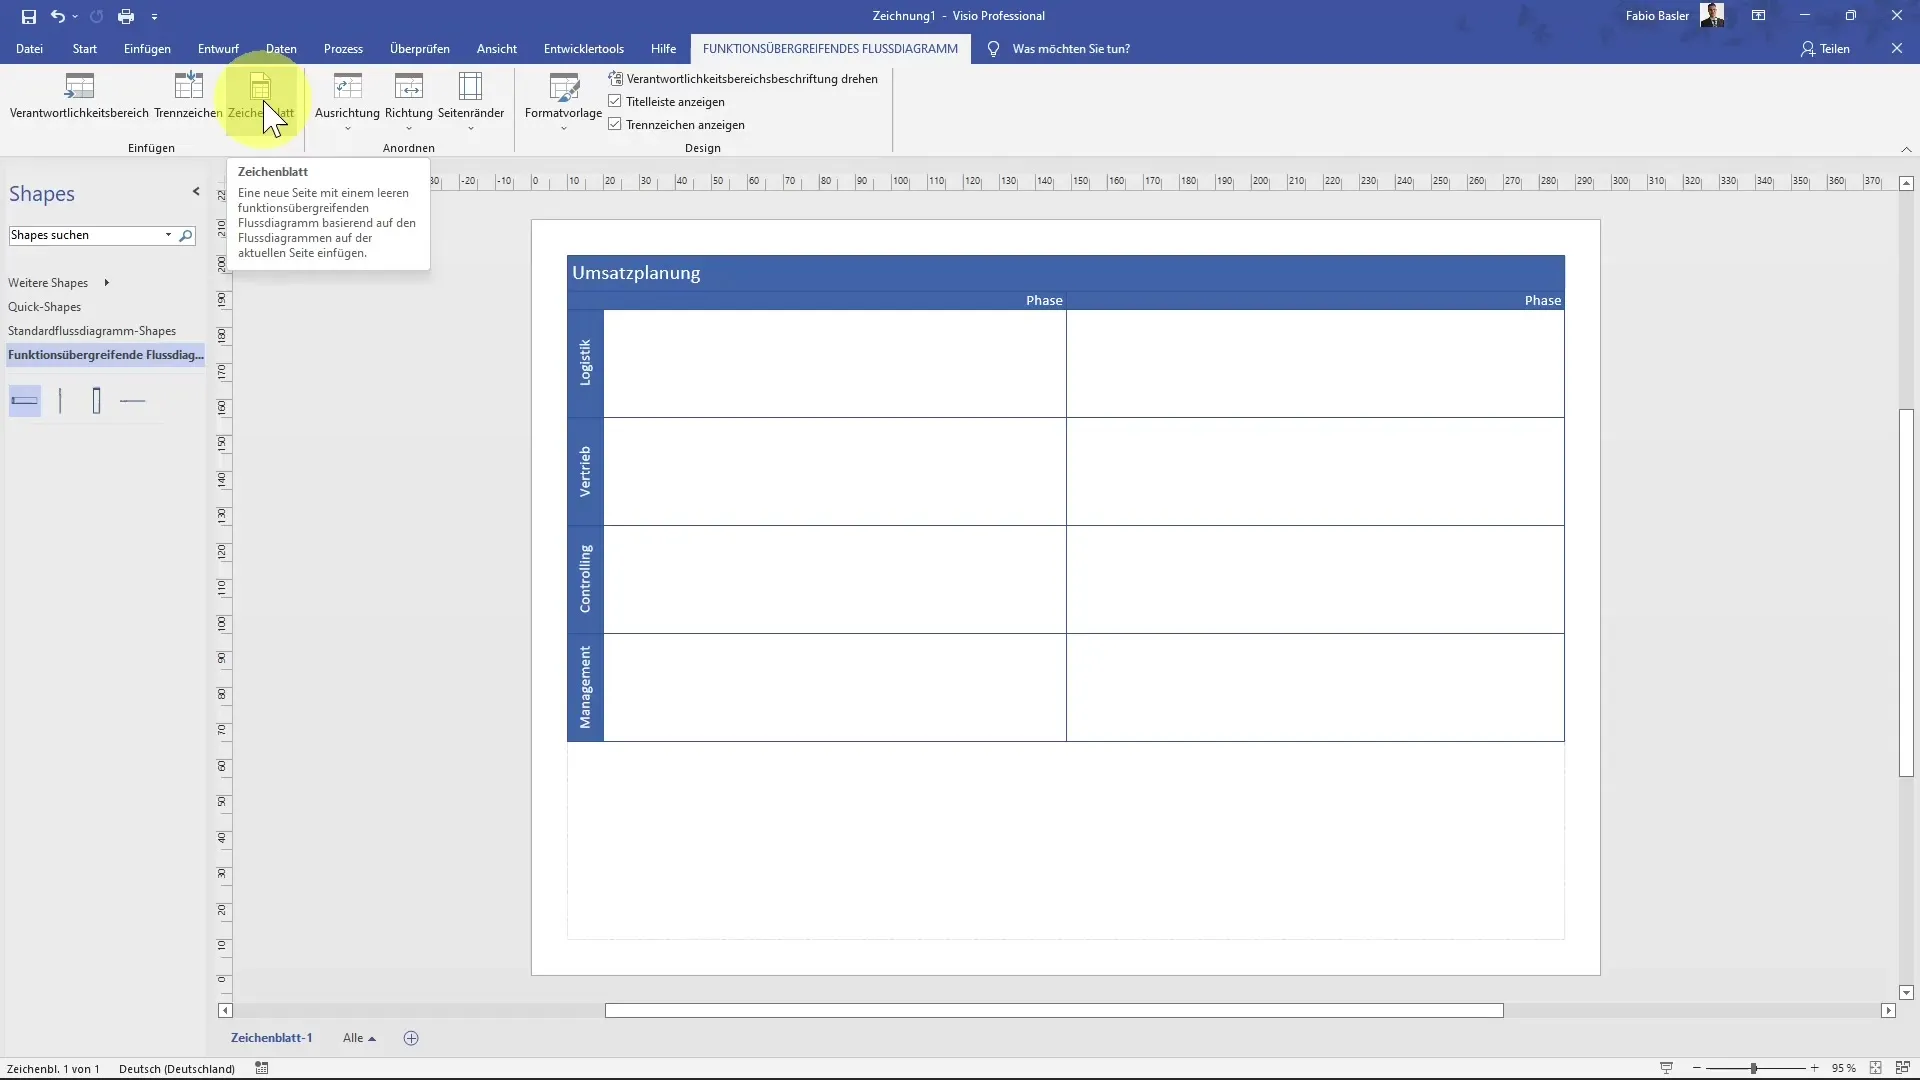
To illustrate the different phases of the process, you can add a separator. For example, the process could start on the first workday of the month and end on the fifth workday. A simple separator helps to visually represent this.
7. Duplicate Drawing Canvas
If you want to create a similar diagram in parallel, you can duplicate the current drawing canvas. This way, you immediately have a copy and can add the new information.
8. Adjust Alignment
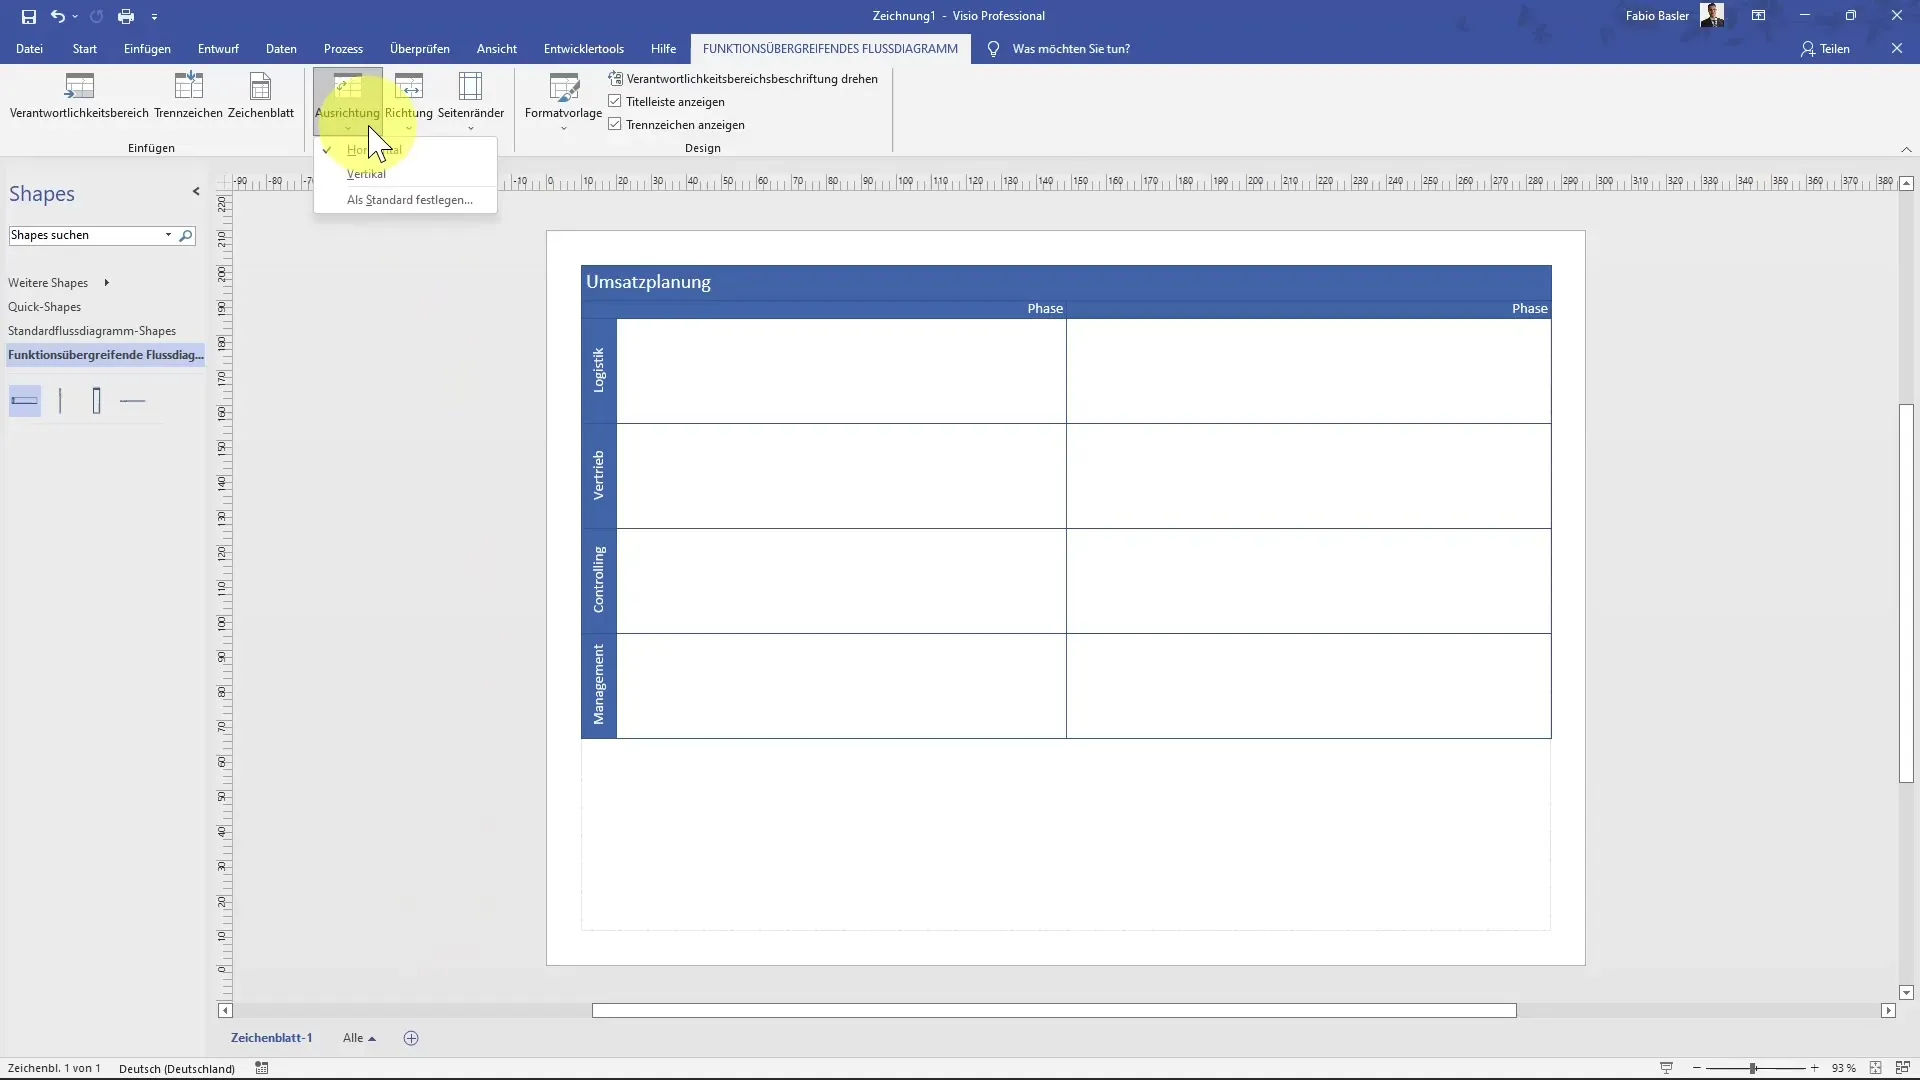
After adding your shapes, you can determine whether the diagram should be horizontally or vertically aligned. Using the formatting options in MS Visio, you can easily change the alignment.
9. Edit Shapes
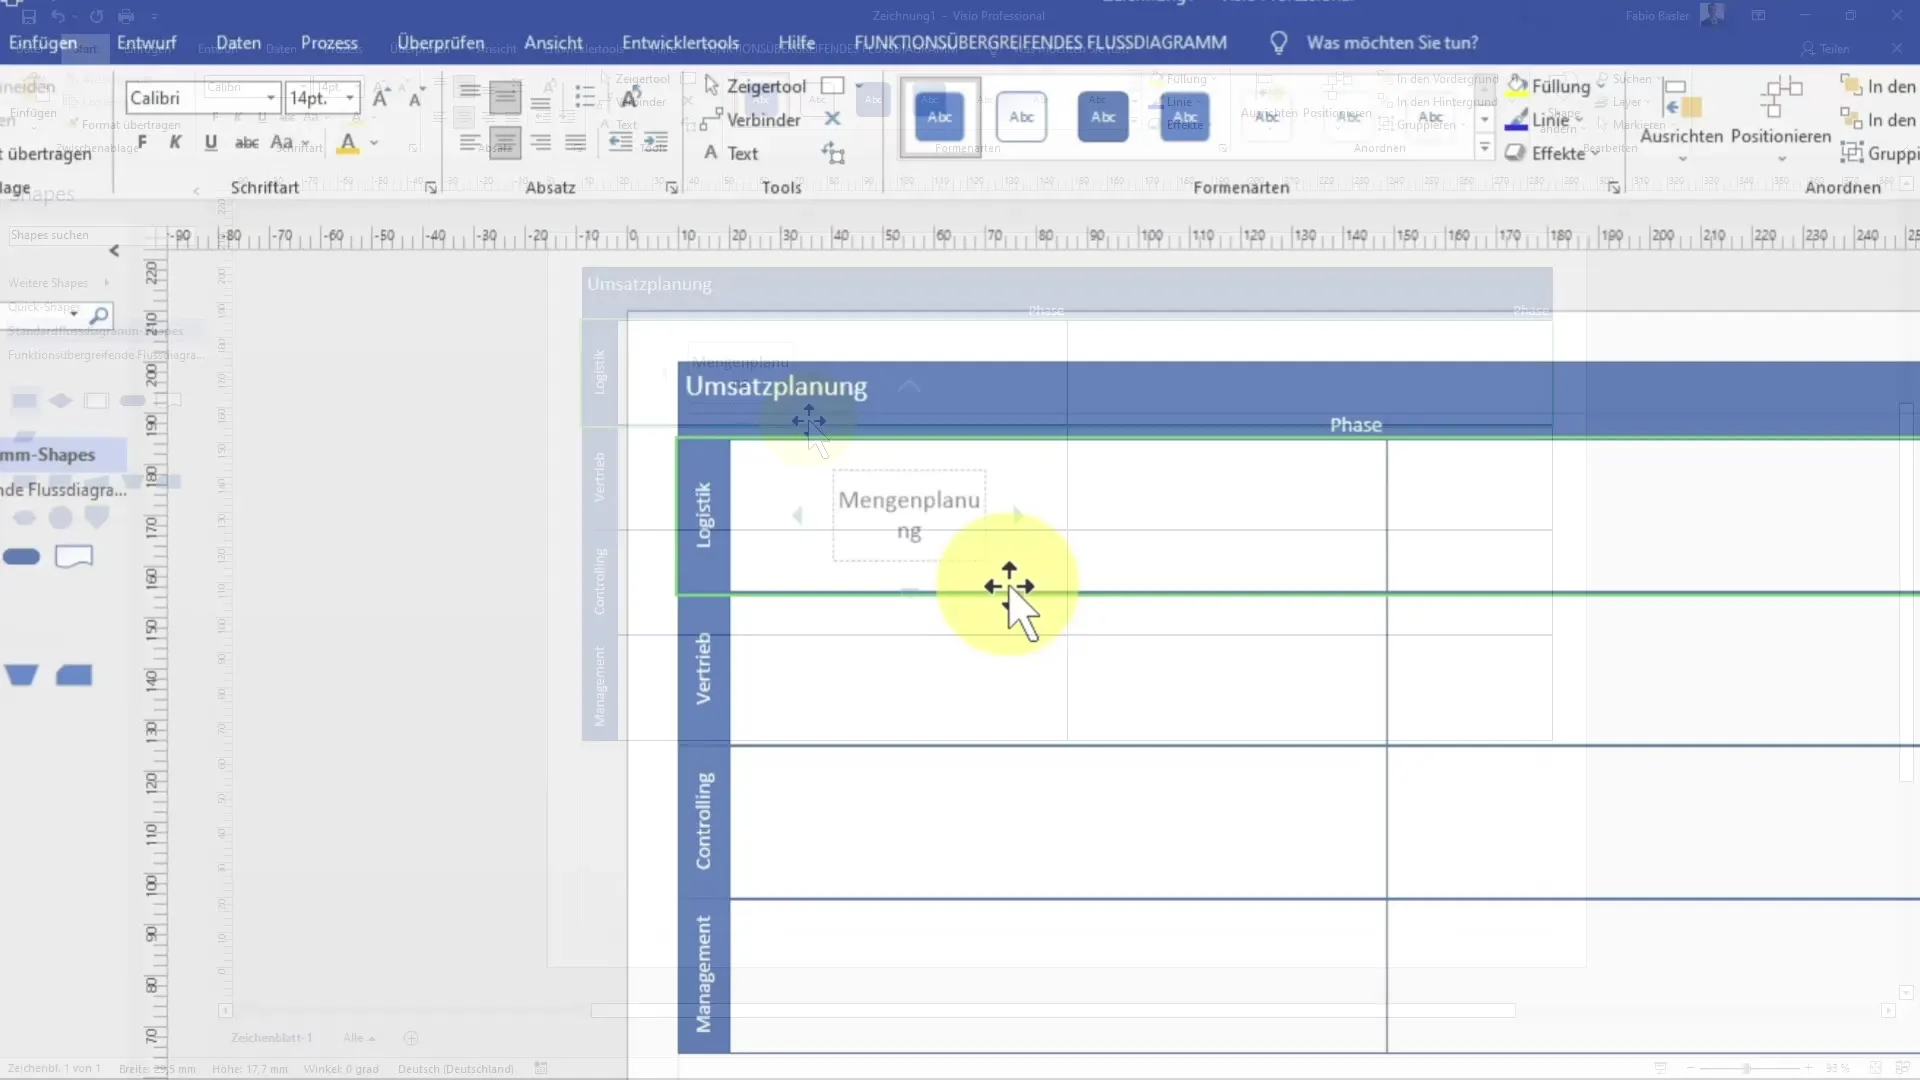
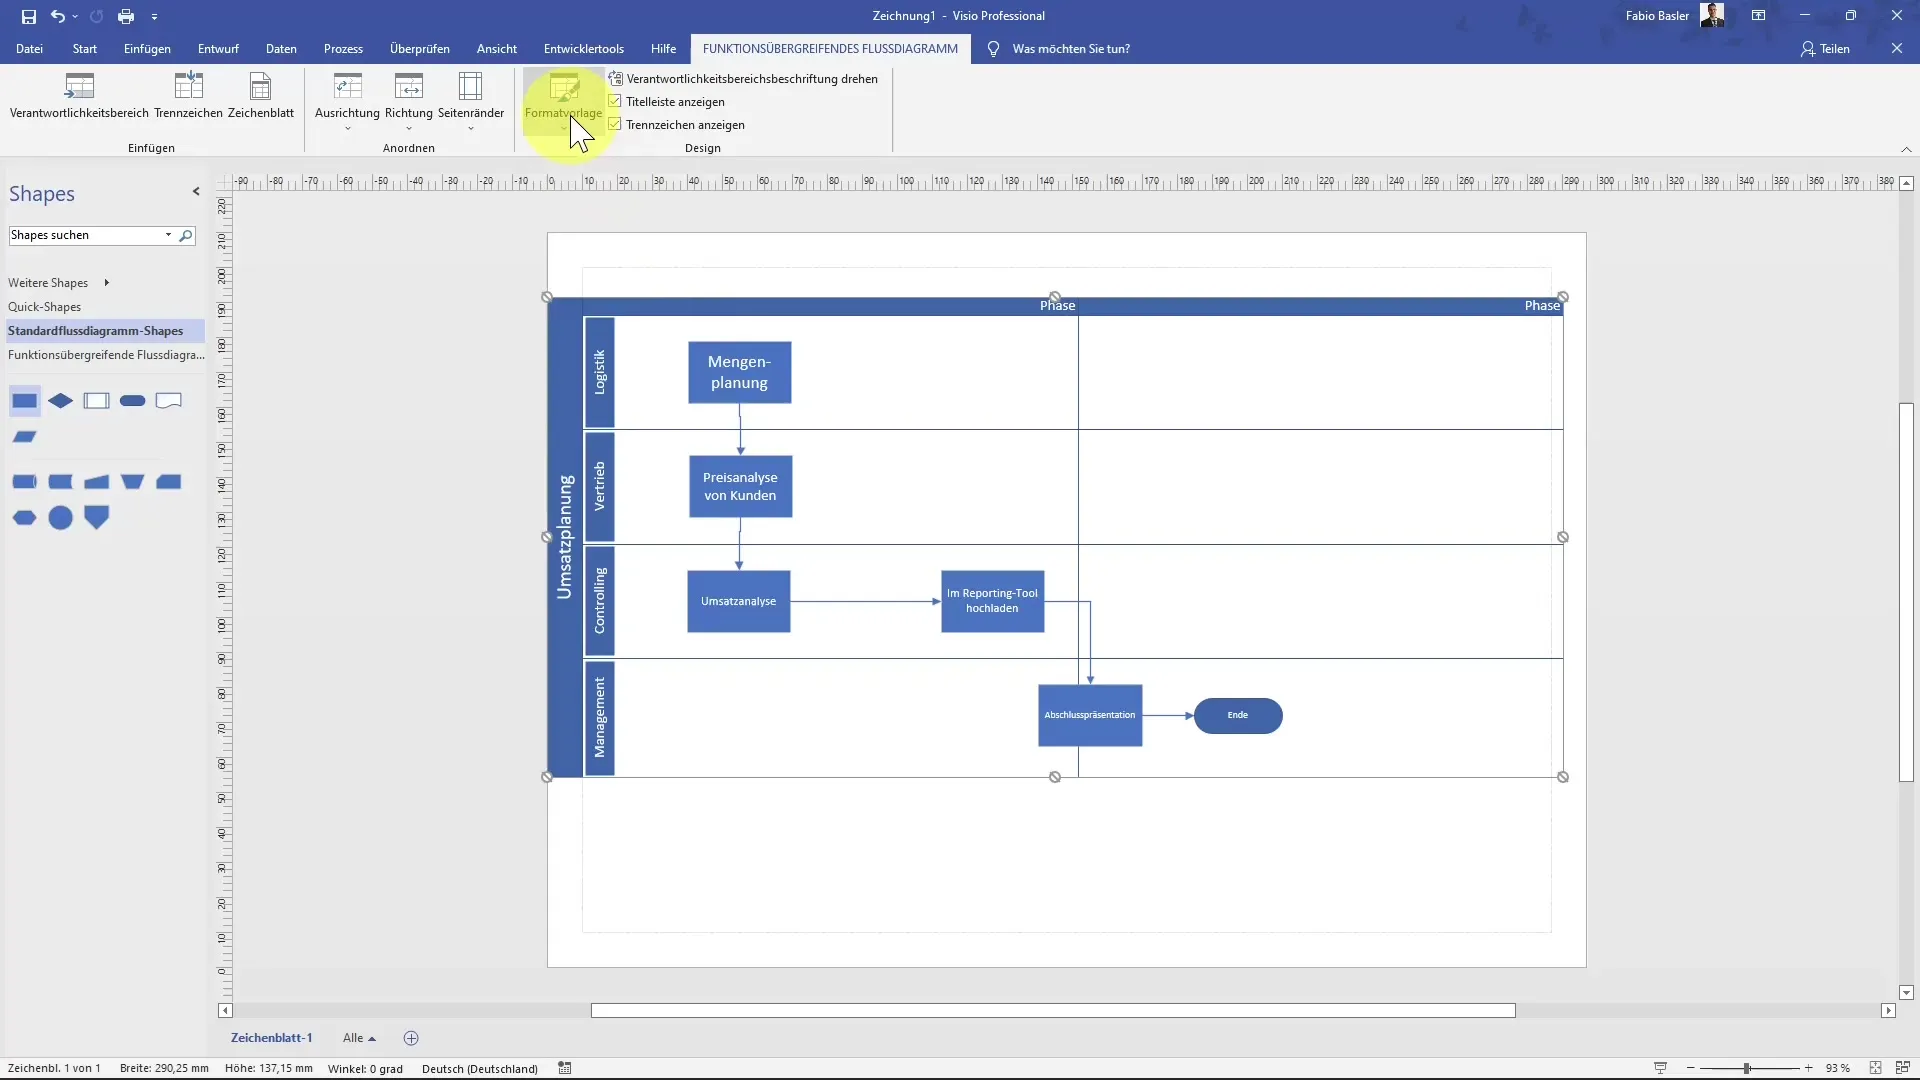
Now we move on to editing the individual shapes. You can increase the font size and change the text to present the content more clearly. For logistics, this could be "Quantity Planning," for example.
10. Integrate Further Process Steps
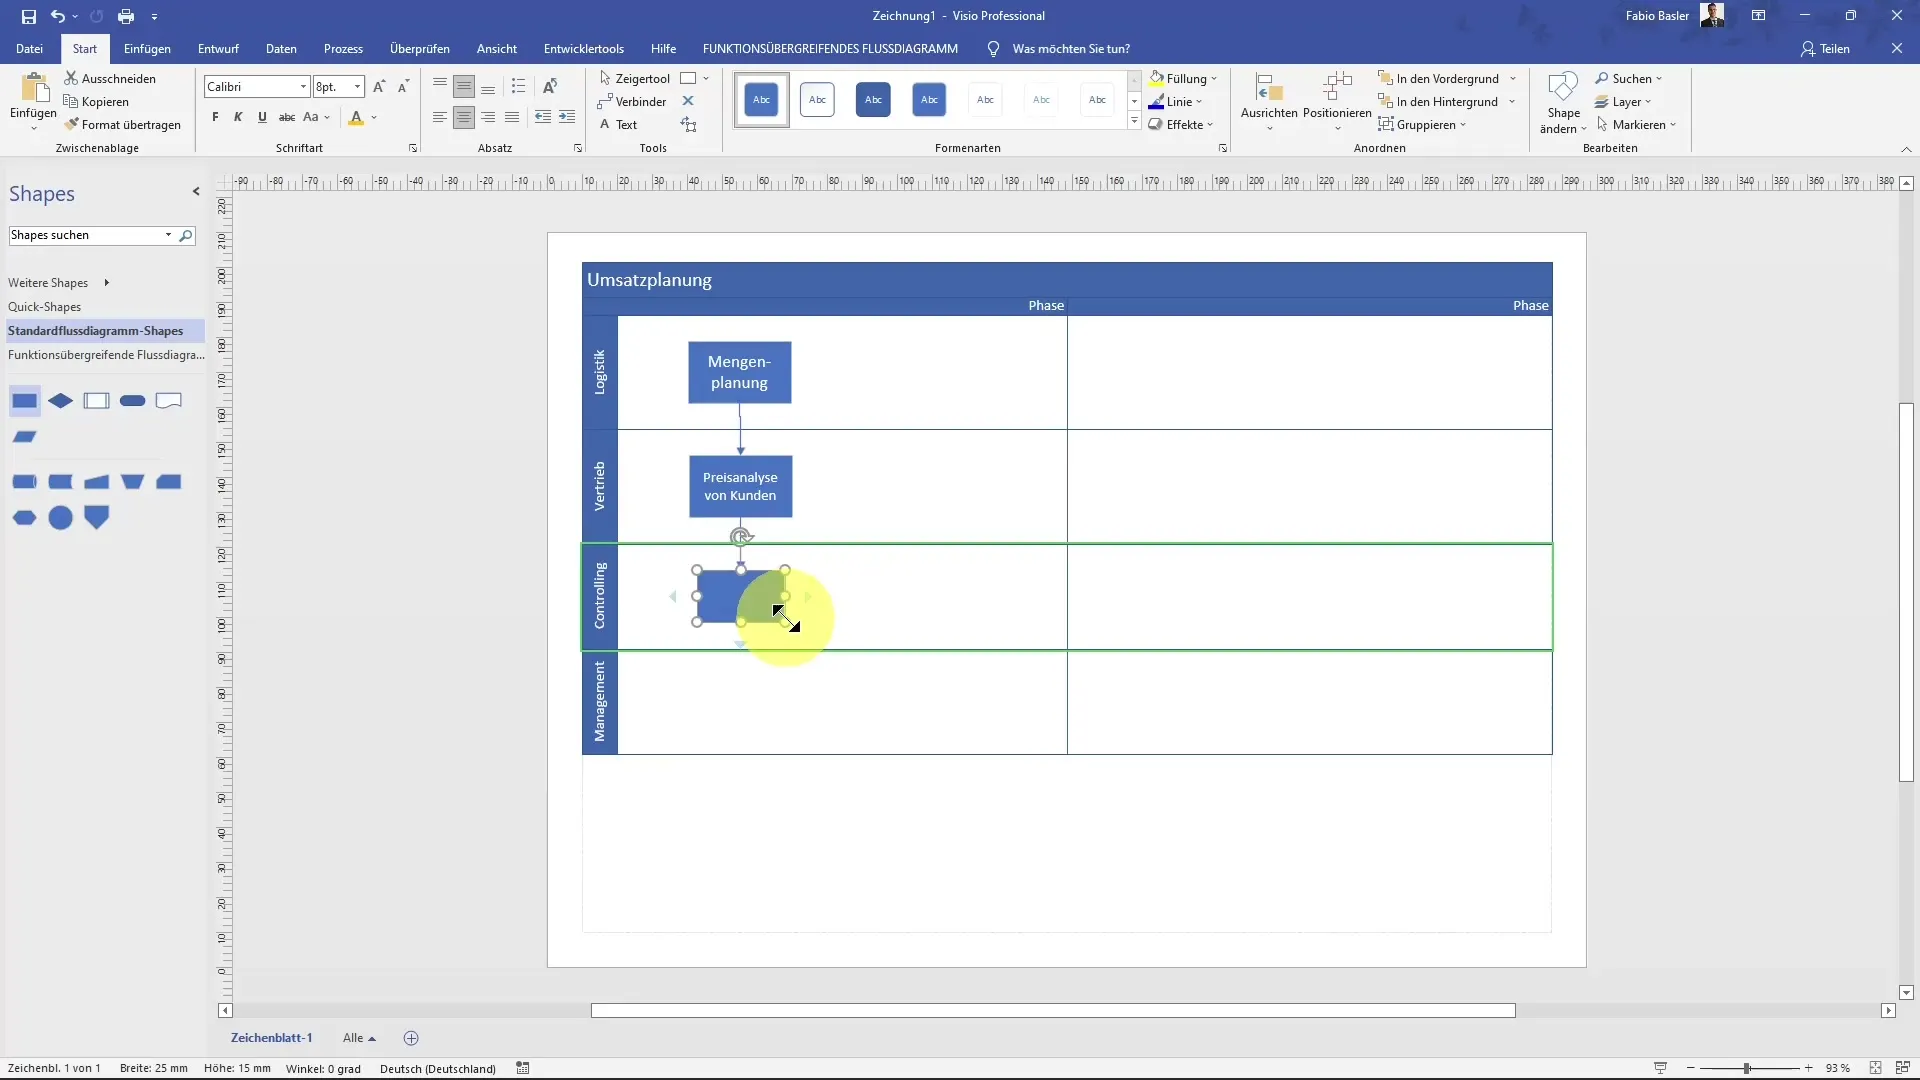
Now add the next steps in your diagram, starting with sales, where you represent customer price analysis. Make sure to adjust the font size accordingly to keep everything readable.
11. Conclusion and Final Analysis
The final revenue analysis is carried out from the controlling department, based on information from other departments. After the calculation, you can upload the data to a reporting tool or create a presentation for management.
12. Visualizing Process End
Finish the diagram by adding an "End" shape to conclude the process. This way, you can graphically summarize the entire cross-functional workflow and make changes as needed.
13. Applying Formatting Styles
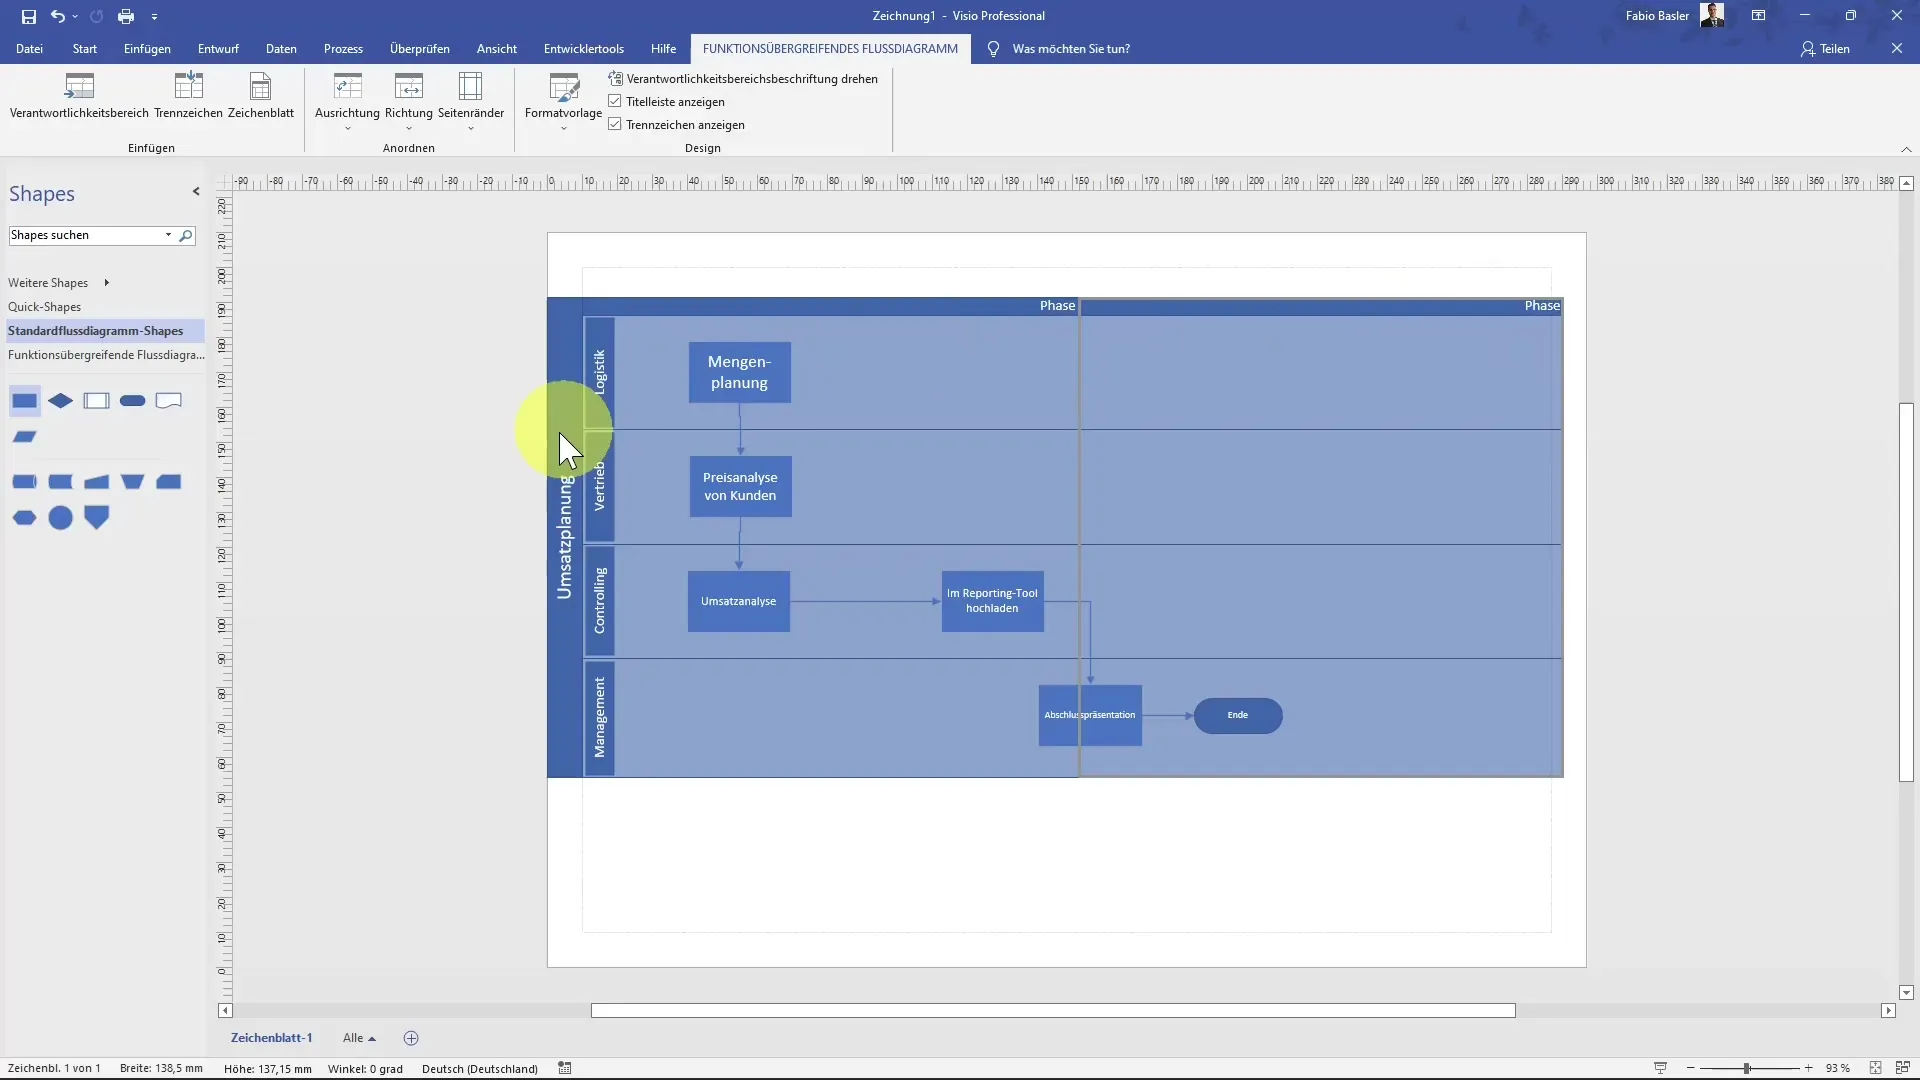
MS Visio offers a variety of formatting styles that you can apply to enhance the appearance of your diagram. Explore the different style options and choose the one that best serves your presentation.
14. Customizing Titles and Separators
In addition to formatting styles, you can also customize separators and their corresponding labels. Enjoy the opportunity to create a professional diagram that clearly showcases the phases of your process!
Summary
Creating a cross-functional flowchart in MS Visio allows you not only to visualize different company processes but also to efficiently analyze and share this data. By using shapes, separators, and adjustments, you can effectively represent your processes and promote communication between departments.
Frequently Asked Questions
What is a cross-functional flowchart?A cross-functional flowchart visualizes the interactions and processes of different departments within a company.
How do I add shapes in MS Visio?Shapes can be selected from the left sidebar and simply dragged and dropped onto the canvas.
Can I edit my diagram later?Yes, the diagram can be adjusted at any time to reflect changes in processes or departments.
Can I create multiple diagrams at once?Yes, by duplicating canvases, you can create multiple diagrams based on a template.
What can I do if shapes are not being displayed?Make sure you are in the correct shape type to display the desired shapes.
