A Gantt chart is an extremely useful tool for project management that helps you clearly visualize the chronological sequence and progress of tasks. With Microsoft Visio, you can easily create appealing and informative Gantt charts that help you keep track of your project. This guide will walk you through the process of creating a Gantt chart in Visio step by step.
Key Takeaways
- Gantt charts help visualize the chronological sequence of project tasks.
- In Visio, you can easily create and customize Gantt charts.
- It is important to carefully plan tasks, timelines, and resources to maximize clarity.
Step-by-Step Guide
First, open Microsoft Visio. If it is not already open, start the program and look for the Gantt chart template. You can find this in the menu by typing "Gantt" into the search bar.
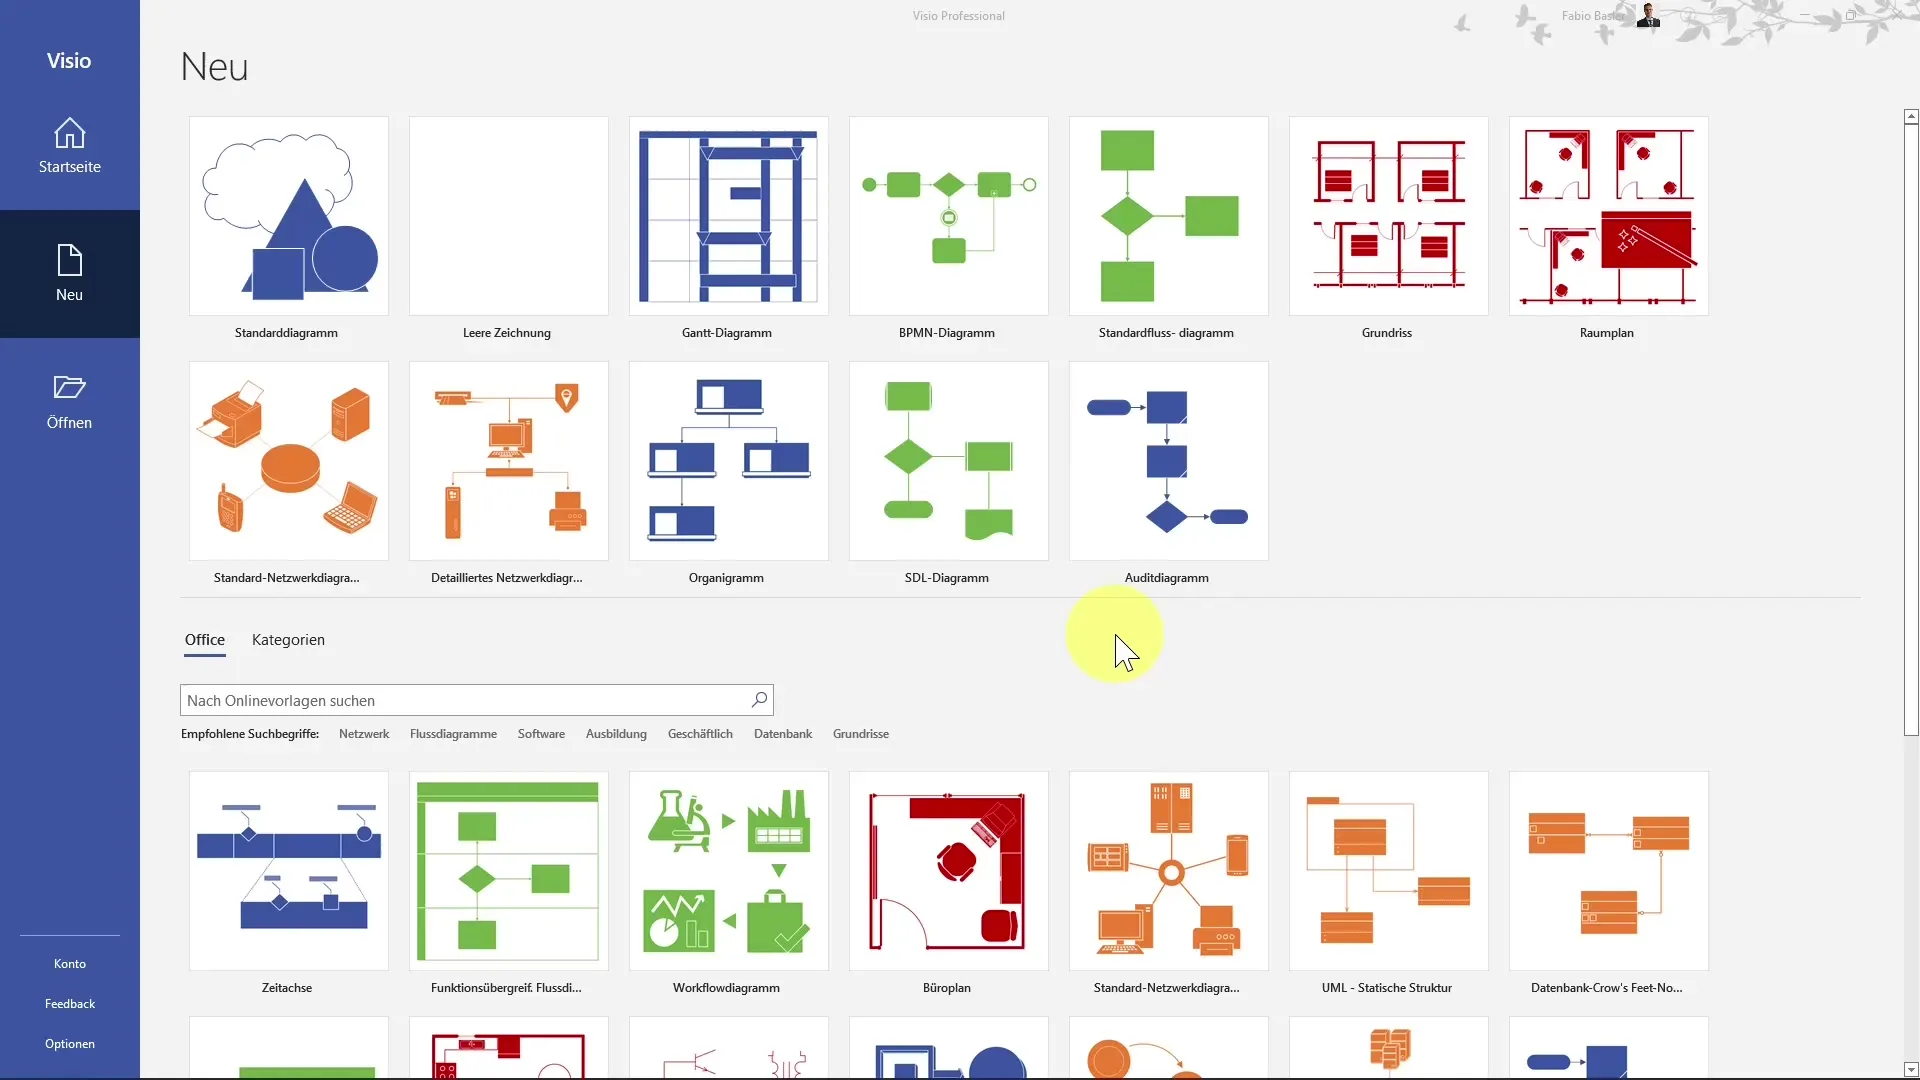
After opening Visio, you will see various templates. Select a blank Gantt chart and click "Create" to activate the Gantt area.
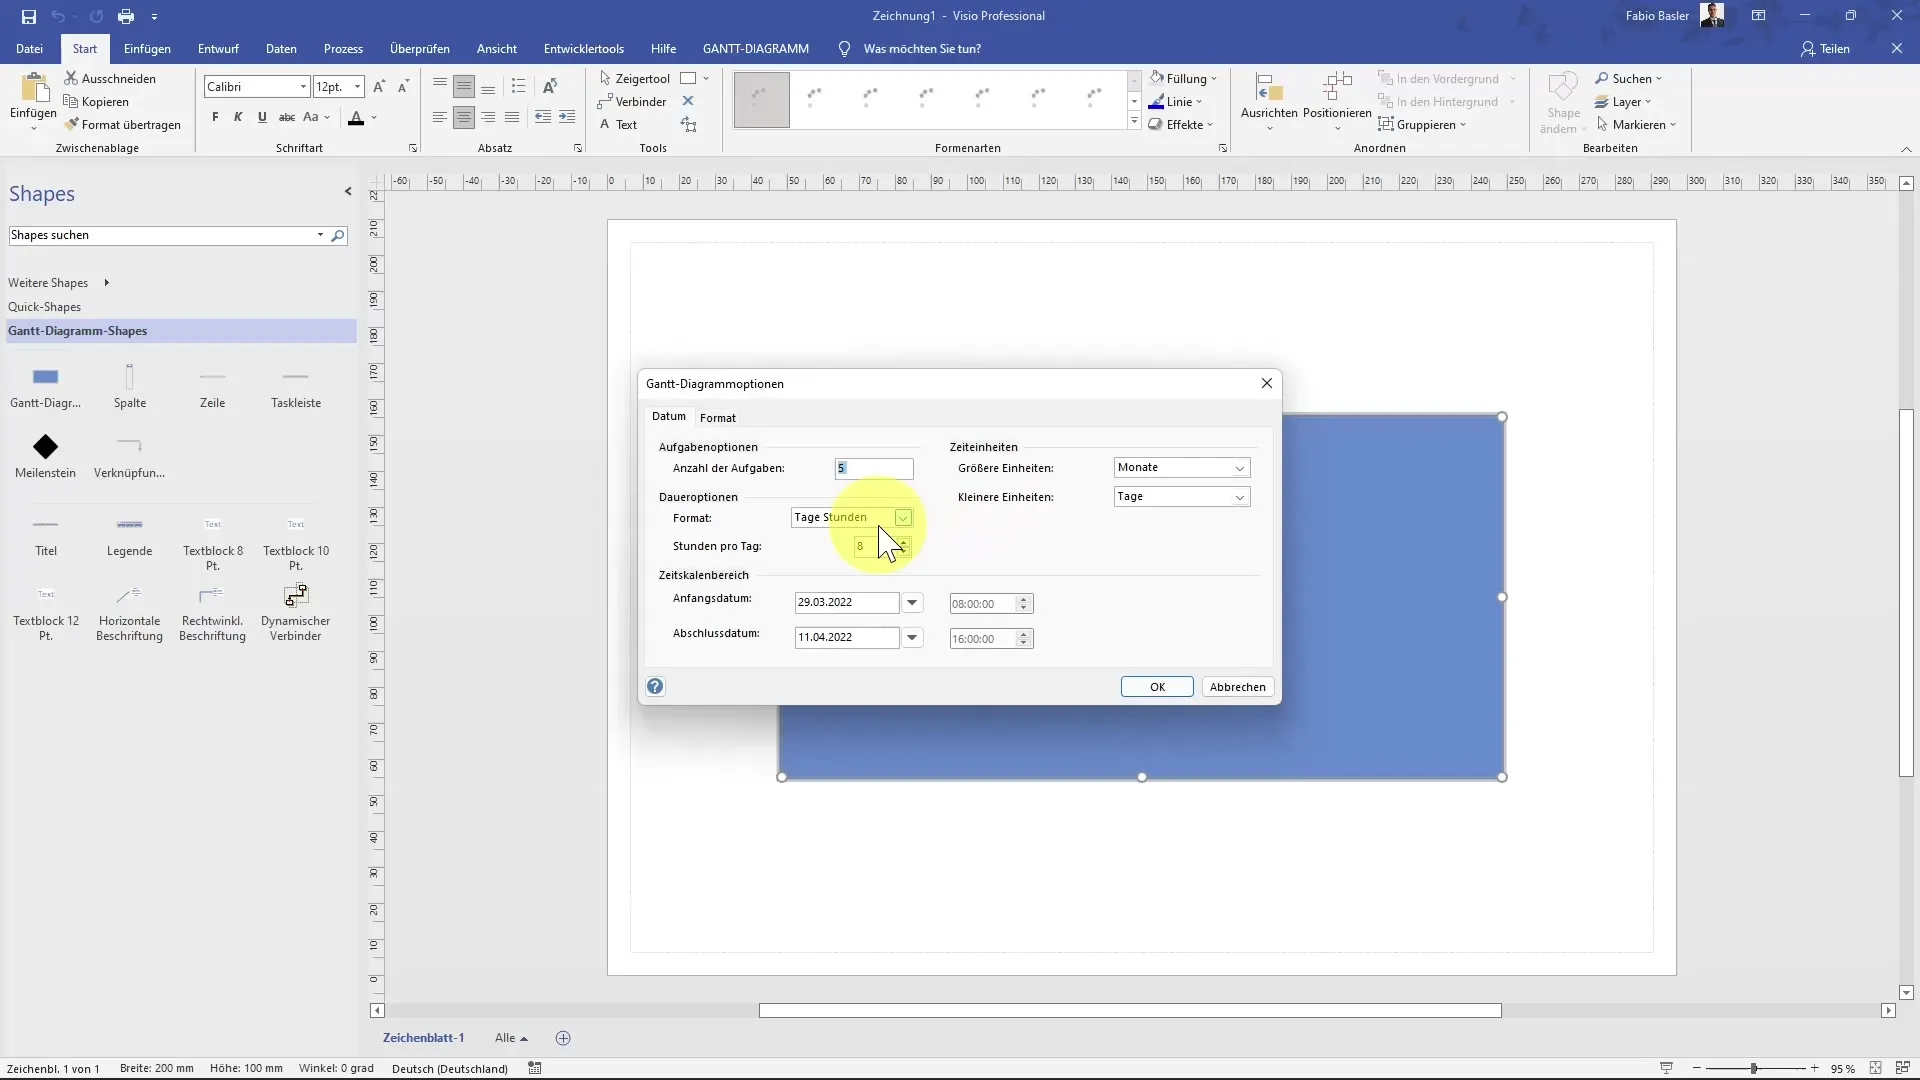
Now you can configure the Gantt chart options. First, you need to specify the number of tasks in your project. This information is crucial to create an accurate chart.
To set the daily working hours, you should specify the hours per day – typically 8 hours. Define the project timeframe as well. For example, you could specify that your project starts on March 29, 2022, and ends on April 15, 2022.
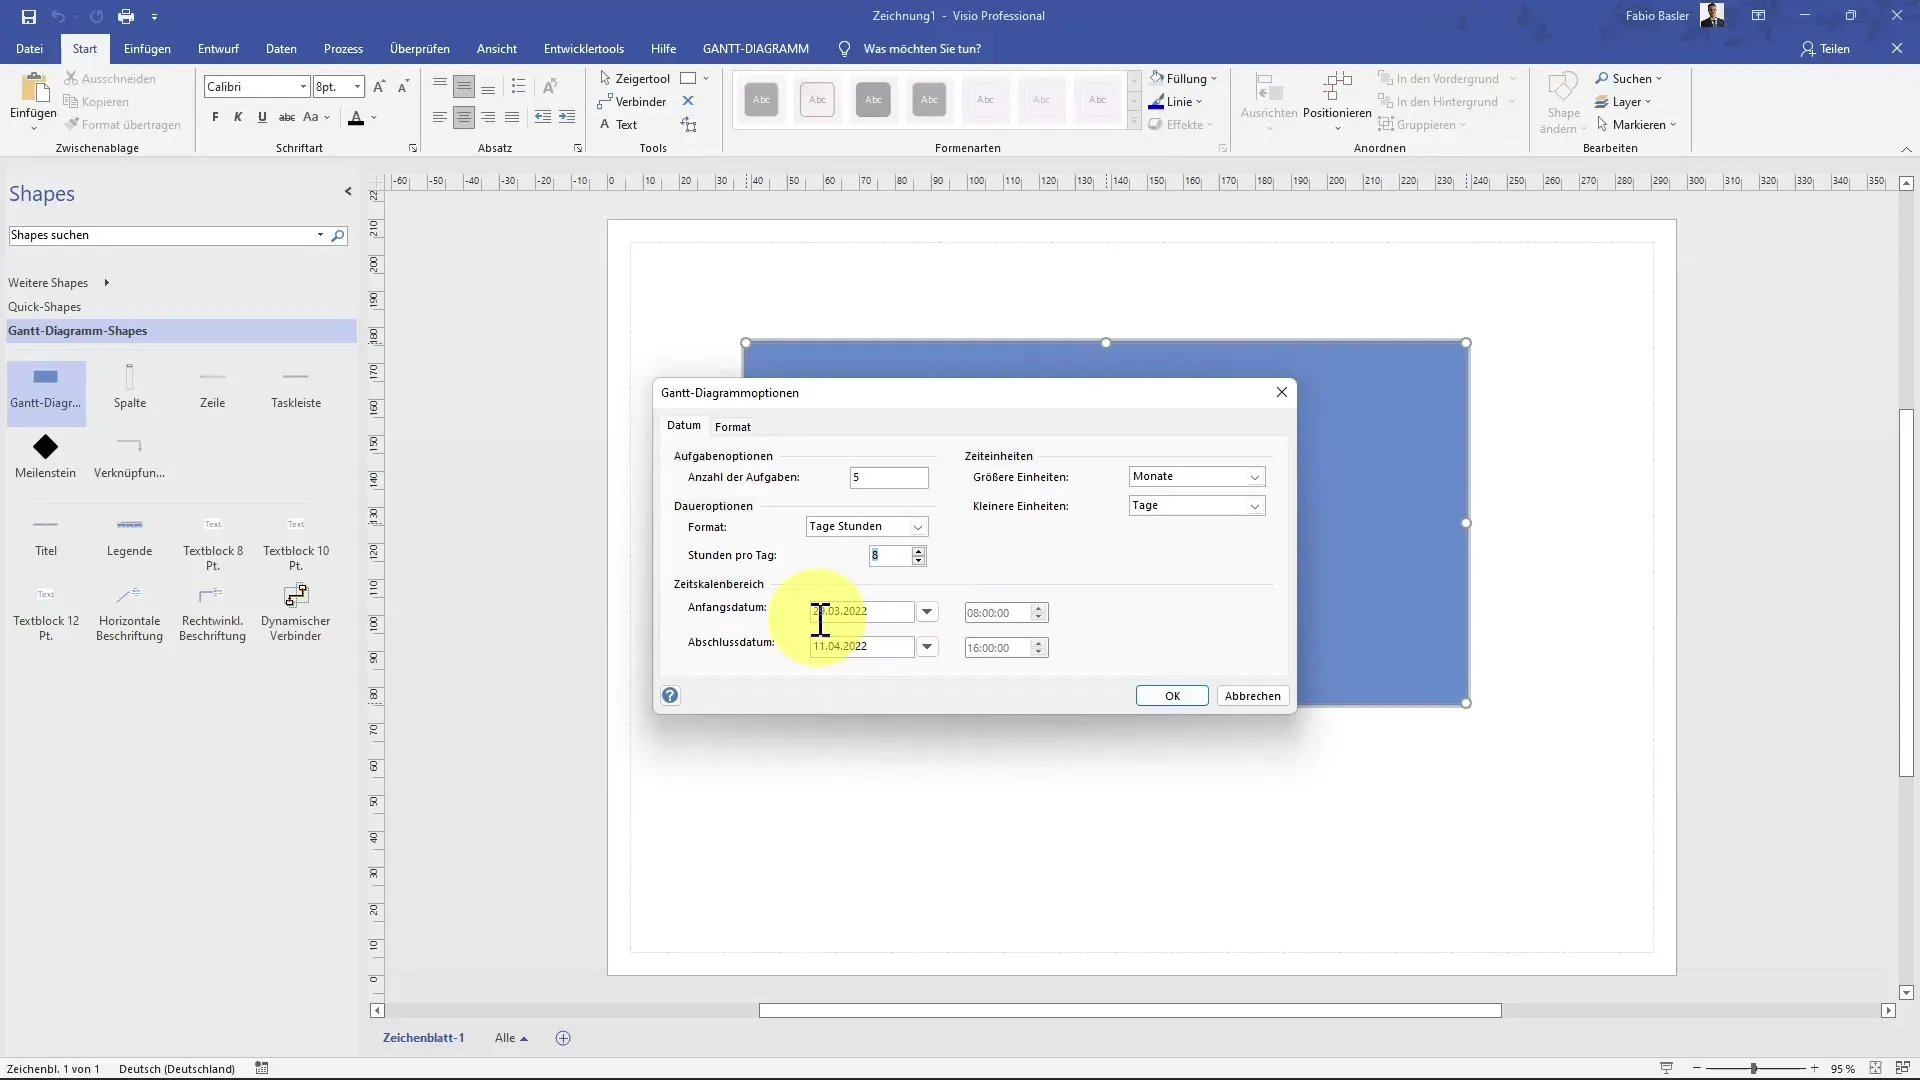
Under time units, you can determine both larger units such as months and smaller ones like days. Once you have provided all the necessary information, click "OK," and your Gantt chart will be created.
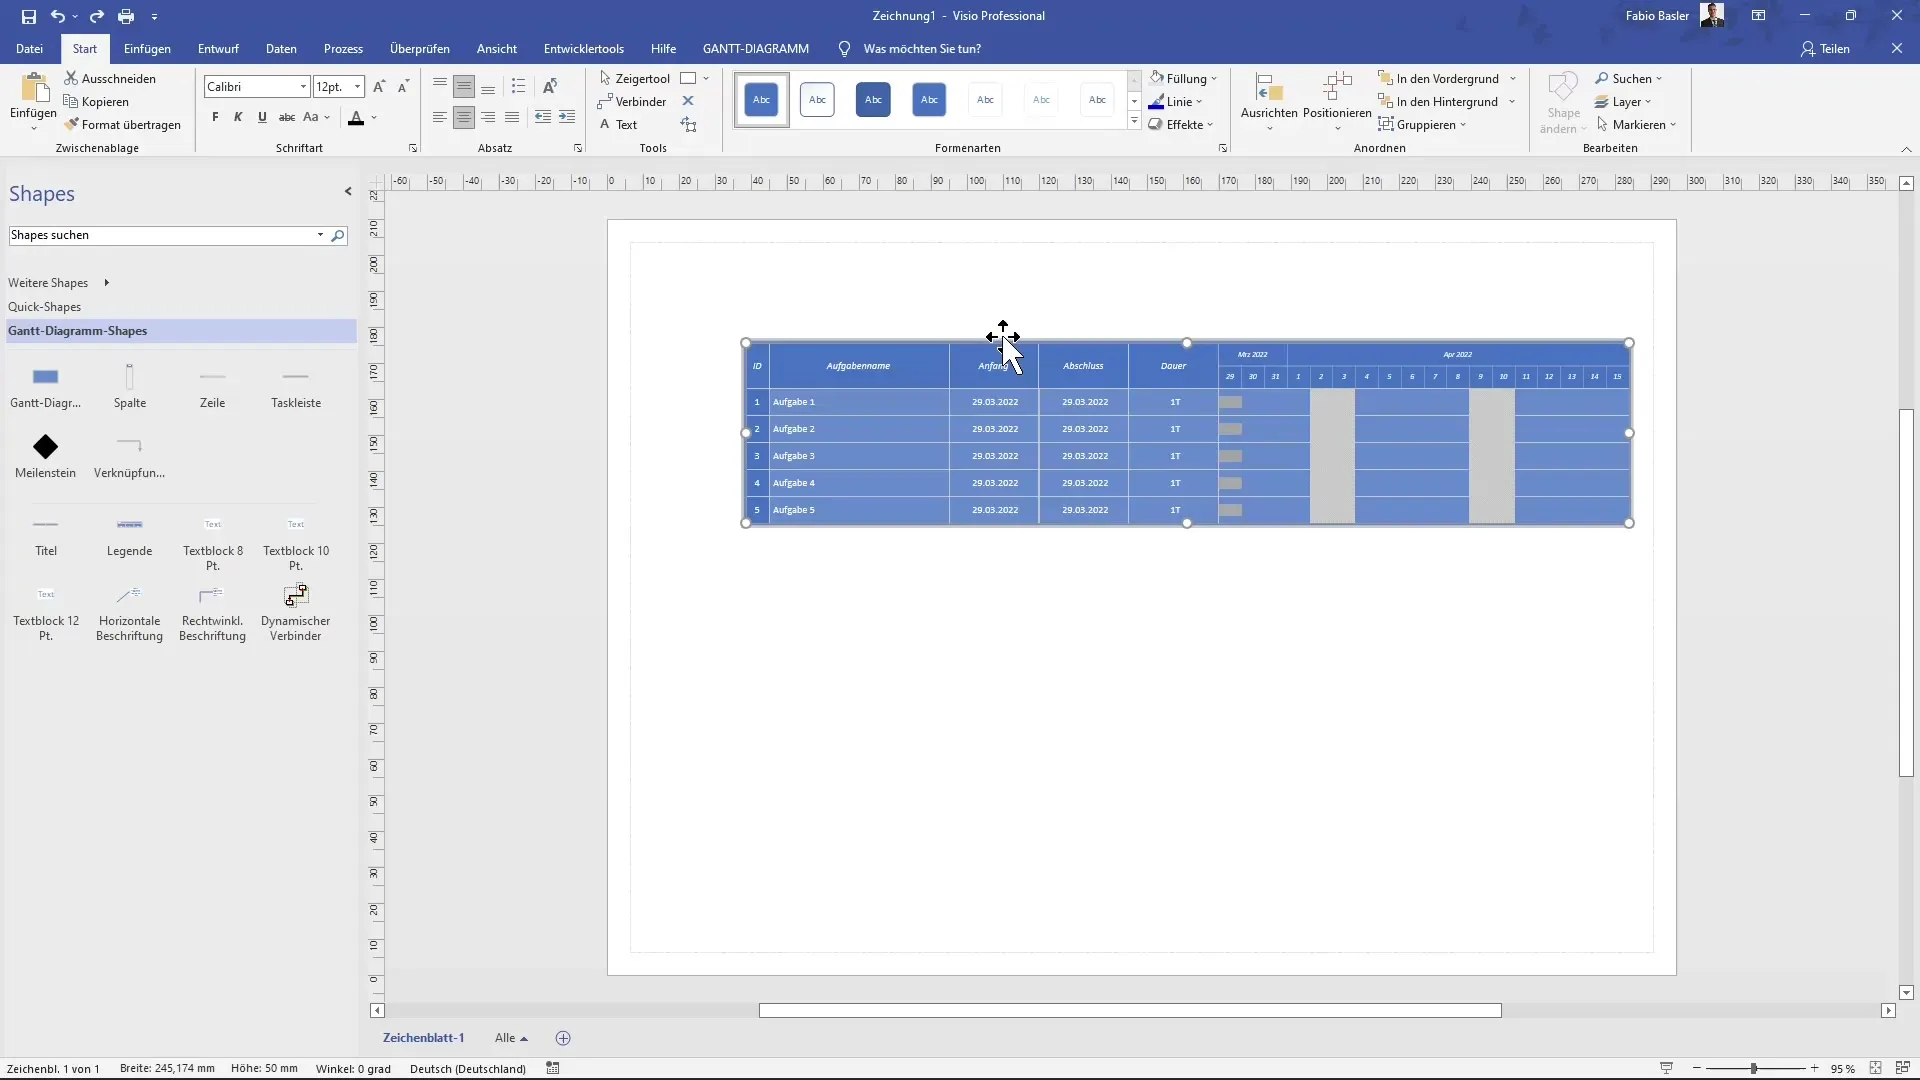
The Gantt chart now displays columns for ID, task names, start and finish dates, and task duration. You will initially see the ID column followed by an area where you can enter the name of a specific task.
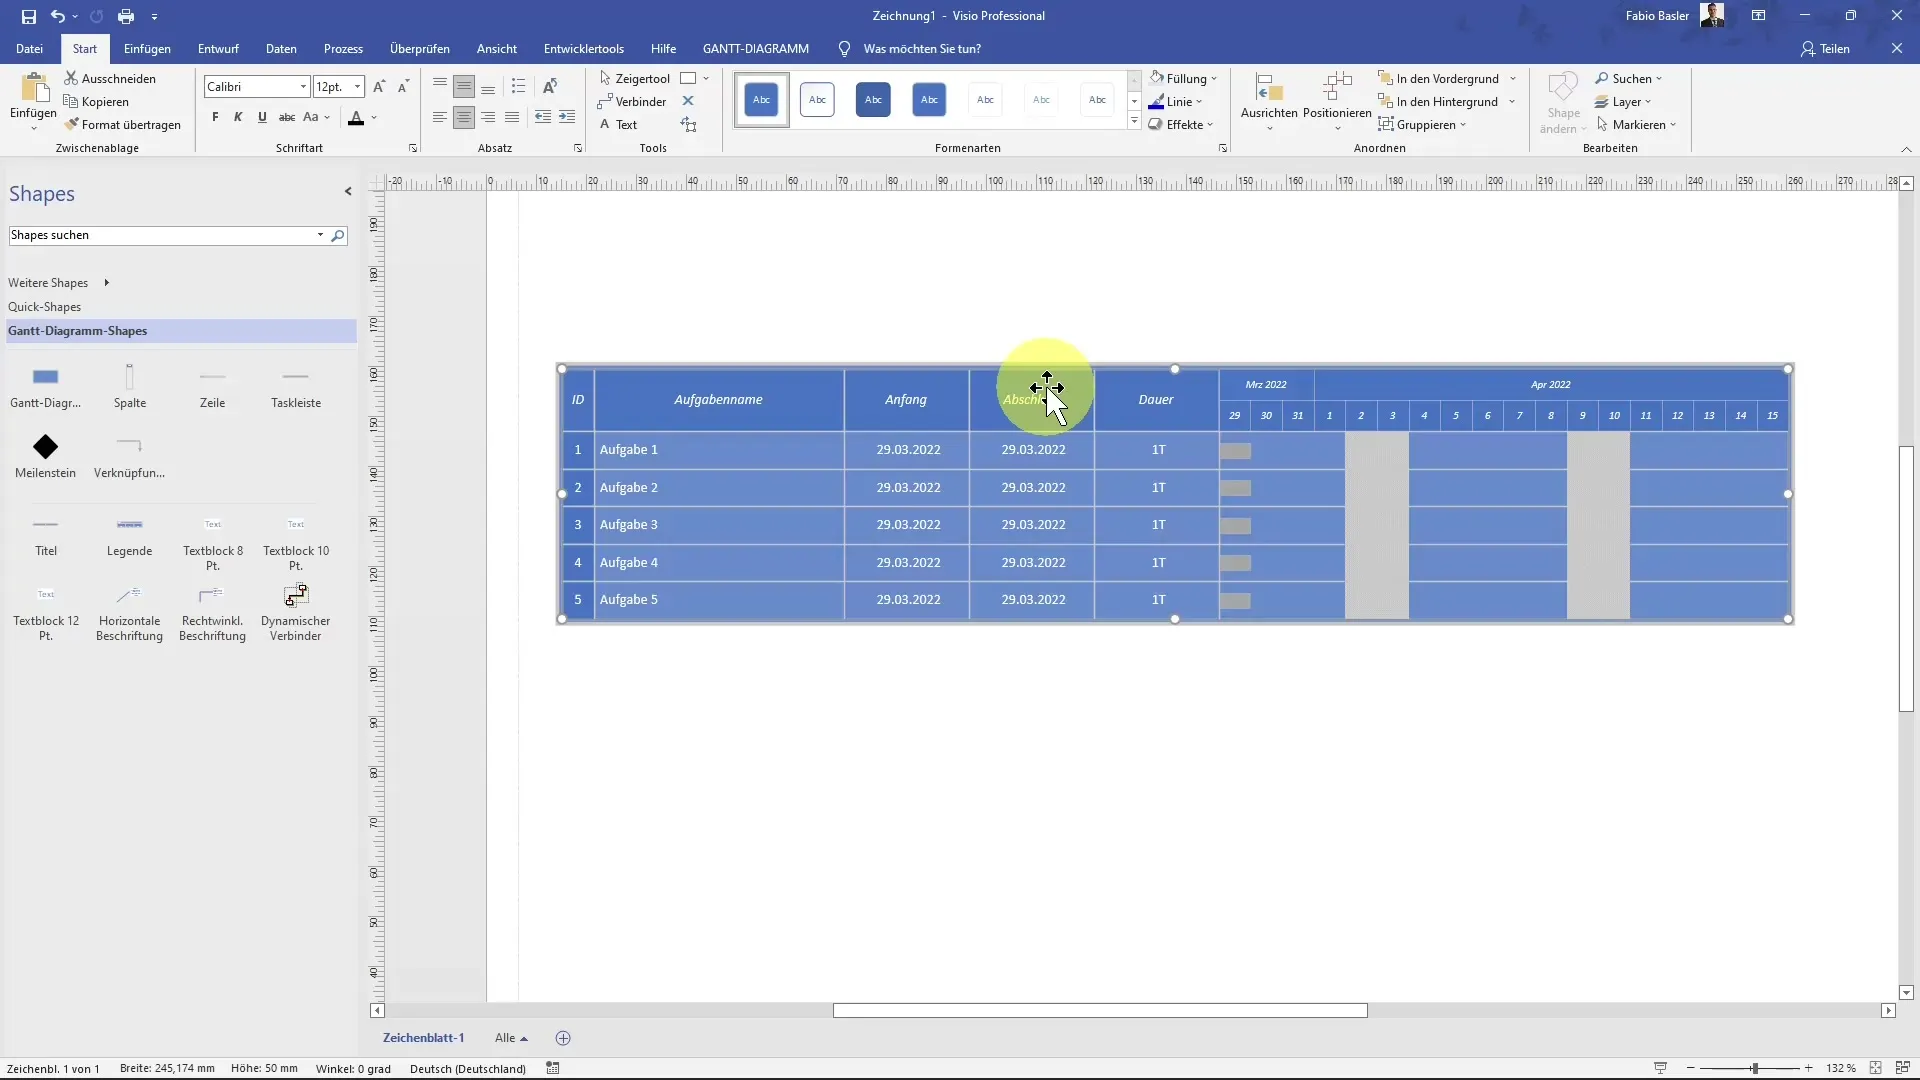
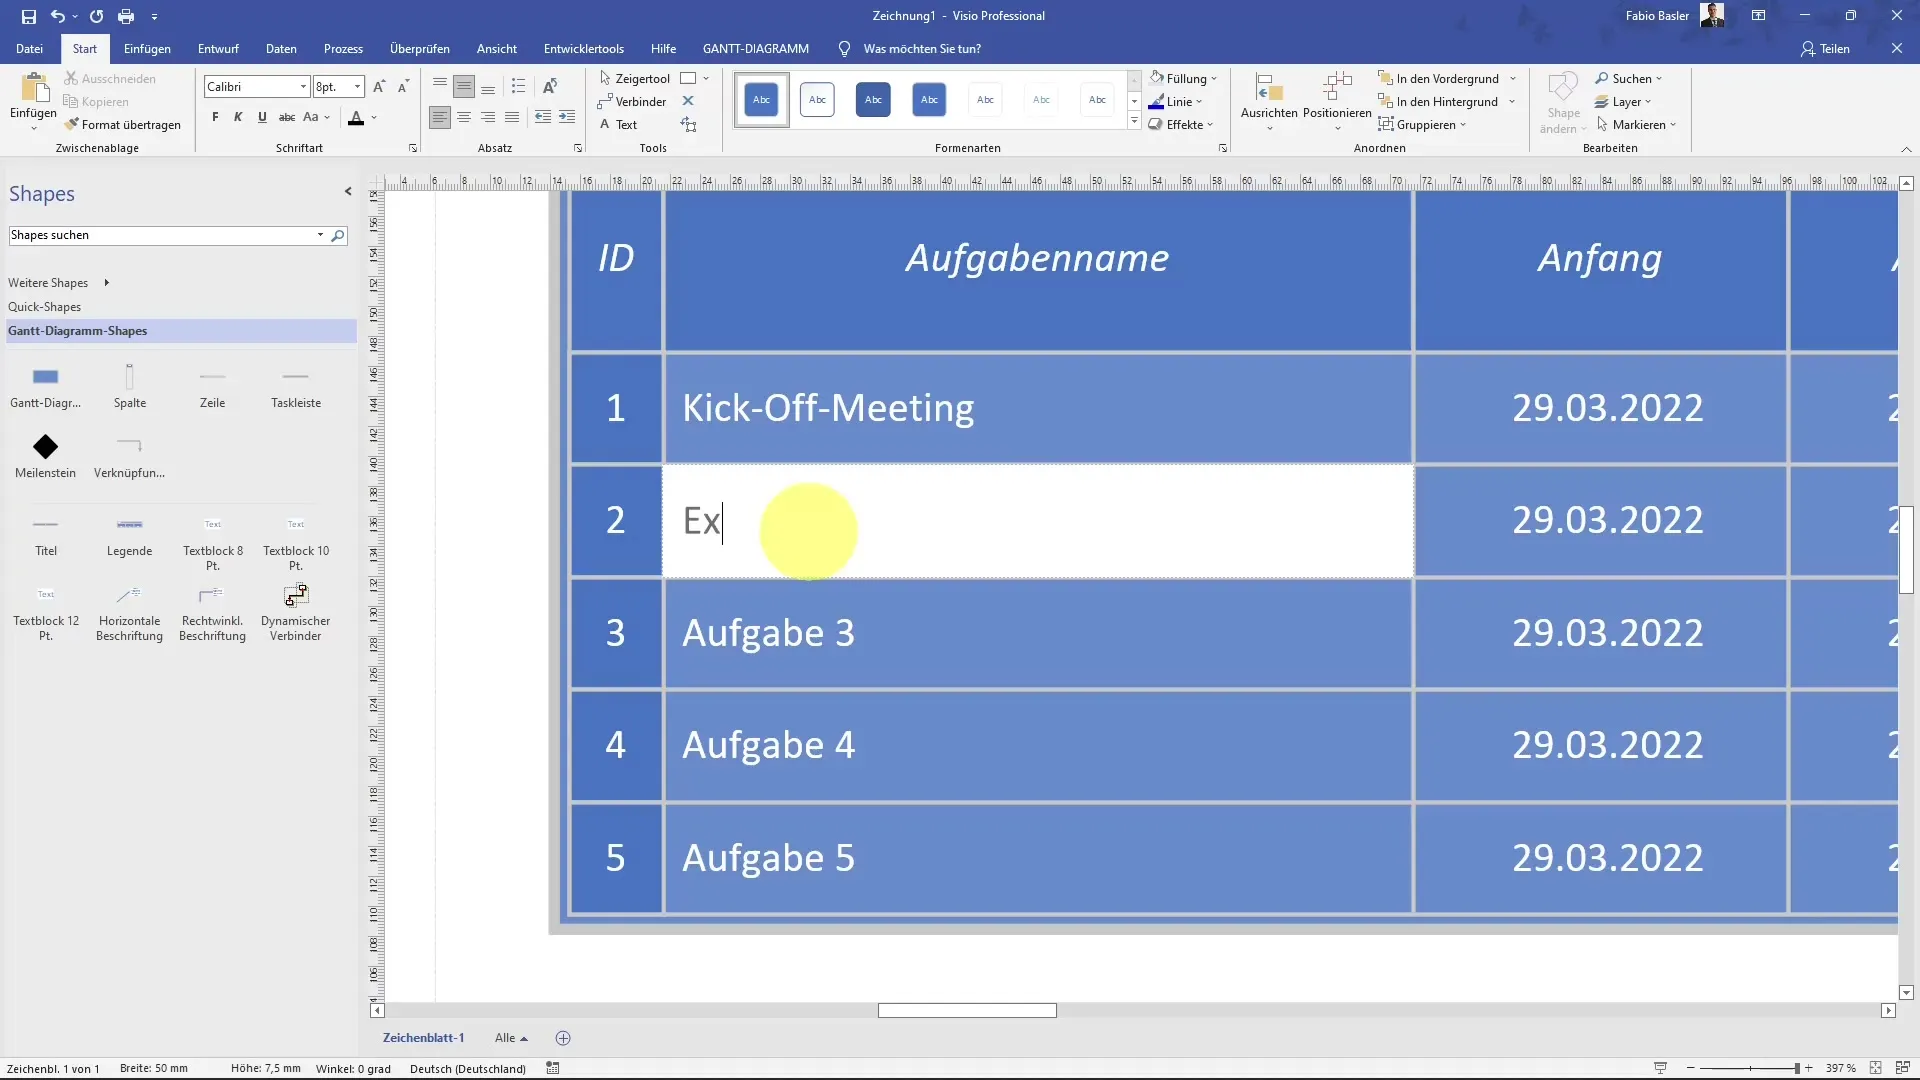
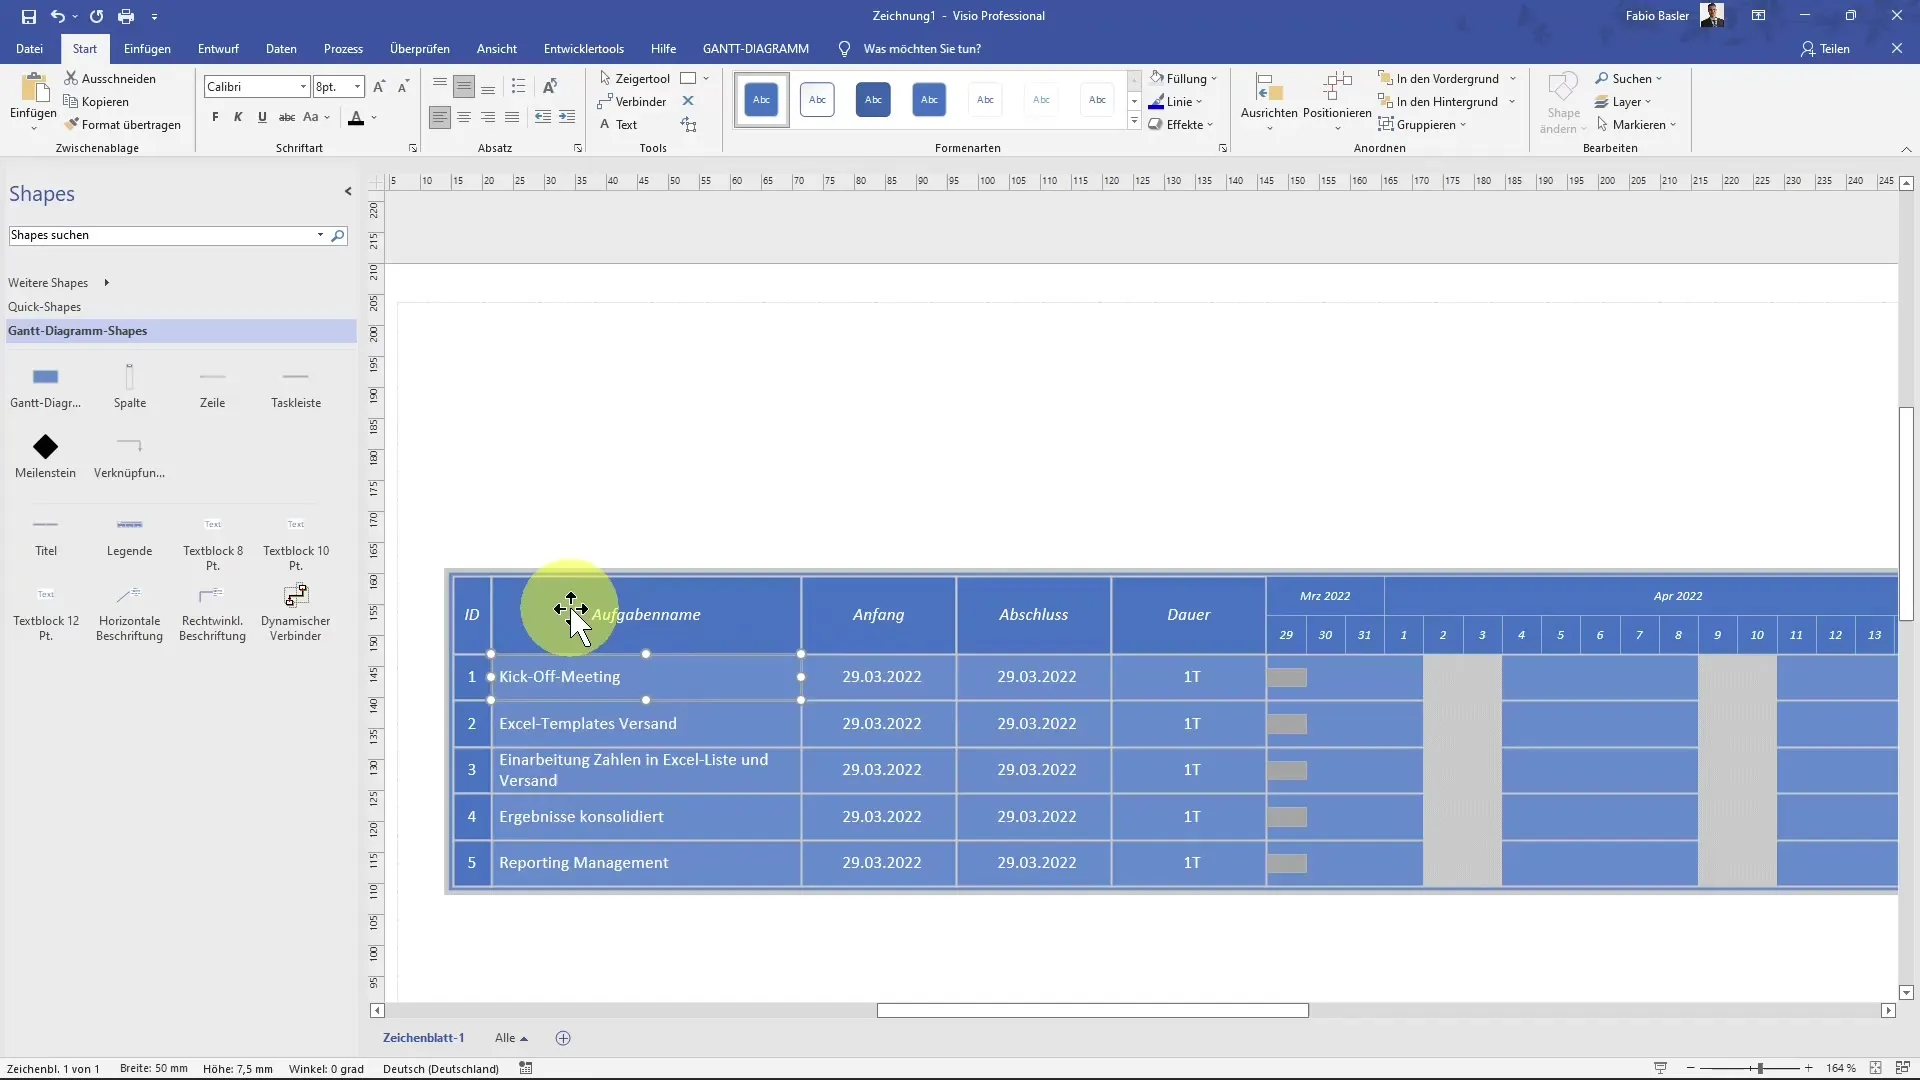
Now you start entering the specific tasks of your project. For example, you could start with a "Kickoff Meeting" and add subsequent tasks such as sending Excel templates to external partners and data integration.
For each task, specify the start and end times of the task. The Kickoff Meeting could thus take place on March 29, followed by the task of sending the Excel templates on March 30.
You can also flexibly adjust the durations needed for specific tasks to optimize the representation. For example, a task could take 5 days to complete.
When you change the length of a task, you will immediately see how this affects your Gantt chart. Visio visualizes these changes by adjusting the bar lengths.
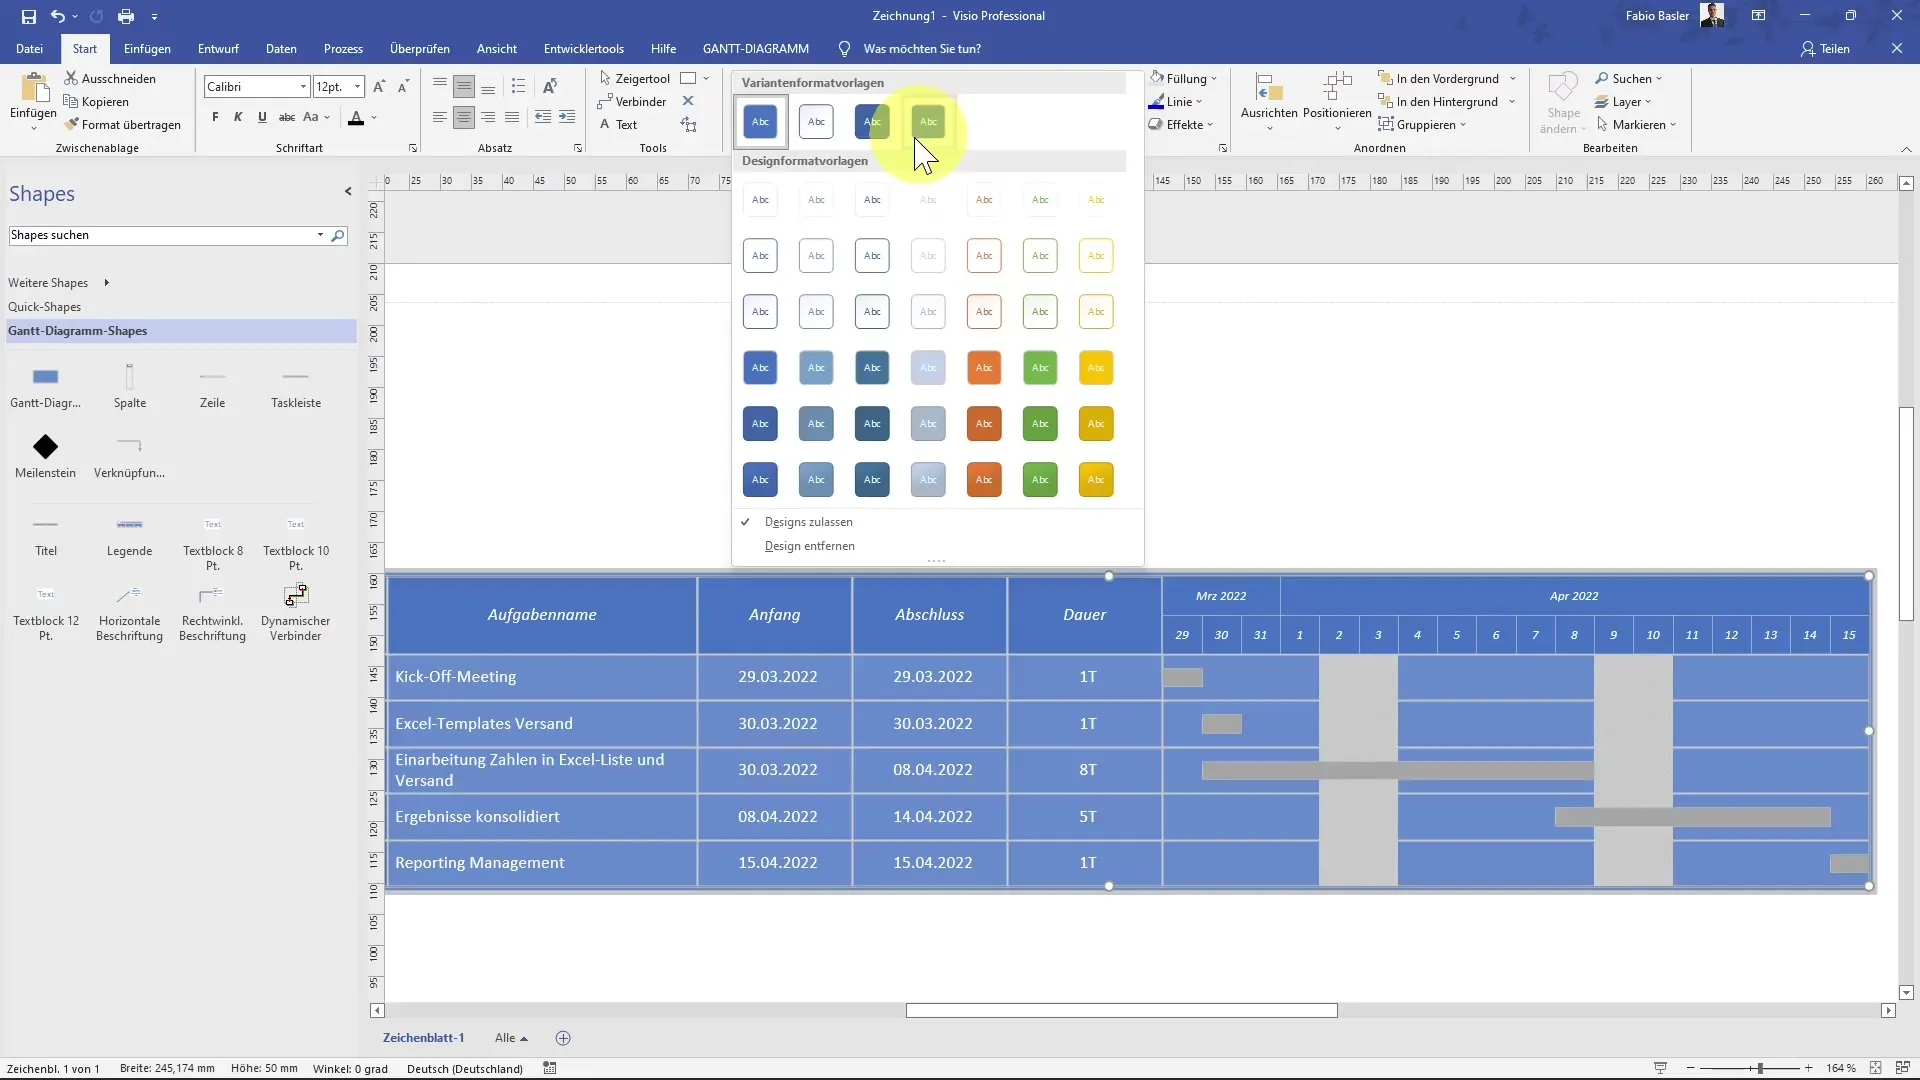
Through the various formatting options, you can customize the visual appearance of your Gantt chart. Custom designs help you align the chart with your company's corporate identity.
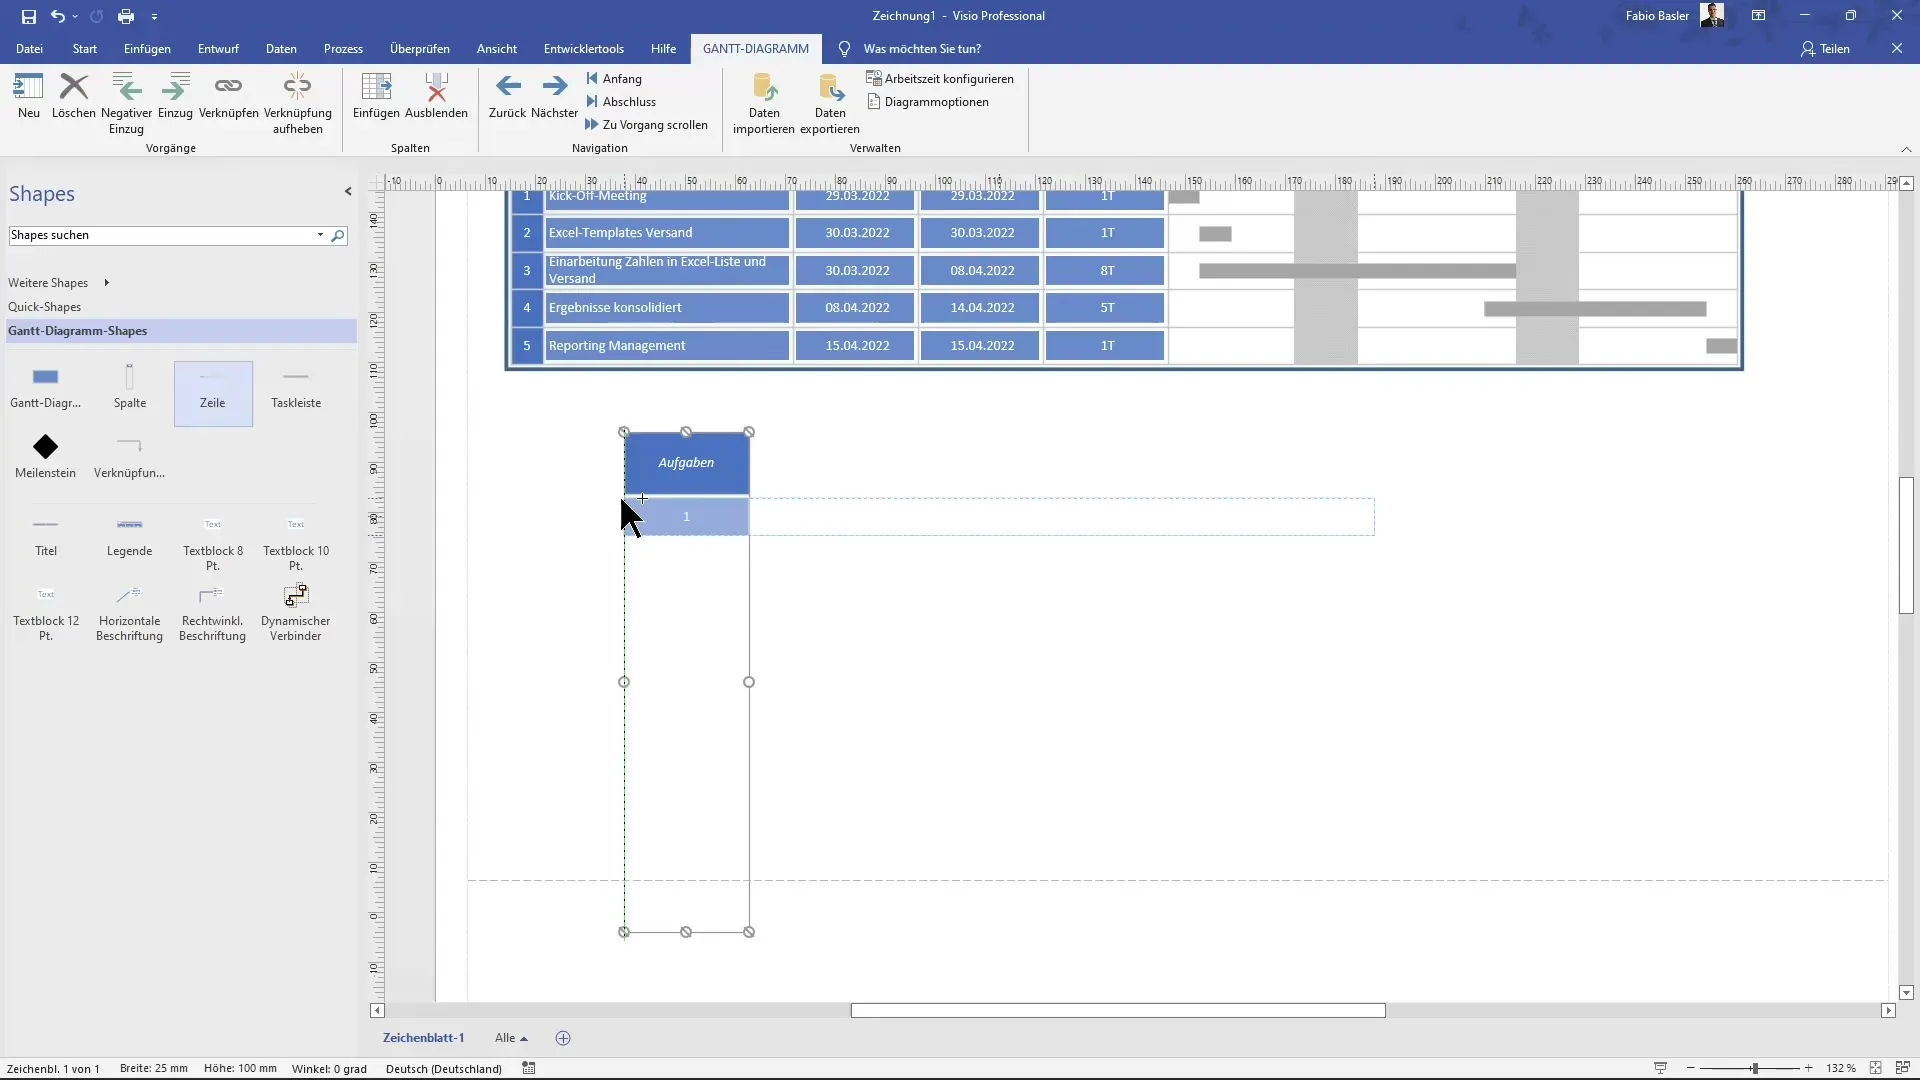
Switch to the "Gantt Chart" tab in the ribbon to utilize specific customizations and functions. Here, you can add new tasks or remove old ones, adjust the structure, and change the order of tasks.
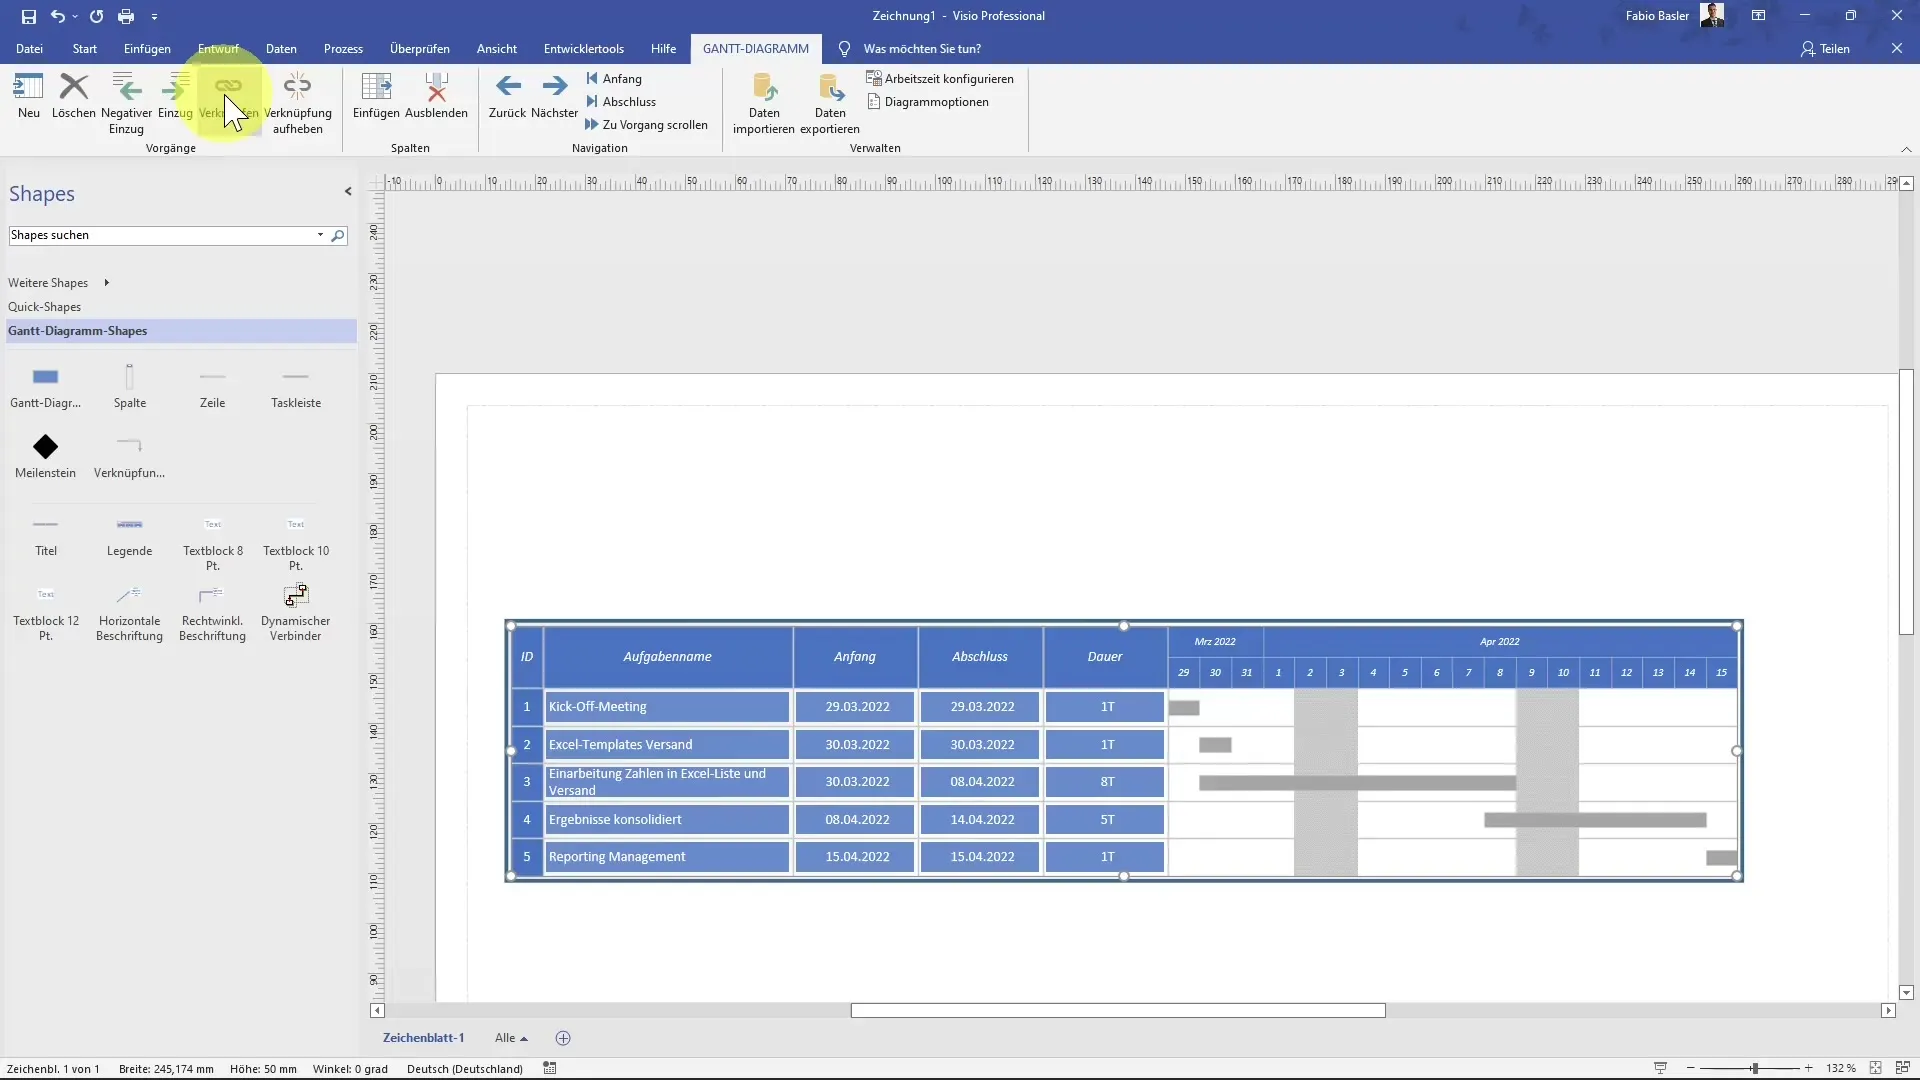
You also have the option to import tasks or add other data. This feature can be very helpful if you already have data from Excel or other programs.
Once you are satisfied with all aspects of your diagram, you can save your project and make it available for further presentations or sharing with your team. This ensures that all parties are on the same page.
Summary
This tutorial has shown you how to effectively create a Gantt chart in Microsoft Visio. From basic settings to final presentation, you could follow all the steps to responsibly plan your projects.
Frequently Asked Questions
How can I create a Gantt chart in Visio?Open Visio, look for the Gantt chart preview, select it, and add your tasks.
What are the key elements of a Gantt chart?IDs, task names, start and end dates, and task duration.
Can I customize a Gantt chart?Yes, you can add or remove tasks and customize the design and colors.
How do I save my Gantt chart?You can save your chart through the "File" option in the menu.
Can I import data from Excel?Yes, you can import data to create or edit your Gantt chart.
