If you want to be successful in the digital world, it is crucial to use the right tools to analyze your data. Google Analytics 4 offers you a variety of options to understand user behavior on your website and optimize your marketing strategies. In this guide, I will give you a first overview of the user interface of Google Analytics 4 and explain how you can use the various functions.
Key Insights
- Google Analytics 4 has a modernized user interface that differs from Universal Analytics.
- There are various reporting options categorized into Acquisition, Engagement, and Monetization.
- You can create detailed user analyses and reports that provide important insights.
- Configuring events and conversions is a central part of your analyses.
Step-by-Step Guide to the Google Analytics 4 User Interface
During your first tour of Google Analytics 4, you will notice that the user interface has been greatly simplified to help you navigate and find relevant information more easily.
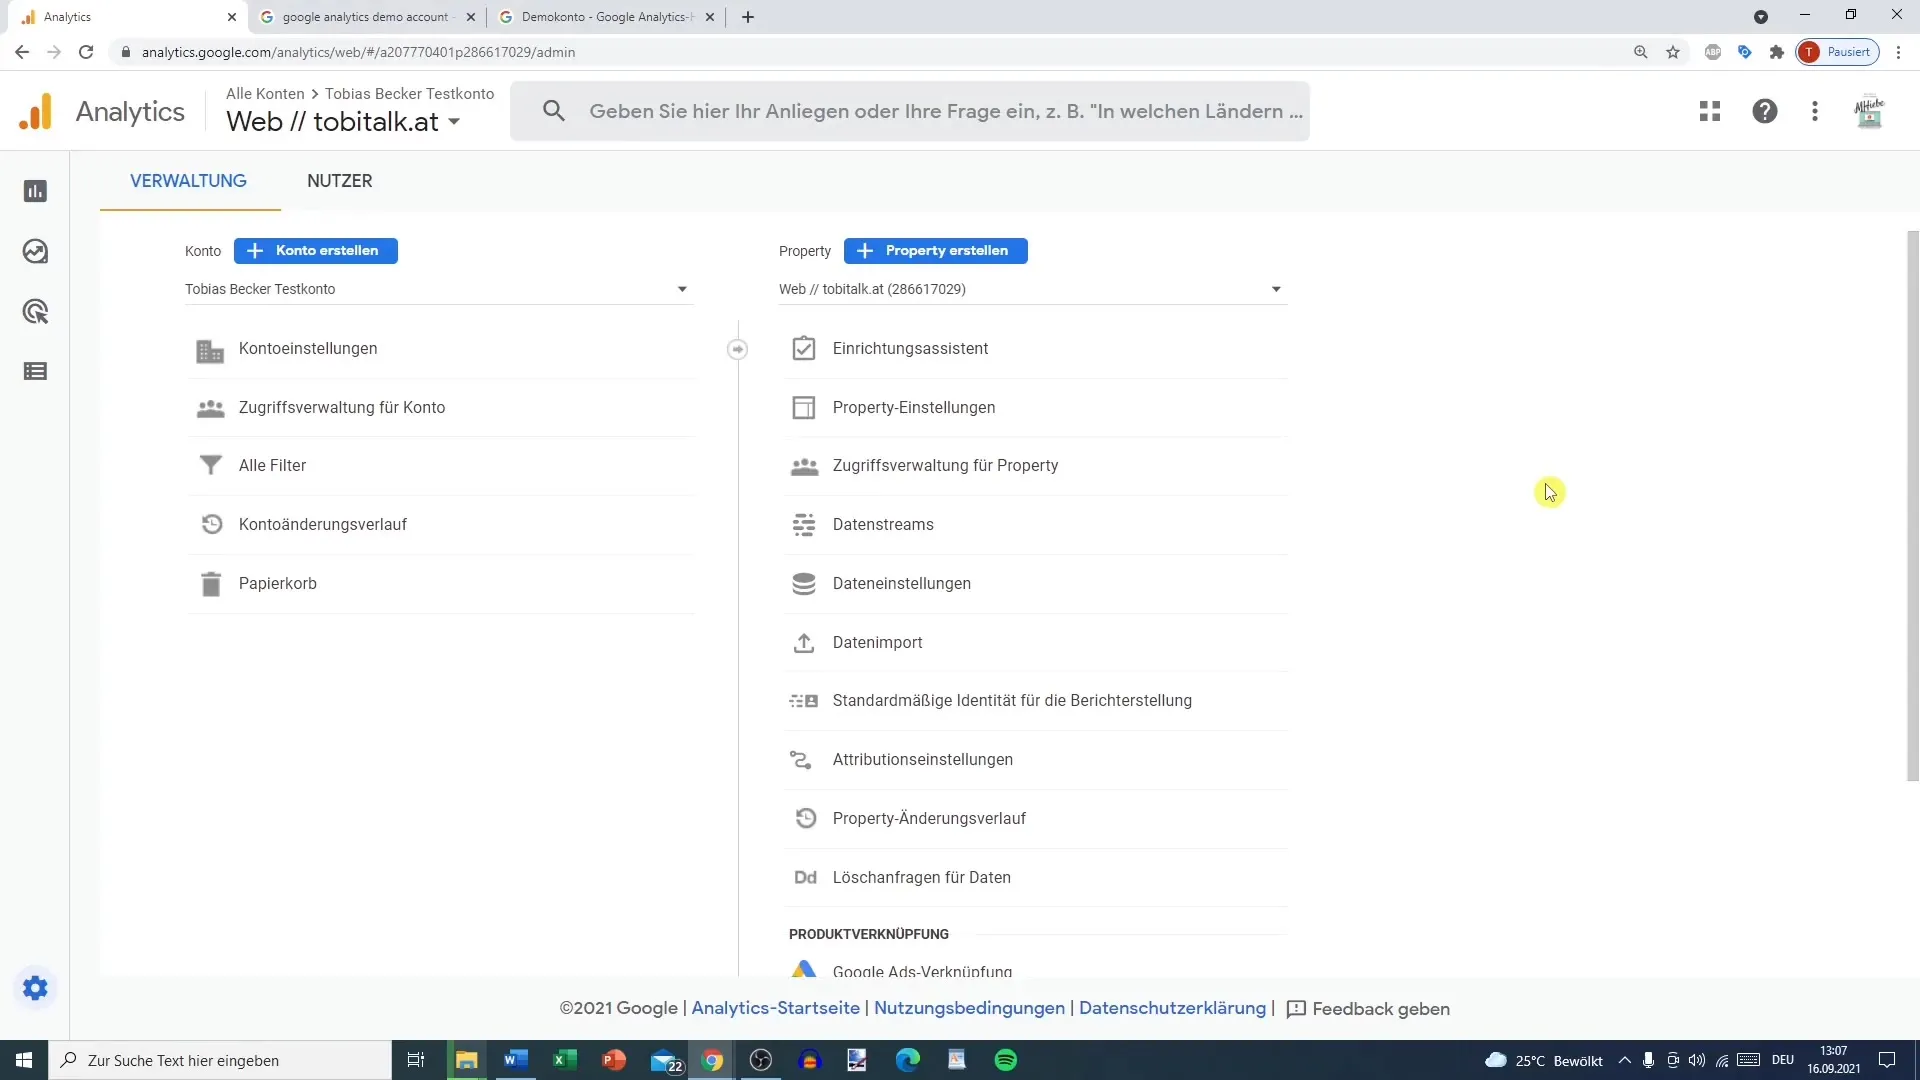
The main area is a taskbar containing various reports. For example, clicking on "Reports" will open a window with the different reporting options available to you.
The first feature you should look at is the "Snapshot" report. This provides a brief overview of the key metrics that are readily available. For example, you can see real-time data, which is much more detailed than in the previous version of Google Analytics.
Building on this, additional reports are available including Acquisition, Engagement, and Monetization. These reports provide insights into user behavior and are crucial for analyzing your marketing strategy and optimizing the user experience.
If you wish to collapse the sidebar, you can simply click on the arrow, creating more space on your screen for data analysis.
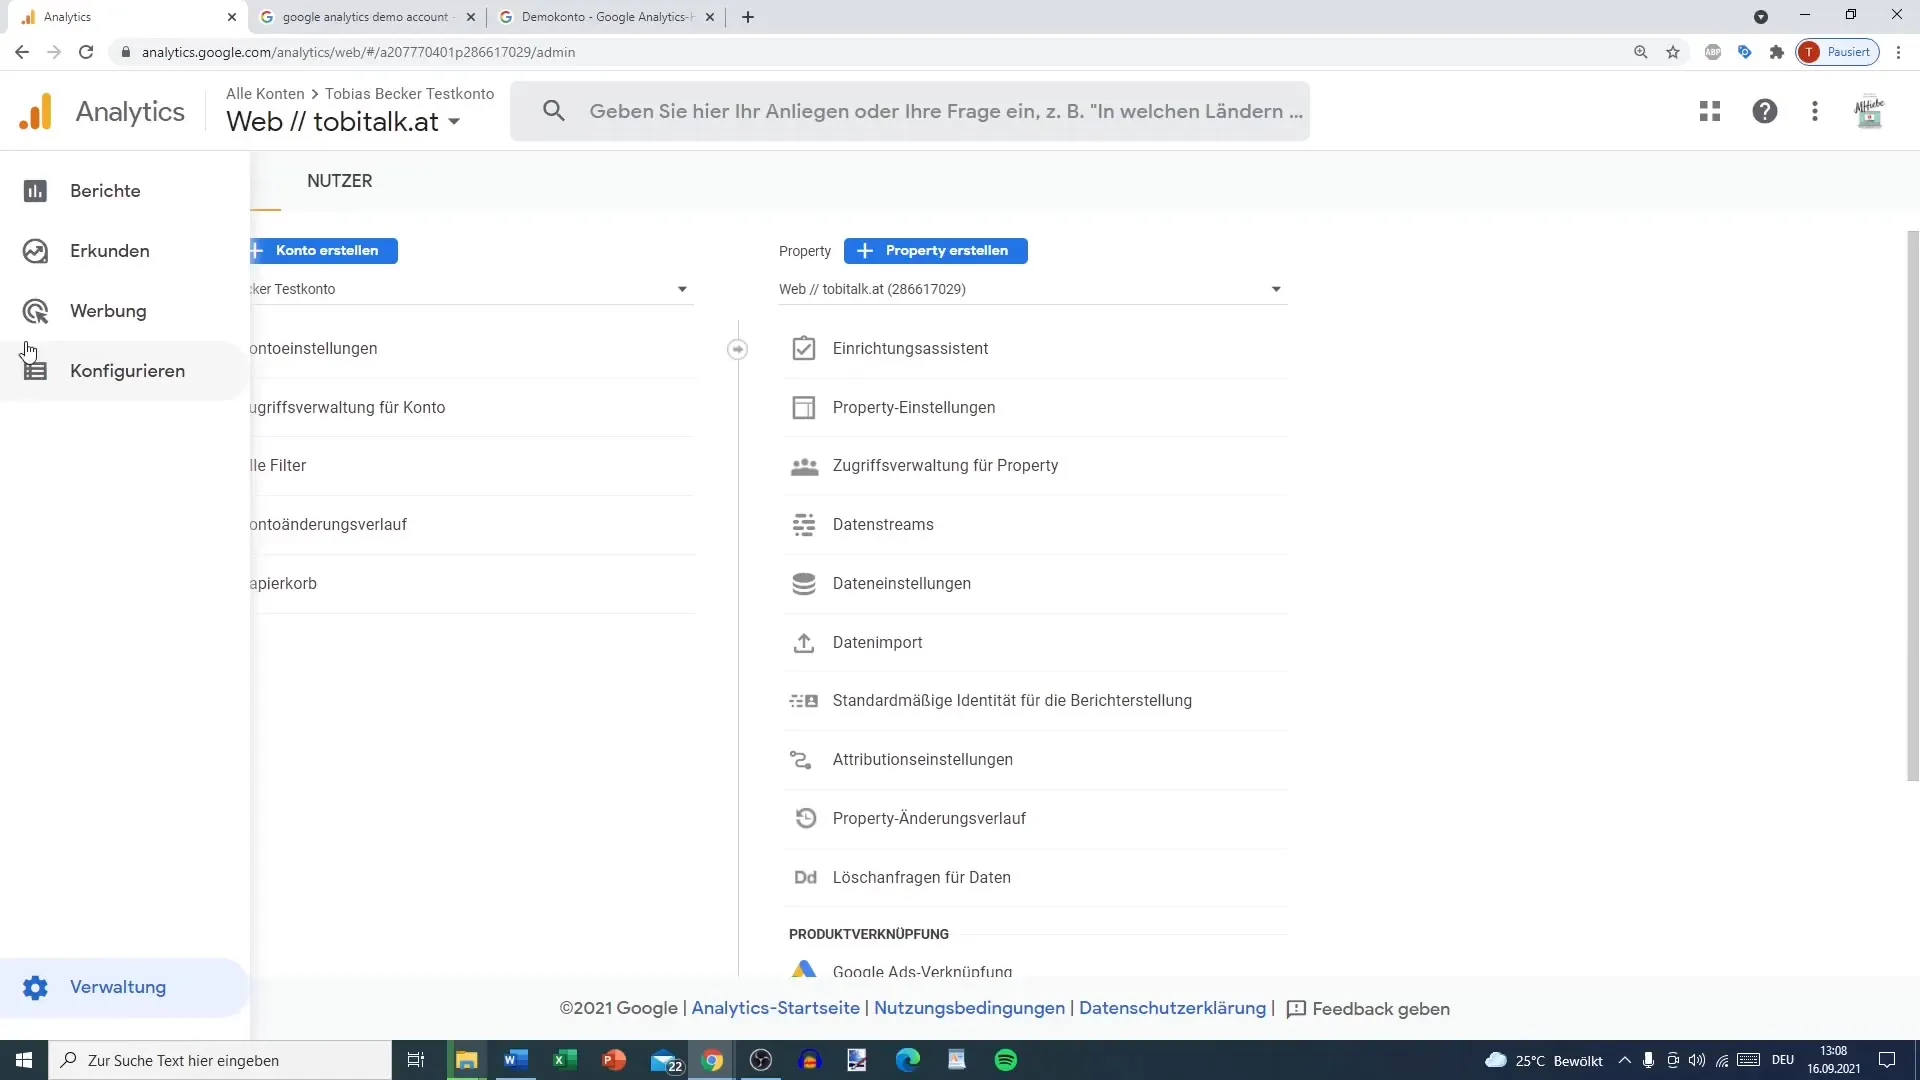
An especially interesting feature is the "Explore" tab. Here you can conduct exploratory data analyses to help you identify specific trends and user behaviors. You can perform path analysis or funnel analysis, among other things.
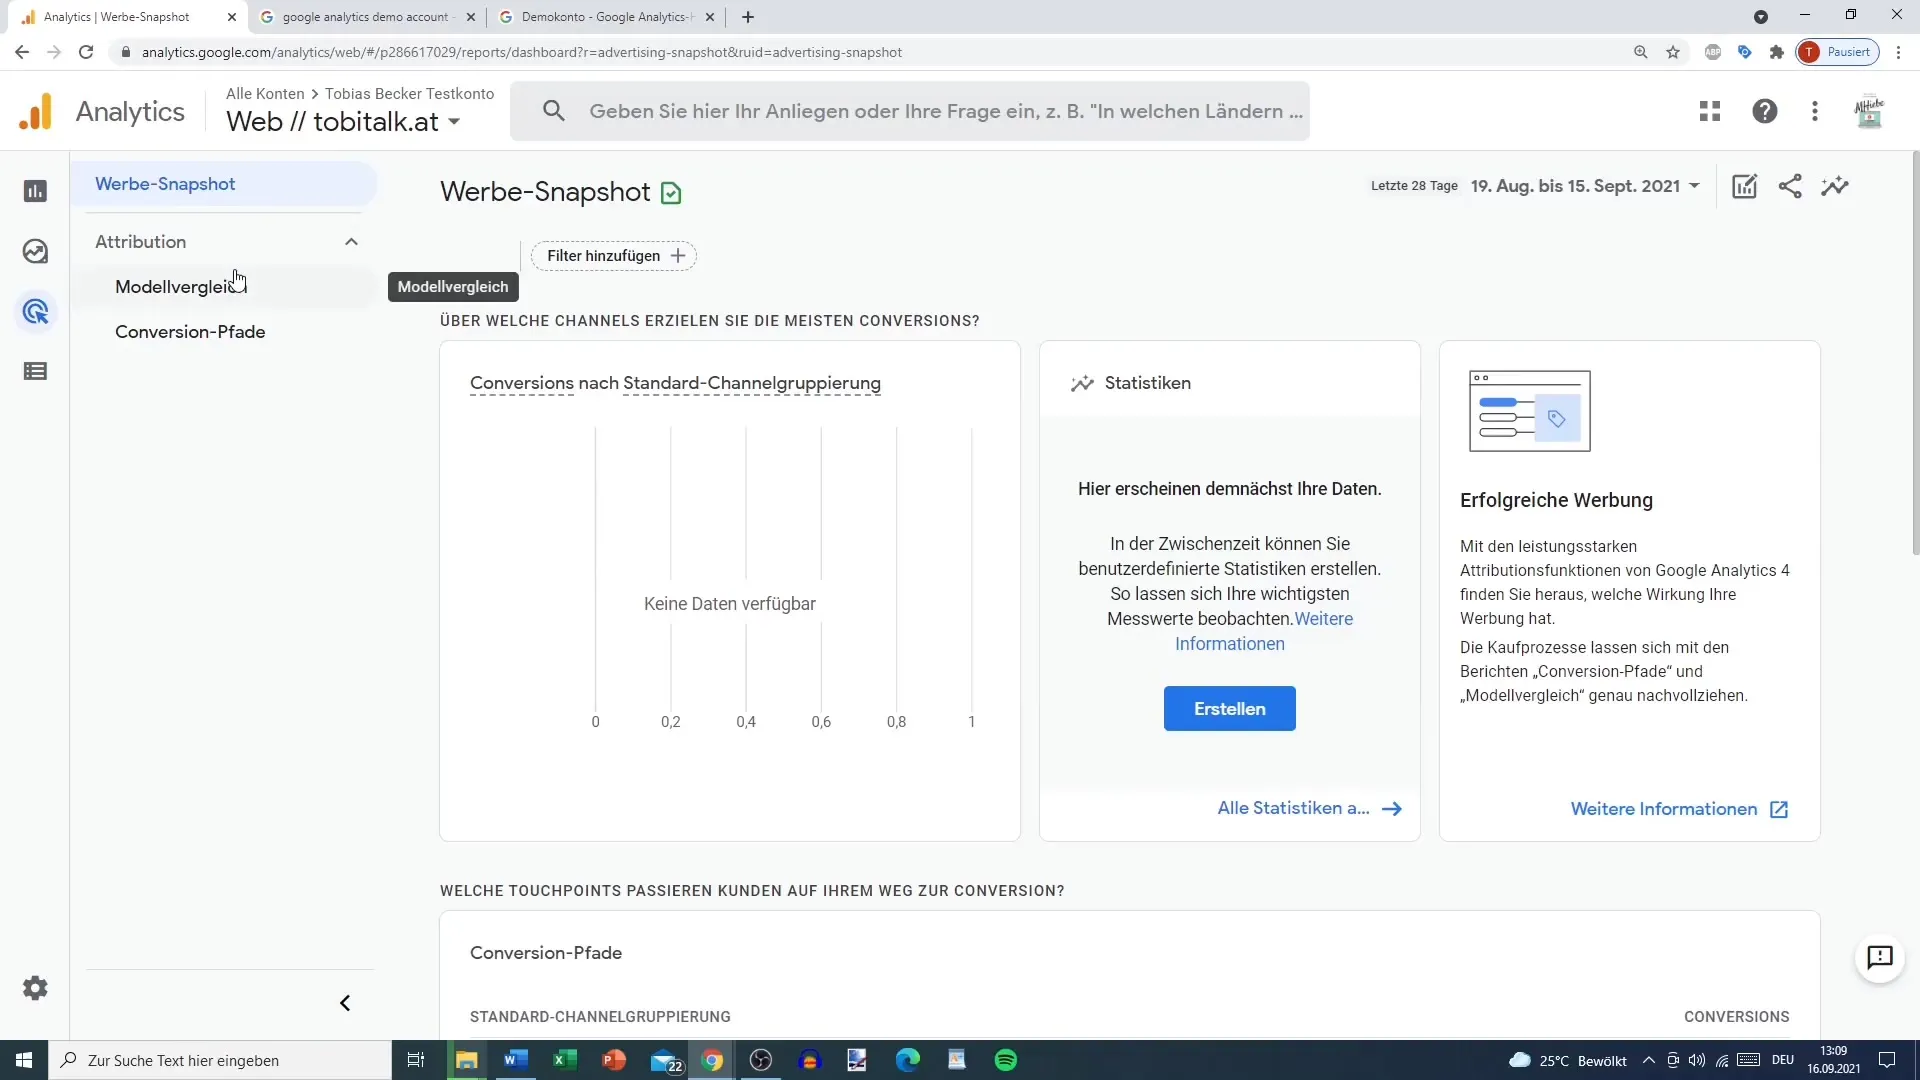
In addition, under the "Advertising" tab, there is a corresponding snapshot that shows you the key data on the performance of your advertising campaigns. There are also some analysis tools integrated, such as Model Comparison and Conversion Path.
Another important aspect is the "Configure" section. Here you will find settings for events, conversions, and audiences that are essential for later data analysis. Create the necessary events here that you want to track and evaluate later.
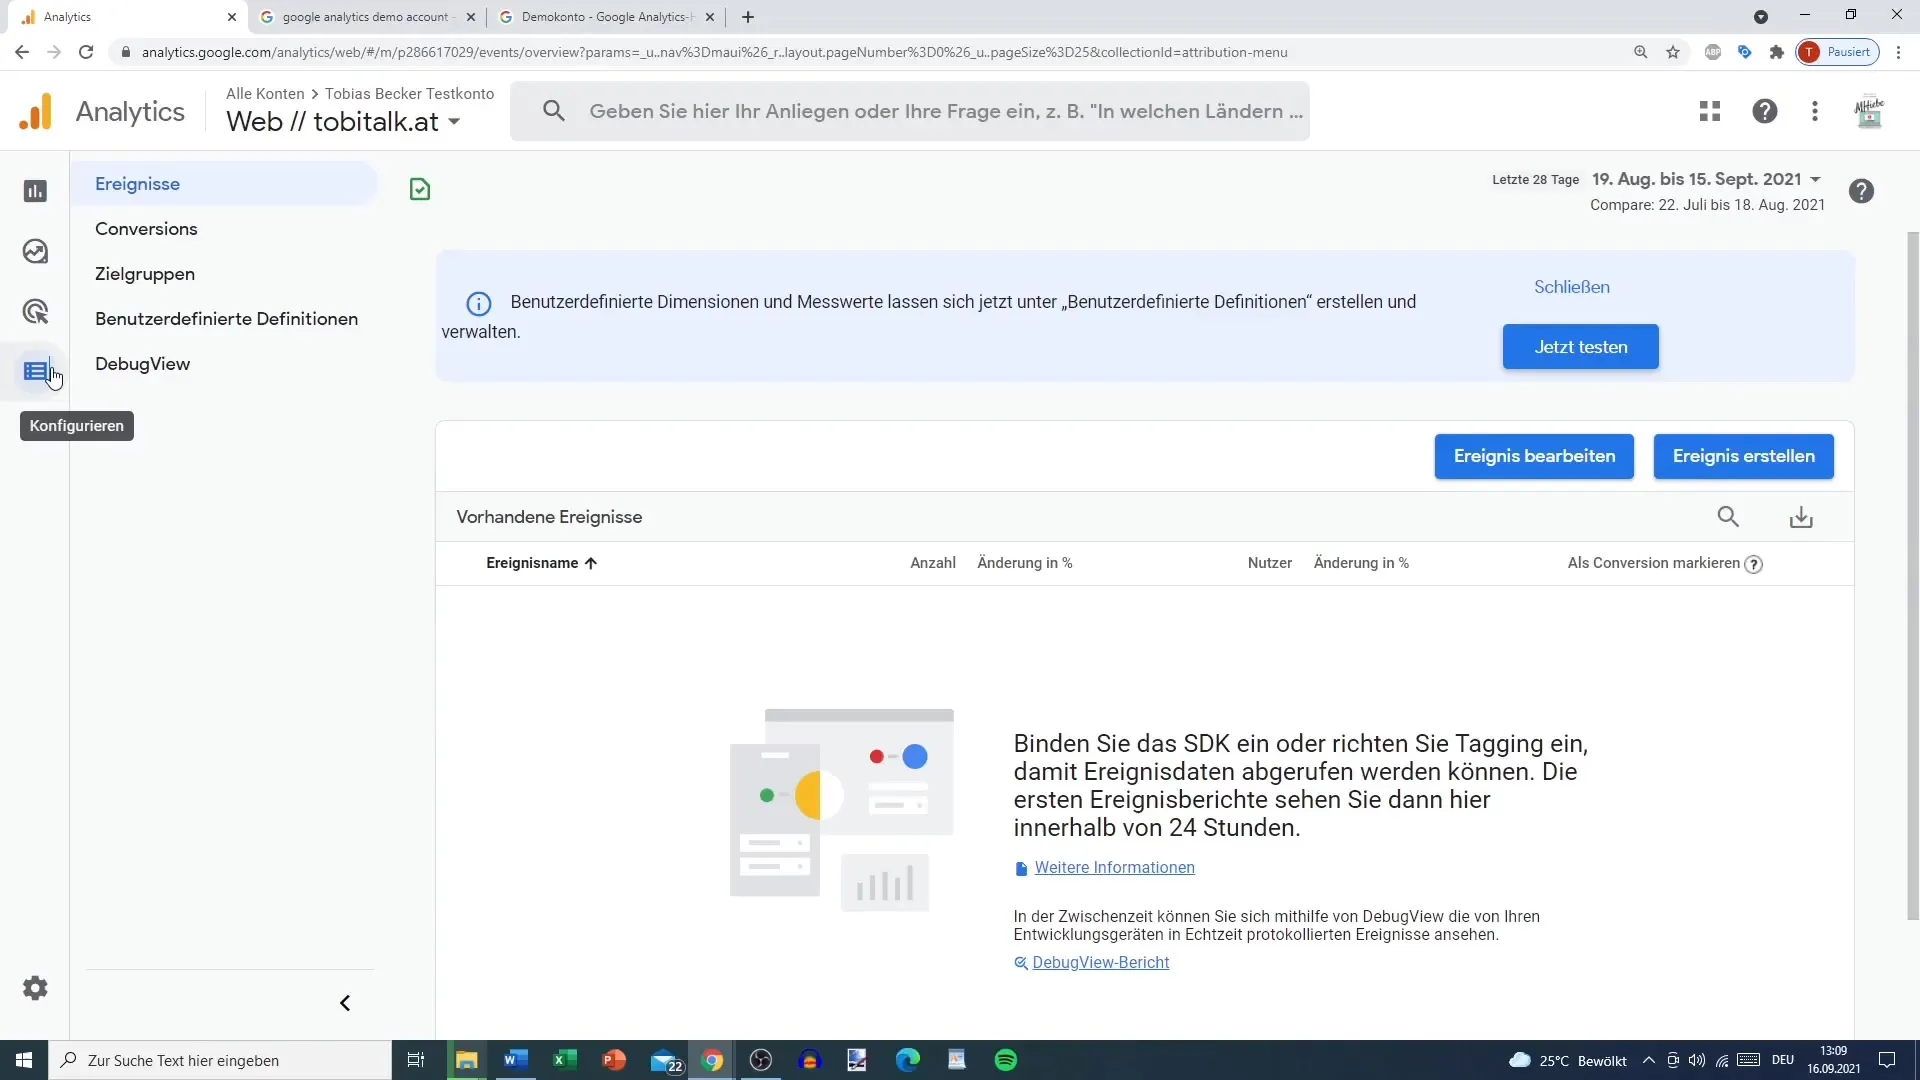
To return to the administration, click on the gear icon in the lower-left corner. Here you will find the account management, which is essentially different from the structure in Universal Analytics. Instead of having accounts, properties, and views, now there are only accounts, properties, and under the properties, different data streams.
If you are looking for specific information, you can use the search function to find targeted data, such as the countries your users come from.
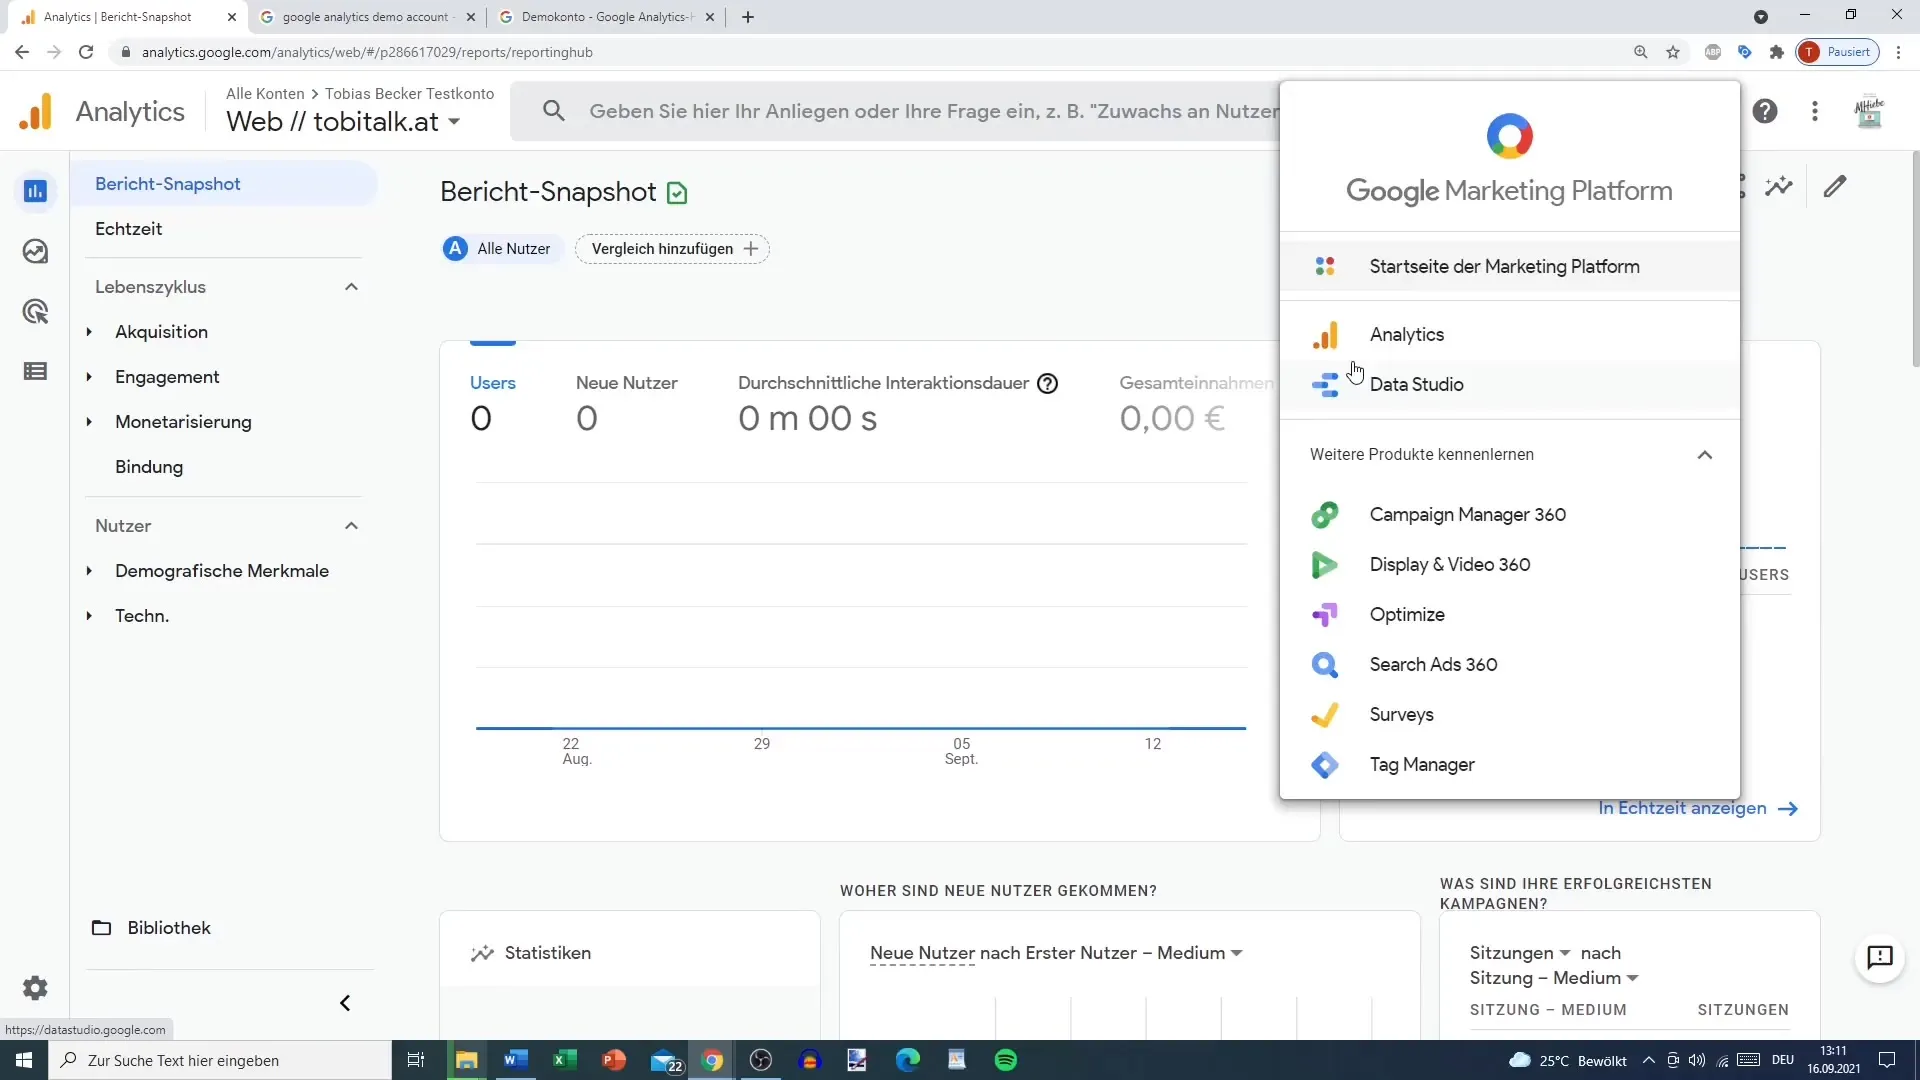
Enhance your analyses by using the four dots in the upper right corner to integrate other Google products such as Google Optimize or Data Studio. These tools can help you analyze your data in a more meaningful way.
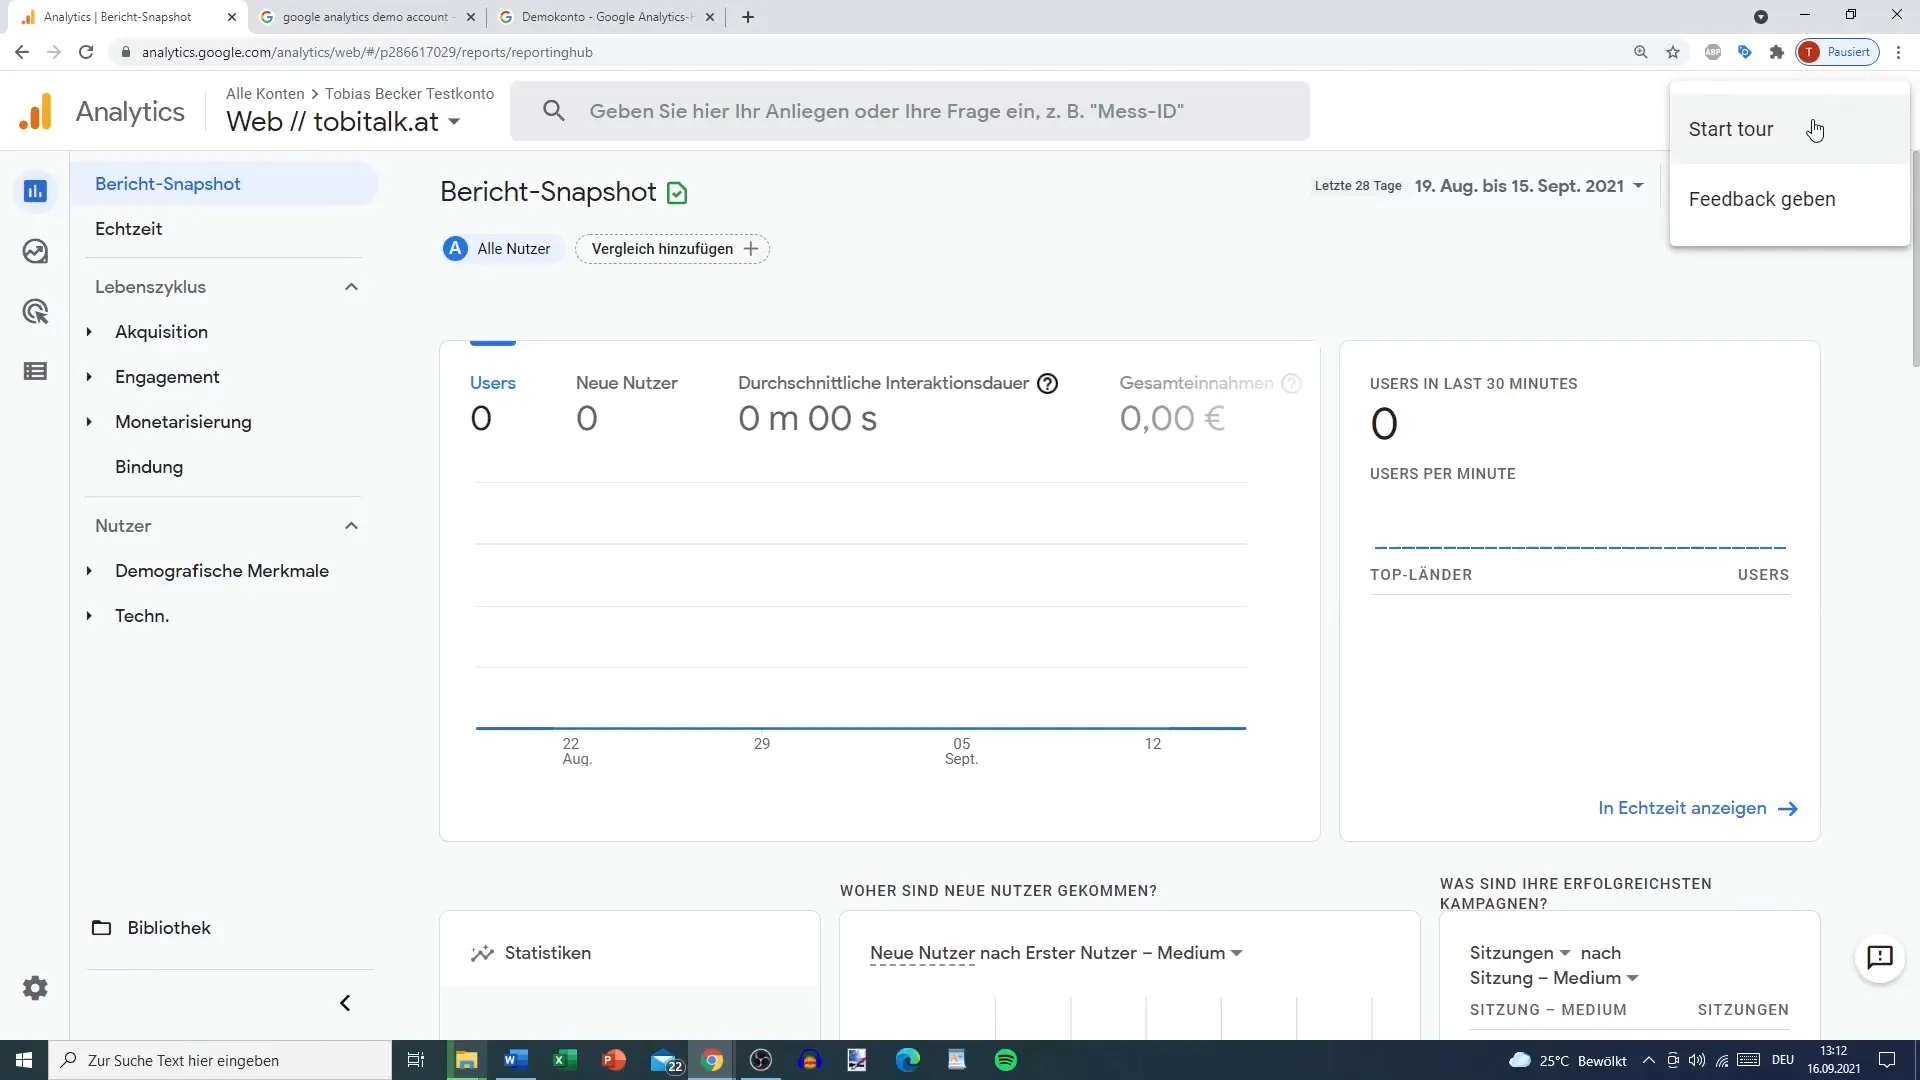
Additionally, you will find a question mark that provides helpful articles on Google Analytics as well as the option to start a brief introductory tour of the user interface, offering you a good entry into the software.
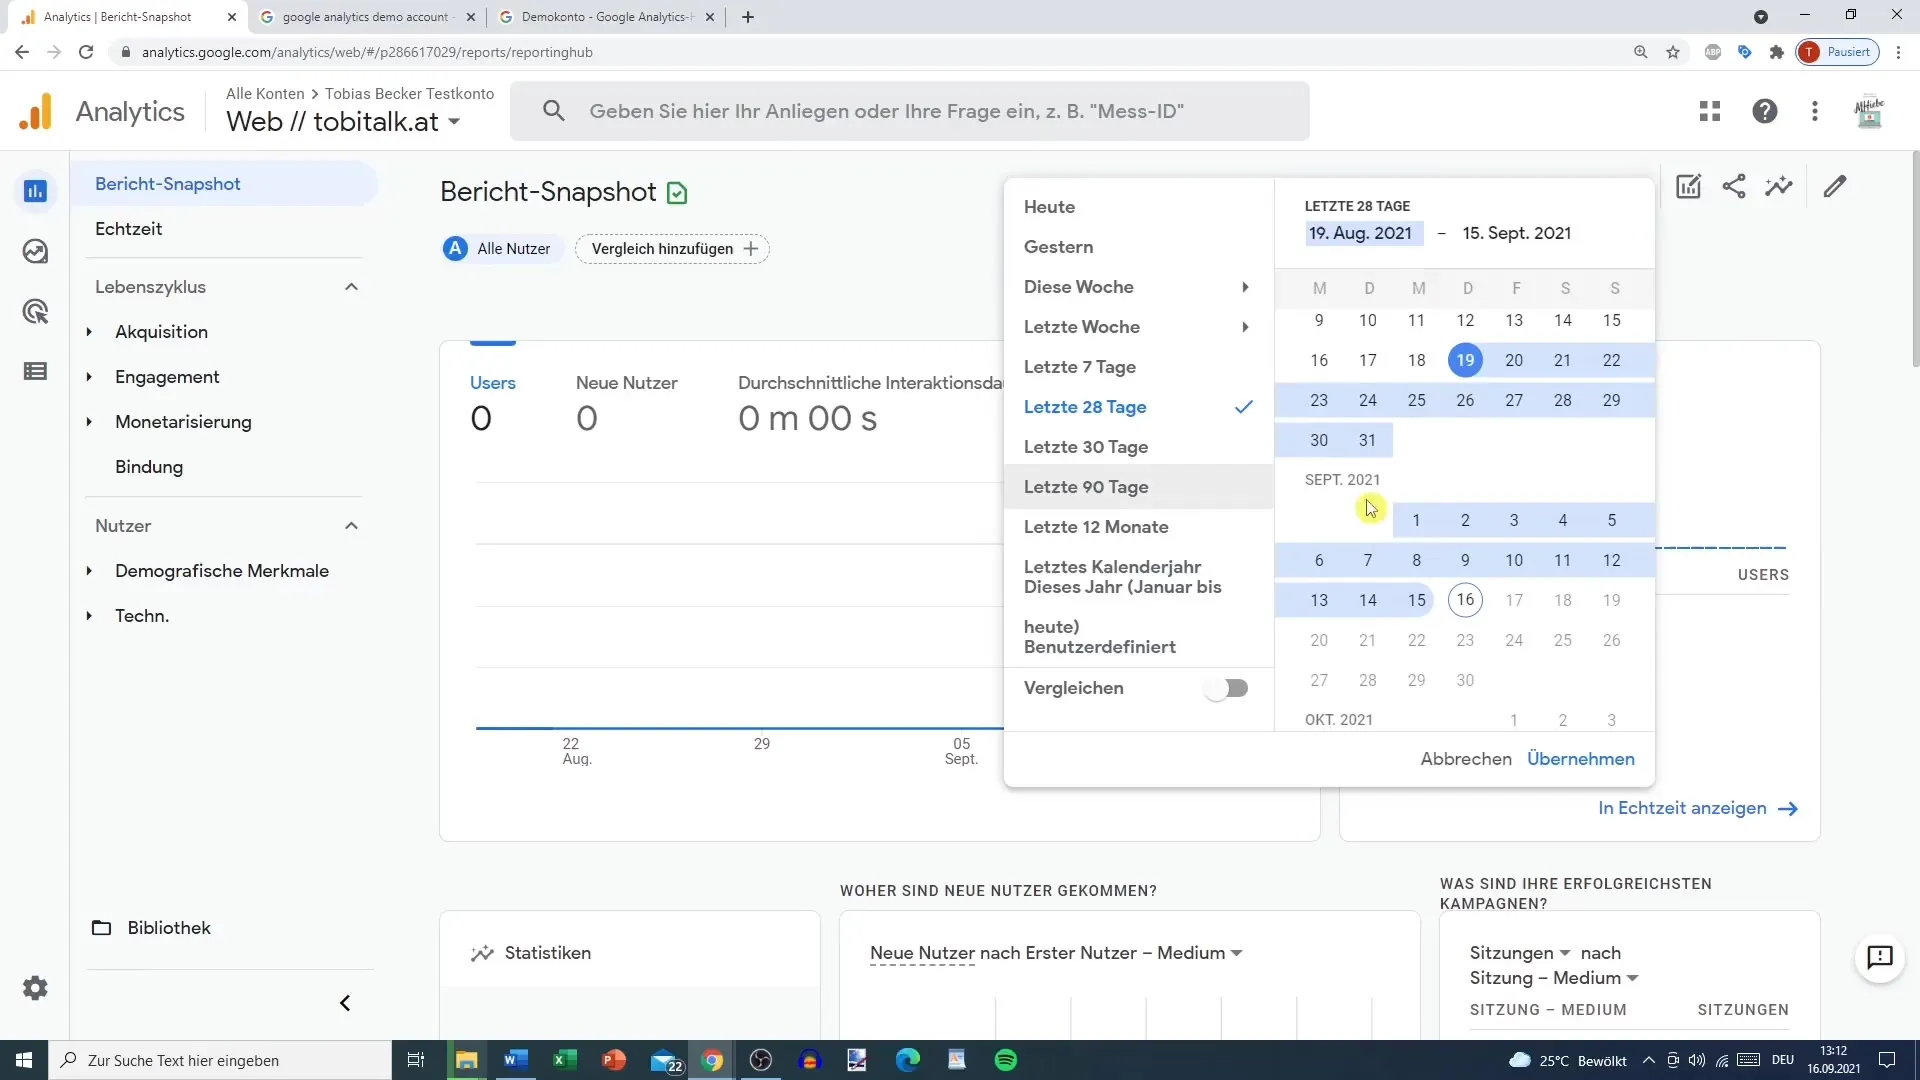
If you want to customize the timeframe of your data analysis, you can do so at any time. You have the option to use presets or make a custom selection. In addition to the timeframe, you can also compare, share and customize reports.
At the end of this first exploration tour through Google Analytics 4, you decide whether to set up a demo account to utilize some data. This data will help you analyze the reports in detail, which is important for your marketing and optimizing your website.
Summary
Google Analytics 4 offers you a redesigned user interface with various features to simplify the analysis of your website. With reports on Acquisition, Engagement, and Monetization, you have the necessary tools to effectively understand your data. By configuring events and conversions, you lay the foundation for deeper analyses that optimize your marketing strategies.
Frequently Asked Questions
What is the difference between Google Analytics 4 and Universal Analytics?Google Analytics 4 has a simplified user interface and focuses on data streams instead of data views.
How can I configure events in Google Analytics 4?You can find the configuration options under the "Configure" tab in the sidebar.
Where can reports be customized?Reports can be edited and customized at the top of the page window to display specific data.
Are there templates for data analysis?Yes, under the "Explore" tab, you will find various templates for comprehensive data analysis.
How can I see real-time data?Real-time data can be found in the "Snapshot" report, which provides you with immediate important information.
