The Monetization Report in Google Analytics is a crucial tool for online shop owners and E-commerce managers. In this post, you will learn what information this report provides, how to effectively use it, and what insights you can gain from the data. The focus is on how to analyze the sales figures and purchase behavior of your customers to make informed decisions to improve your shop.
Main Findings
- The Monetization Report shows buyer numbers and revenues broken down by categories.
- Analyzing your customers' buying habits helps you better tailor offers and increase revenue.
- Distinguishing between first-time buyers and repeat buyers is crucial for customer retention.
Step-by-Step Guide
1. Getting Started with the Monetization Report
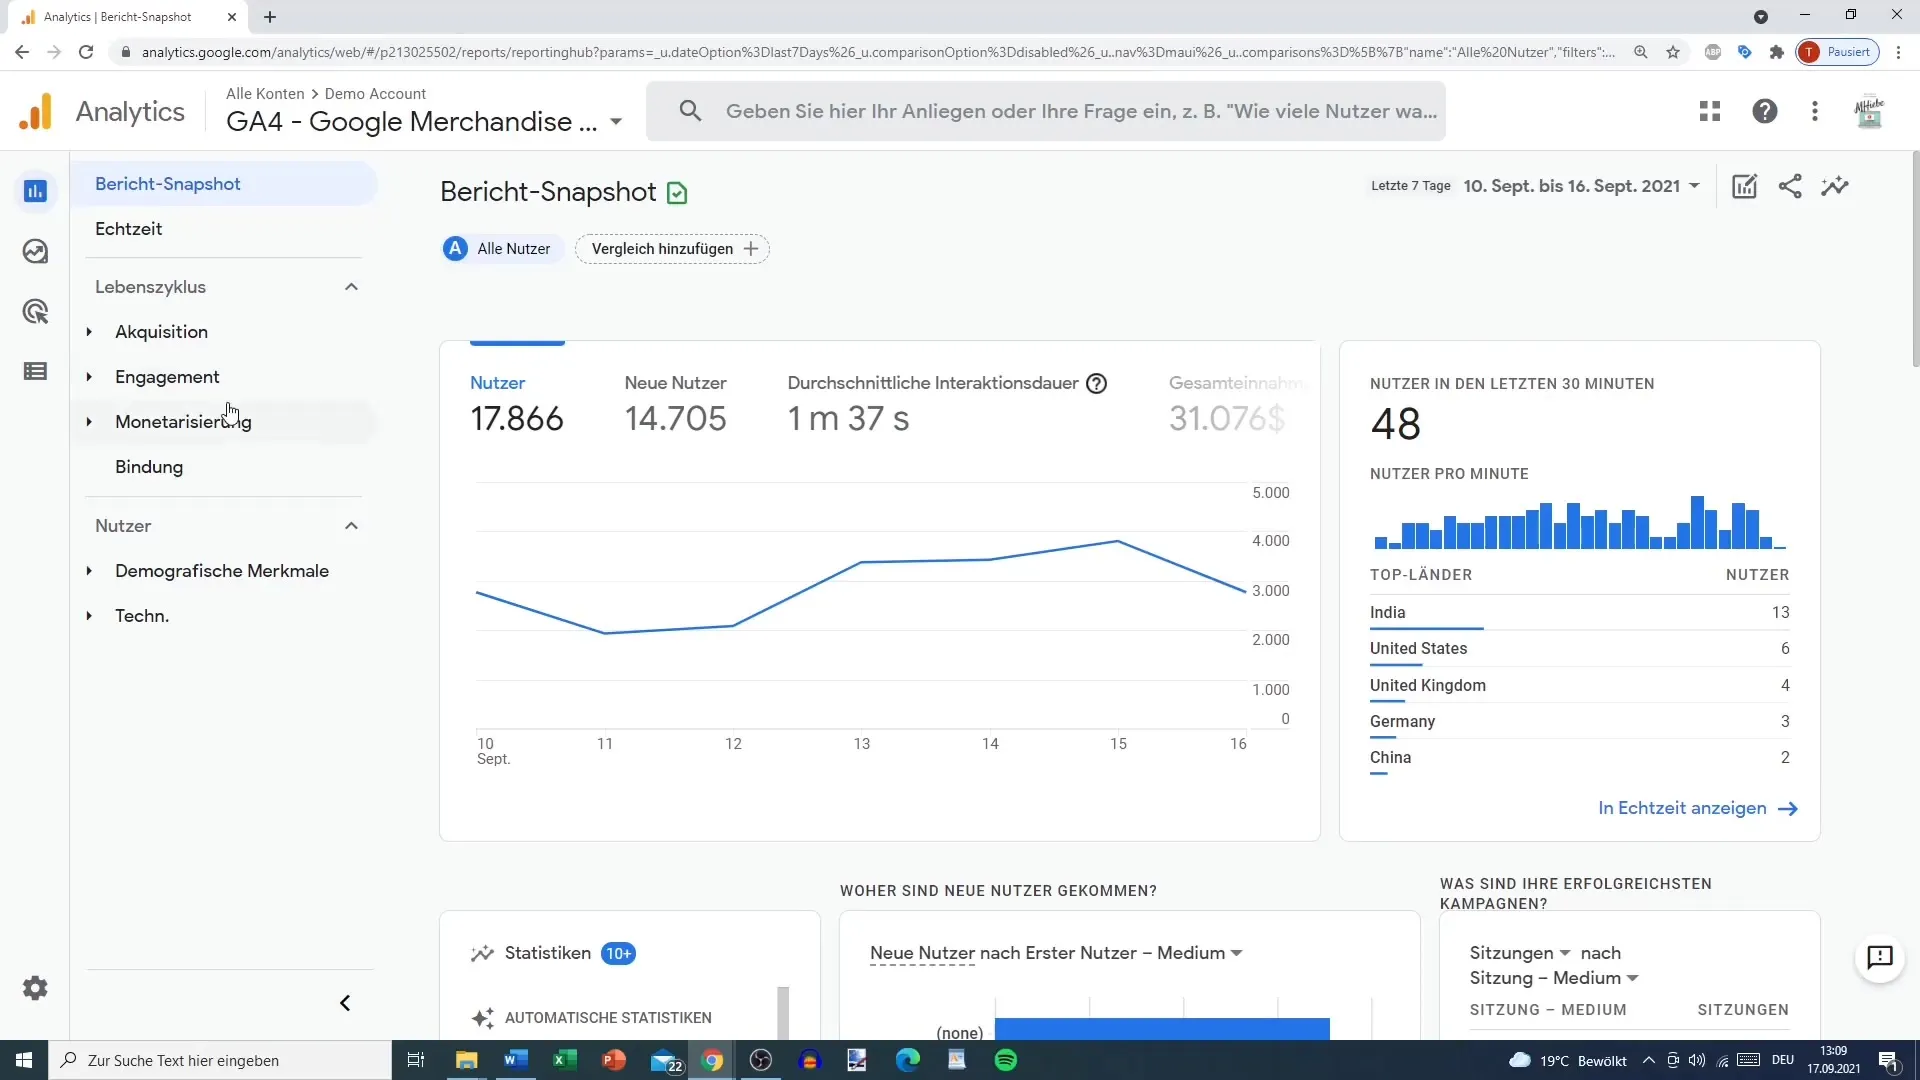
First, you'll want to navigate to your Google Analytics dashboard. Look for the "Lifecycle" section to find the Monetization Report. Here, you can view the basic performance data of your E-commerce activities.
2. Understanding the Core Categories
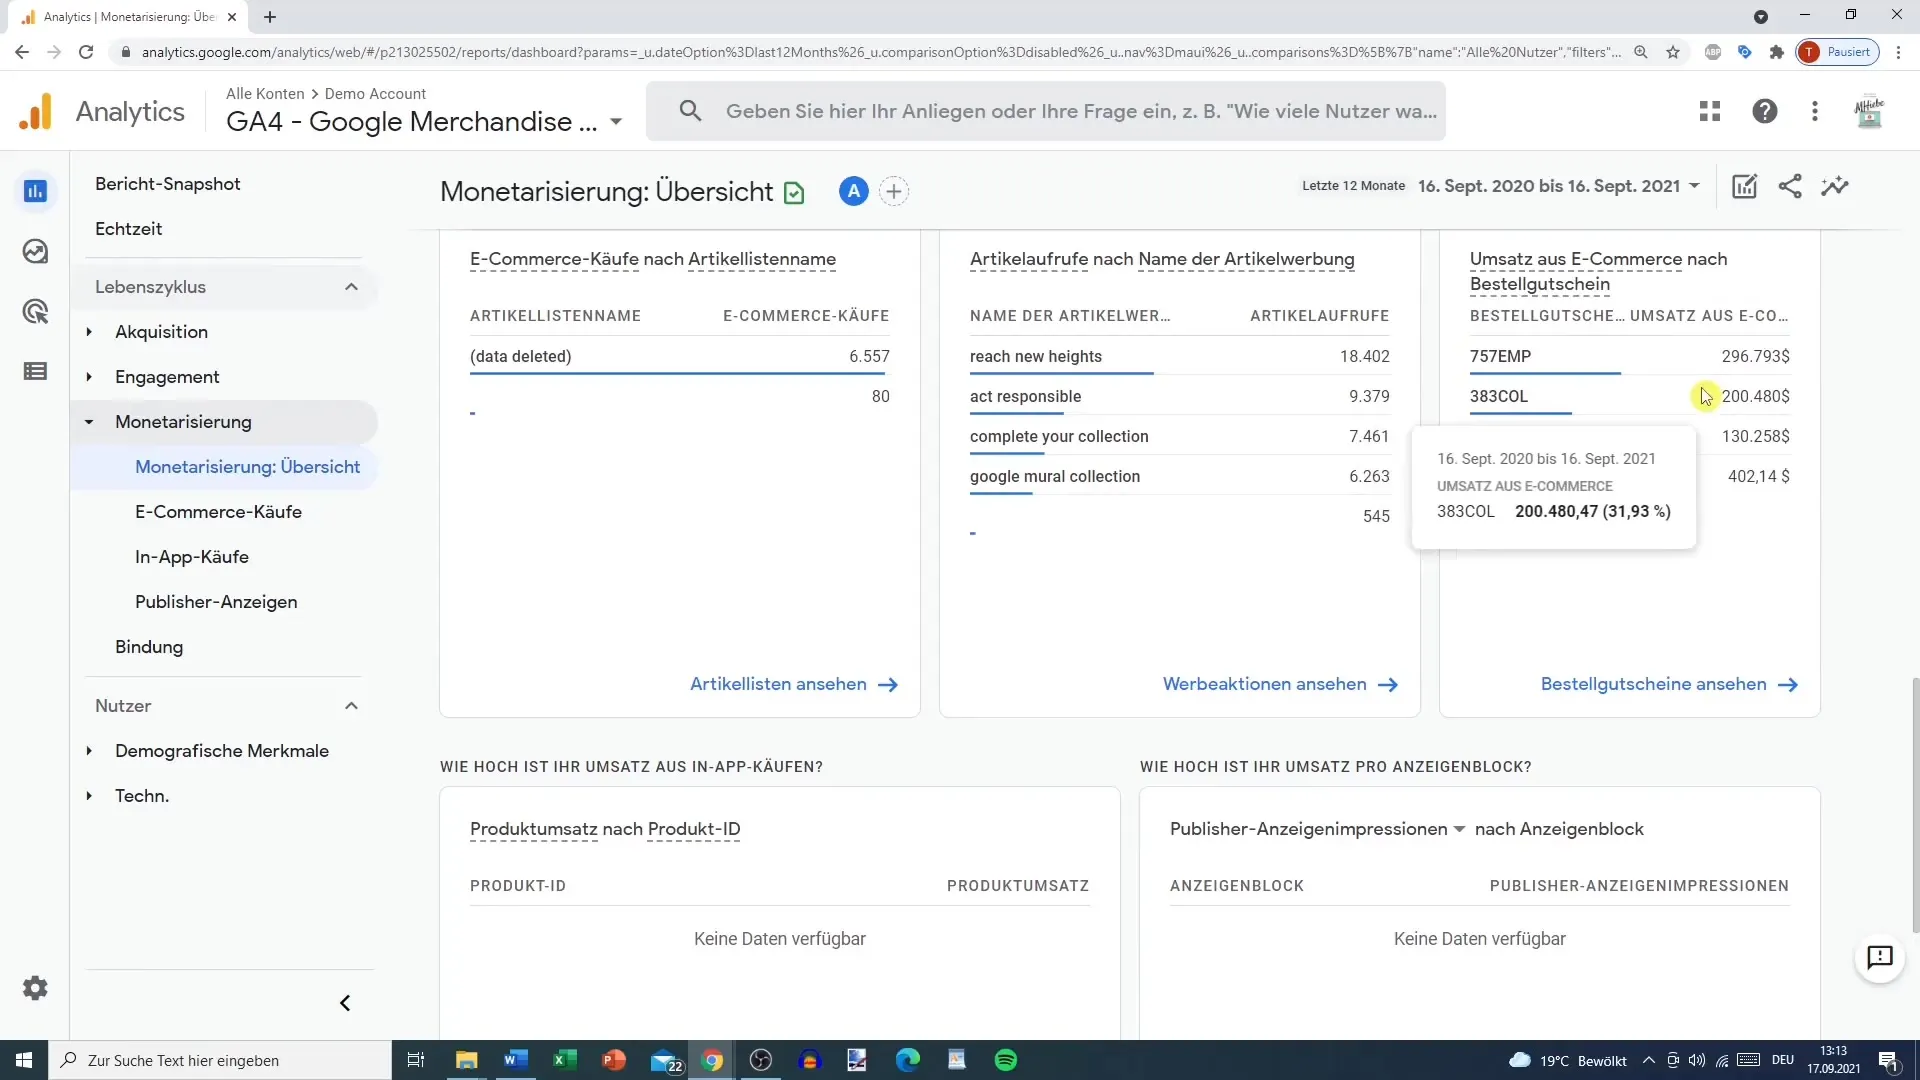
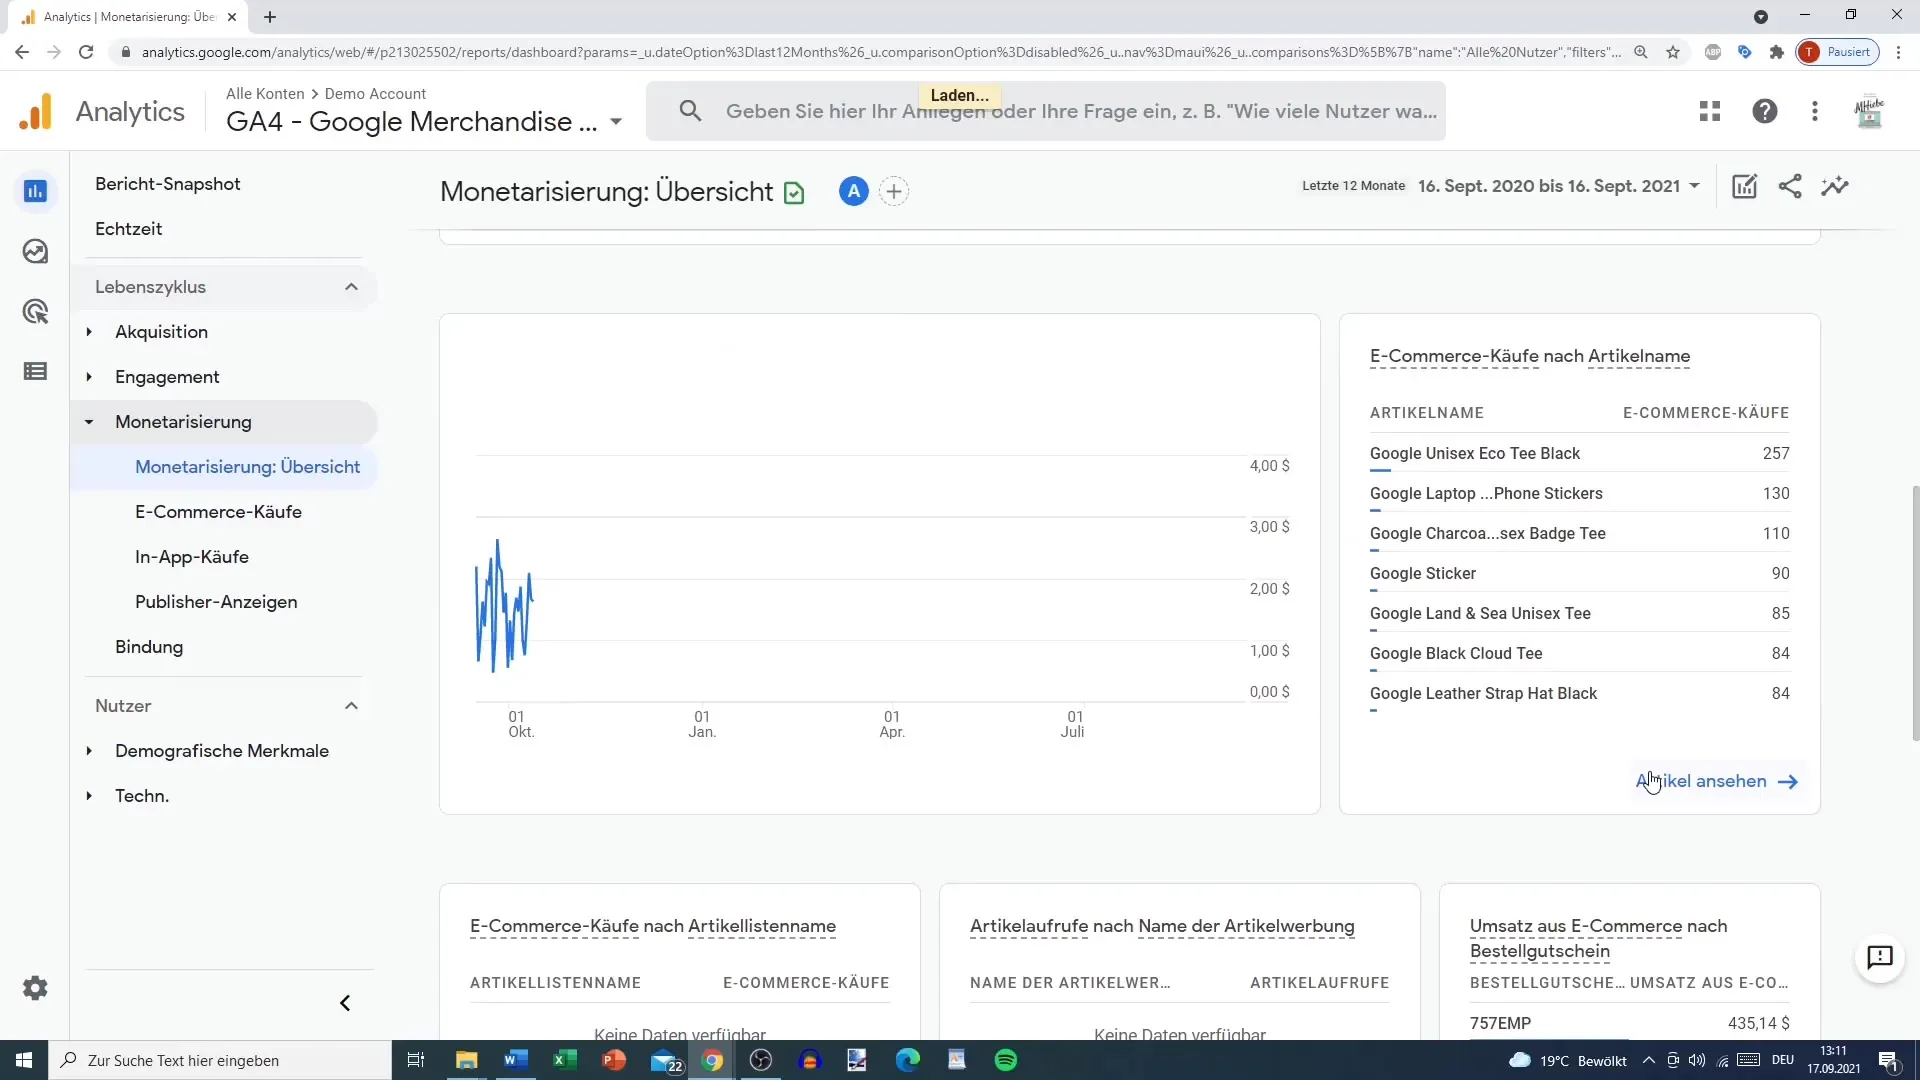
The Monetization Report is divided into several key categories: Items, Promotions, and Coupons. Each of these aspects provides valuable insights into your revenue. Particularly, the items that sell frequently are important for your sales strategies.

3. Conducting Revenue and Buyer Analysis
According to the report, you can read the total buyer numbers and total income. The average revenue per buyer is also visible. This data will help you evaluate the attractiveness of your offers and adjust your marketing strategies.
4. Distinguishing Between First-time Buyers and Repeat Buyers
A critical analysis of your buyers can show you how many customers are first-time buyers and how many have made repeated purchases. Repeat buyers generally bring in more revenue, so it makes sense to examine their buying behavior more closely.
5. Evaluating Item Performance
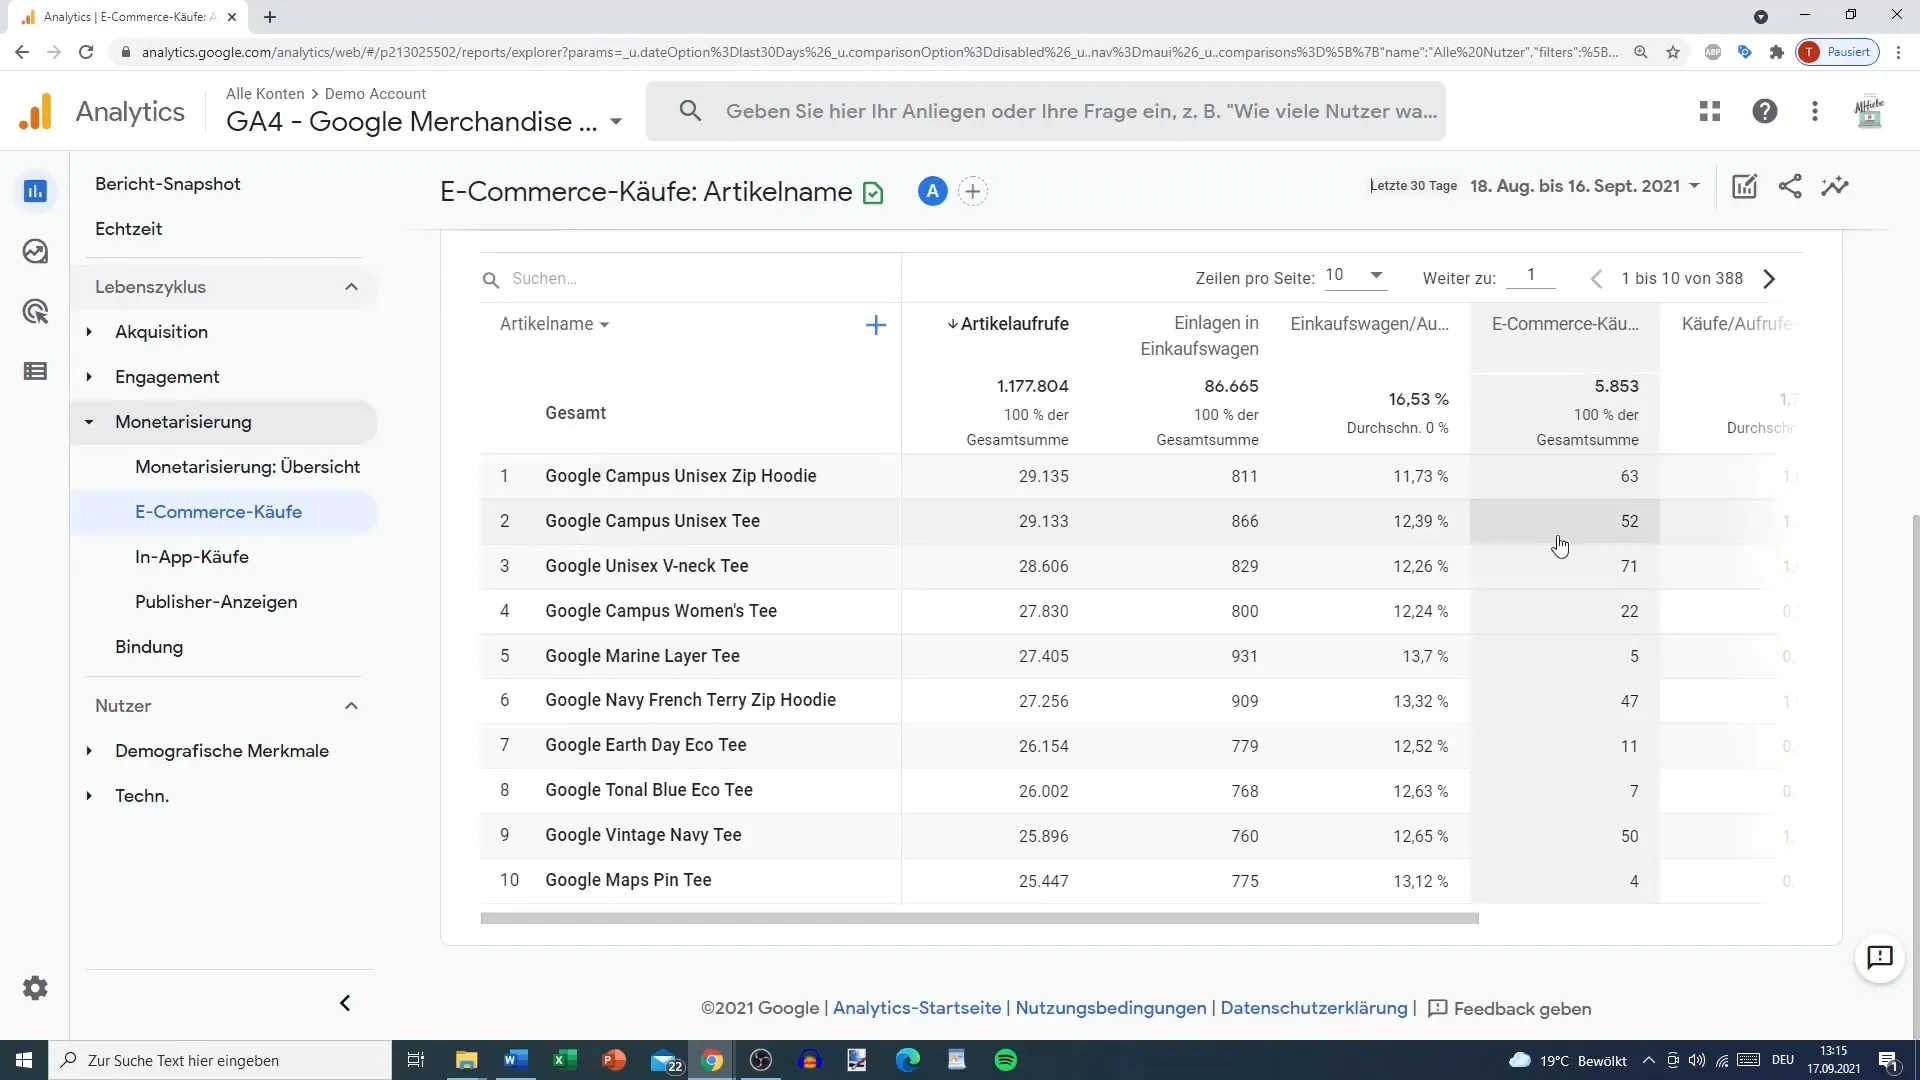
Review the sales figures of each product. If certain items are not selling well, it may be due to product presentation or price. You may need to consider discount promotions or optimize the product description.
6. Revenue from Ad Campaigns and Coupons
Analyze the effectiveness of your discount promotions and coupons. How much revenue do these offers generate? This data is important for planning and adjusting future marketing initiatives.
7. Analyzing Conversion Rate Usage
The conversion rate gives you insight into how many of your website visitors ultimately made a purchase. You can calculate this rate by dividing the number of purchases by the number of visitors.
8. Further Analyses
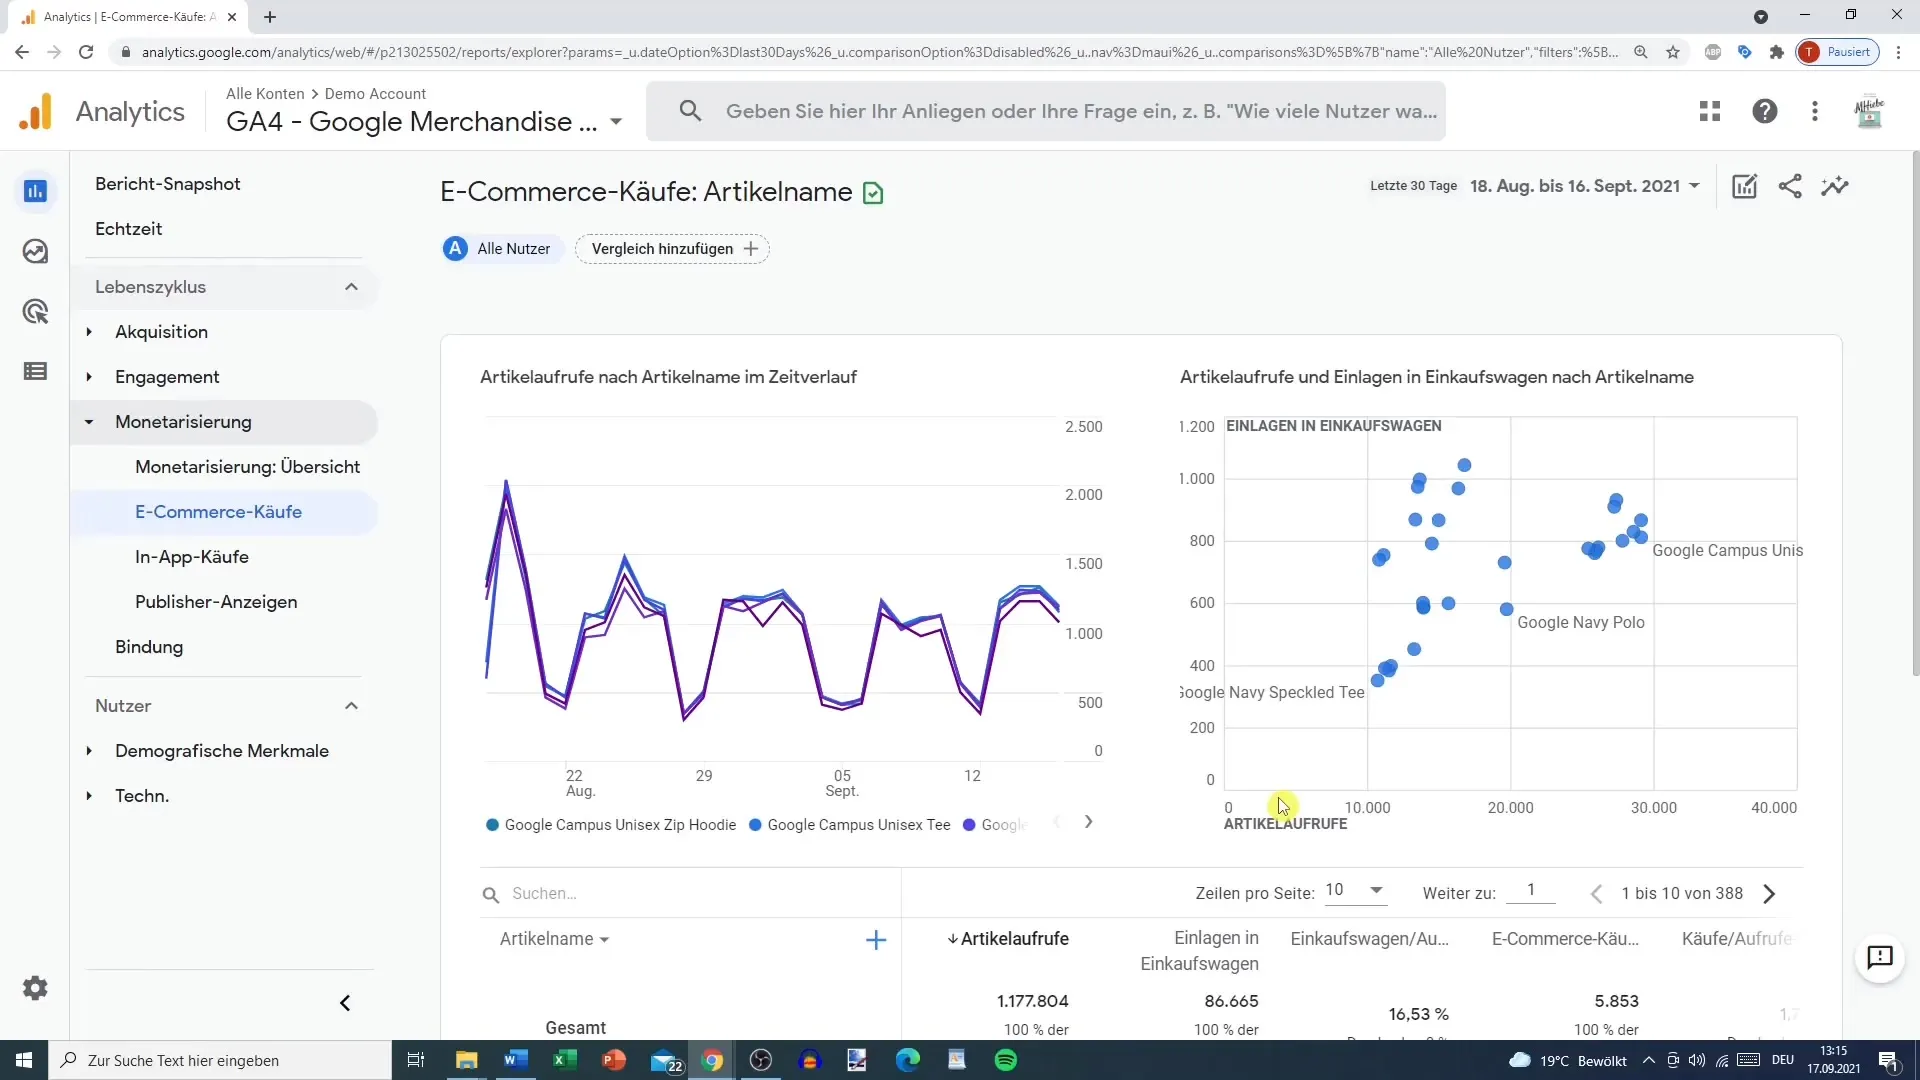
Also, look at the item views and the number of products added to the cart. These statistics show you which products potentially generated the most interest and how successful your products are at converting in the funnel.
9. Average Revenue per User
Calculate the average revenue per user in a defined period. This metric gives you a quick overview of how much revenue you are generating on average per visitor.
10. Measuring Long-term Customer Retention
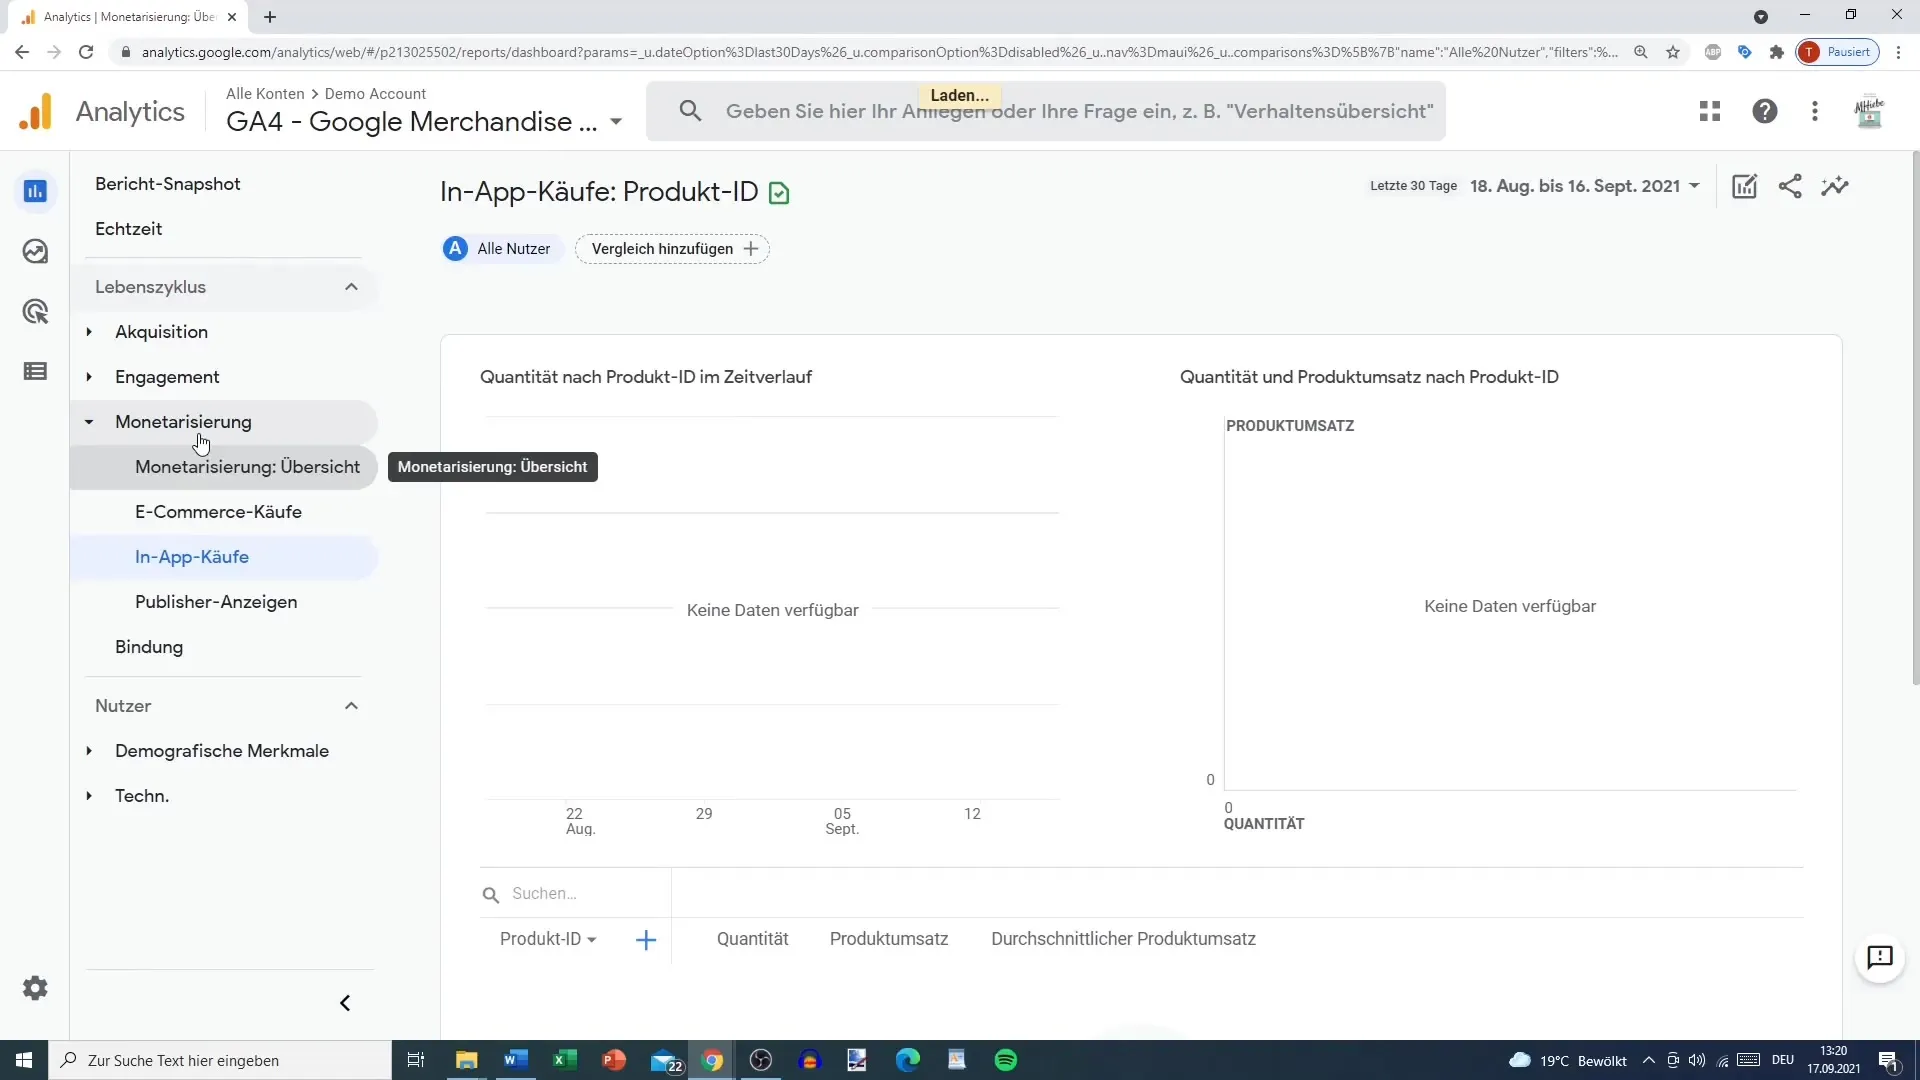
Before moving on to the next report in Google Analytics, it is important to also consider customer retention. It is crucial for your long-term success in E-commerce.
Summary
The Monetization Report in Google Analytics provides you with comprehensive insights into buyer numbers and revenue performance. By analyzing this data, you can develop targeted marketing strategies and sustainably increase customer loyalty.
Frequently Asked Questions
How can I access the Monetization Report?You can find the report in the "Lifecycle" section of Google Analytics.
What is the difference between first-time buyers and repeat buyers?First-time buyers are new customers, while repeat buyers have already made multiple purchases from you and typically generate higher revenue.
How can I calculate the conversion rate?Divide the number of purchases by the number of visitors to your shop.
What should I do if a product is not performing well?Review the product presentation, the price, and consider discount promotions if necessary.
How important are vouchers in revenue analysis?Vouchers can significantly increase revenue, which is an important metric for evaluating the effectiveness of your marketing efforts.
