When you take a closer look at the user statistics of your website or app, Google Analytics's User Report provides valuable insights into the technical behavior of your users. Unlike demographic data, which reveal information about the age groups or genders of your visitors, technical data show which devices and platforms your users are using. In this guide, you will learn how to effectively interpret the technical data to make informed decisions about your digital strategy.
Key Insights
The user report provides numerous information on device types, operating systems, browsers, and user behavior. These data help you optimize the user experience by understanding where potential issues lie and how you can better tailor your website or app to the needs of your users.
Step-by-Step Guide to Analyzing Technical Data
Accessing the Technical Report
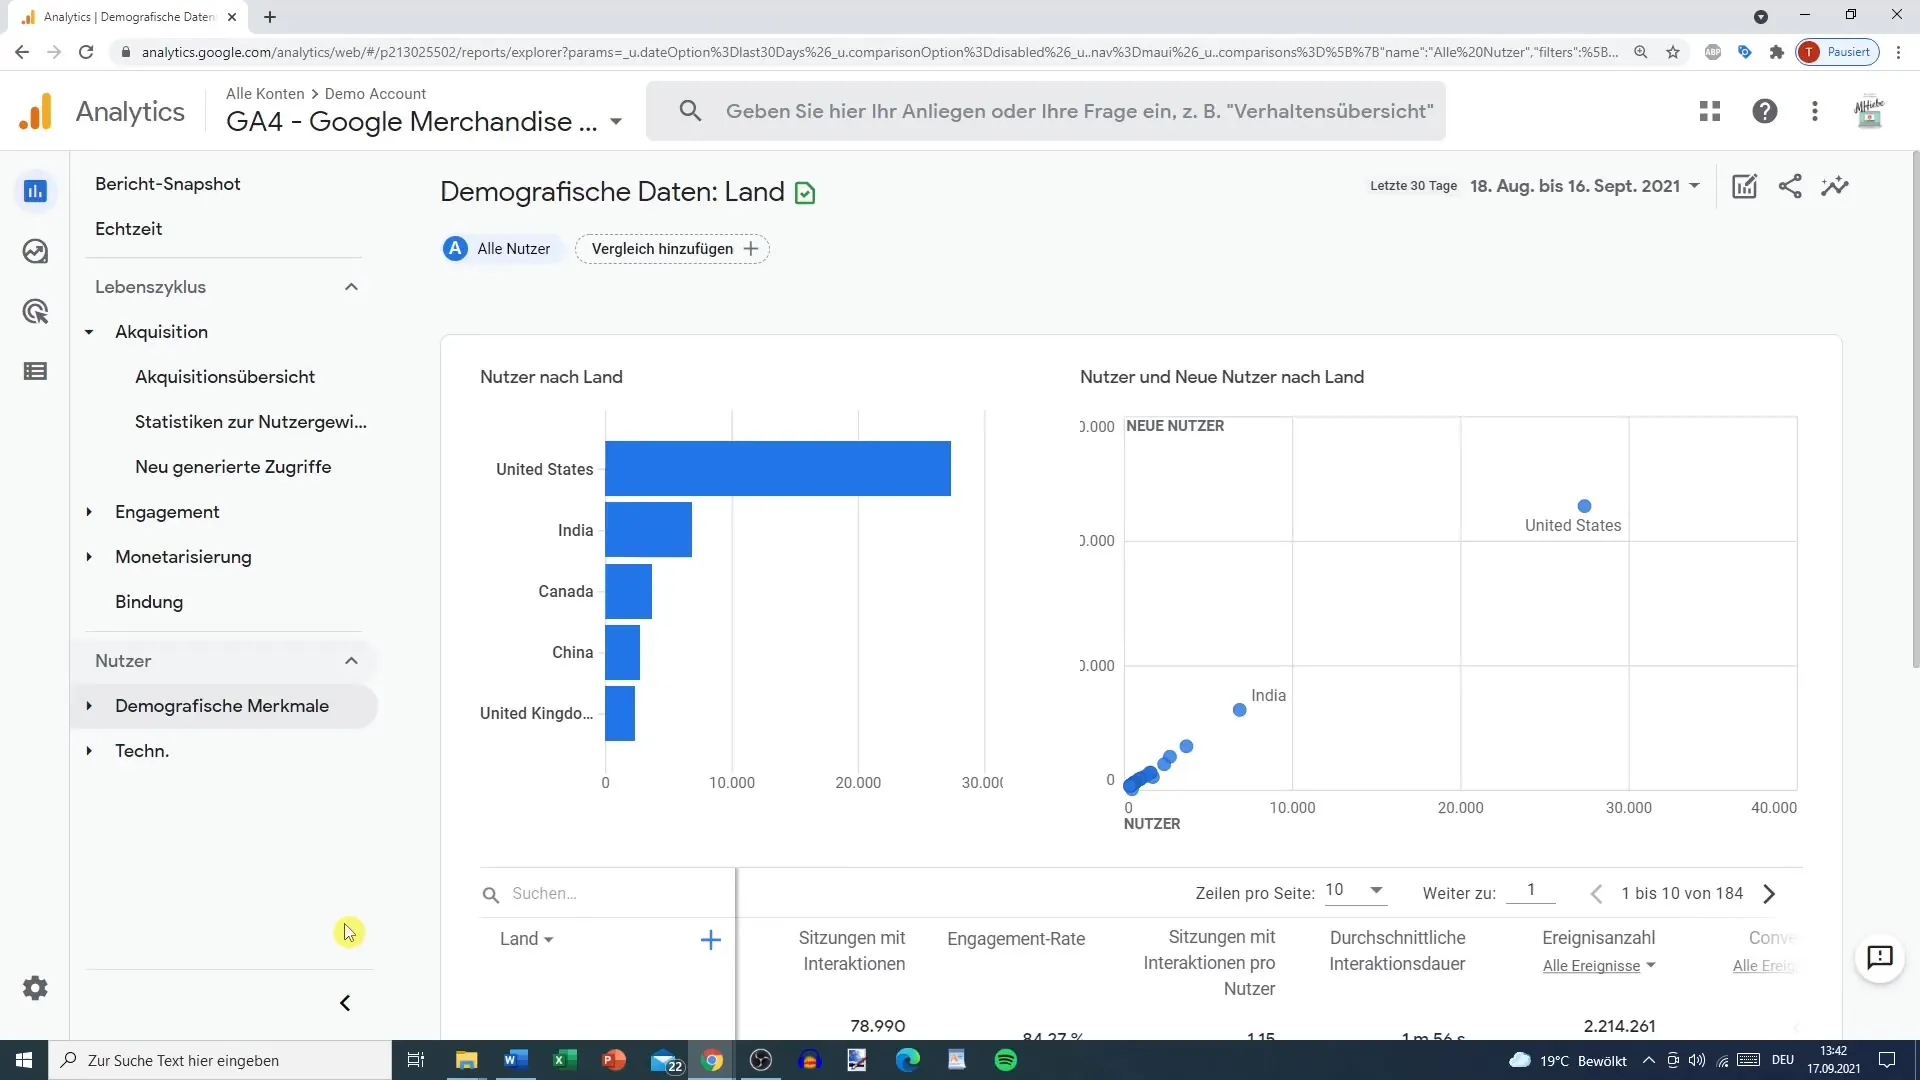
To start analyzing the technical data, you first need to navigate to your Google Analytics account and access the user report. Here, you will see an overview of the technical statistics of your users.
Differentiating Between Web Users and App Users
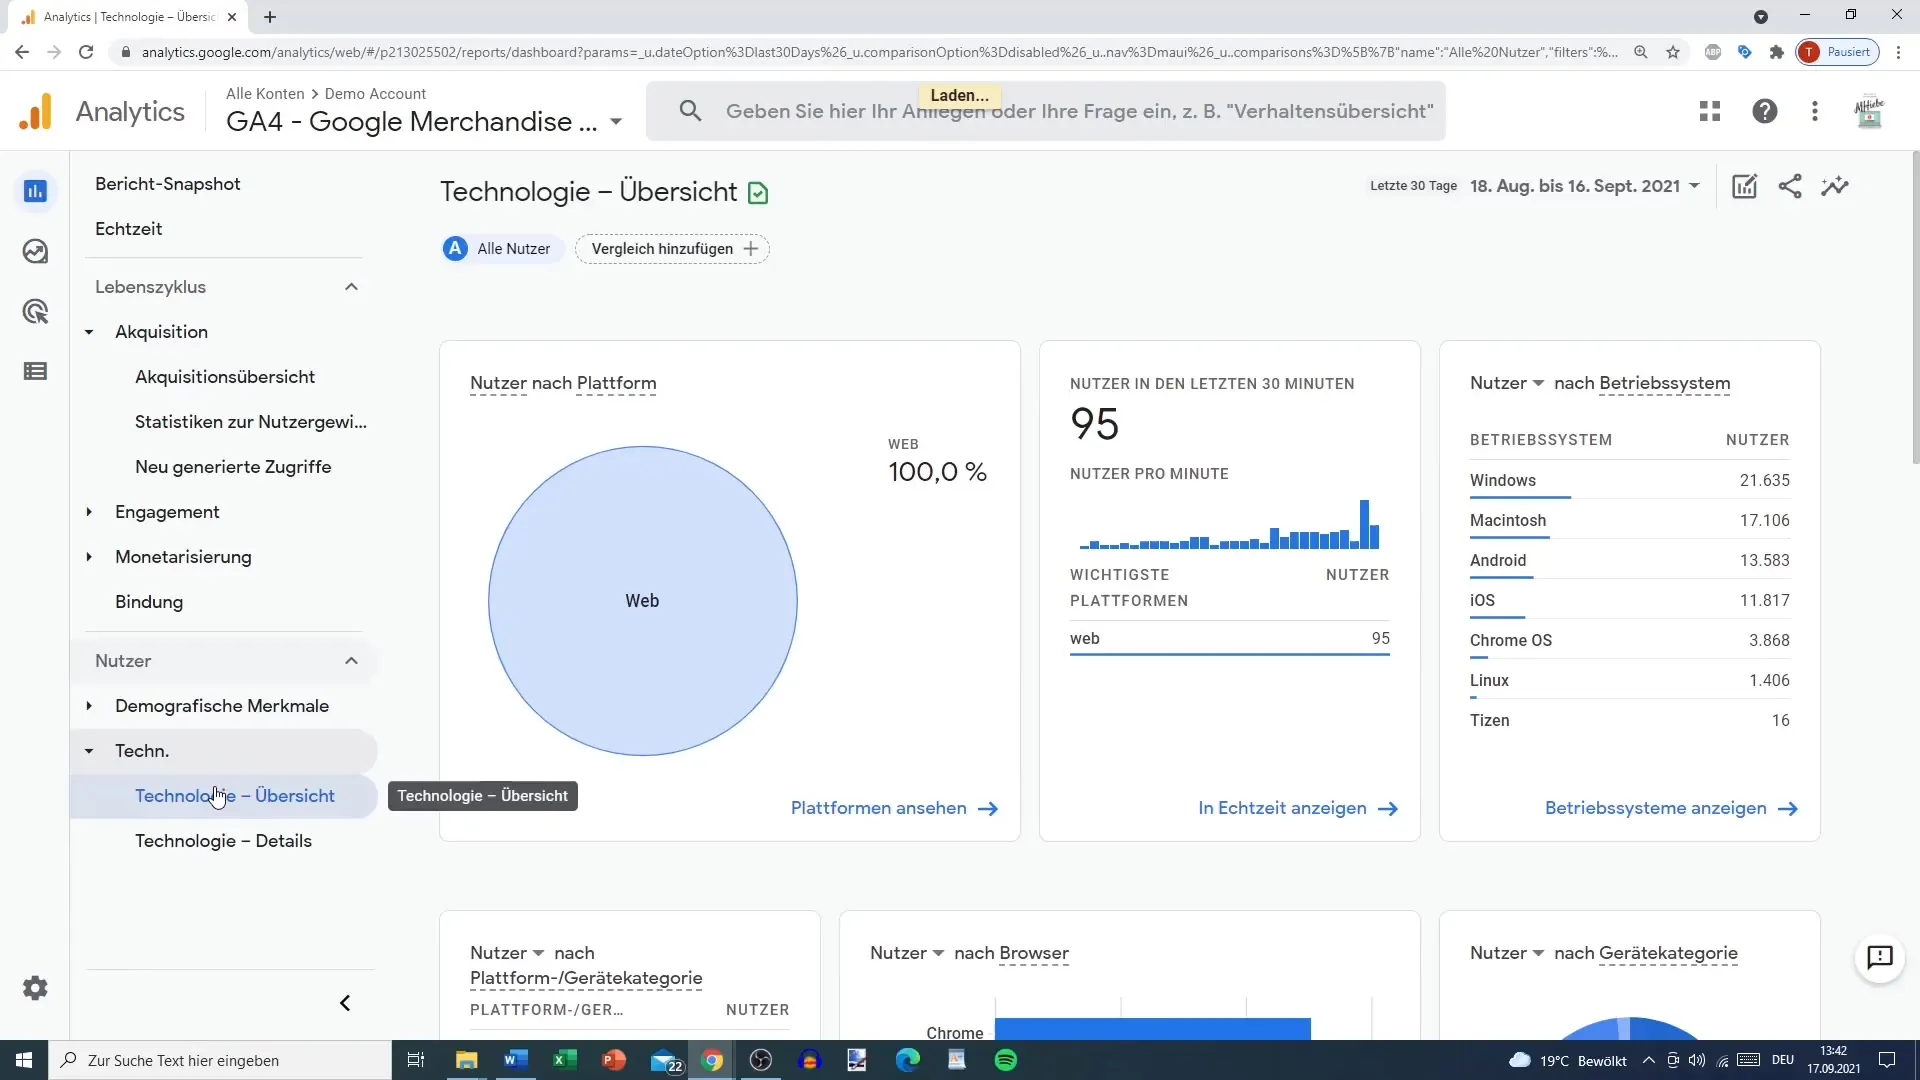
A common misconception is that users of mobile devices are always categorized as mobile users. For instance, when you log into your Google Analytics, you might have listed 100% of users originating from the web platform. However, this does not mean that all users from mobile devices are excluded. A user accessing the website with their smartphone will still be counted as a web user.
Analyzing Operating Systems and Platforms
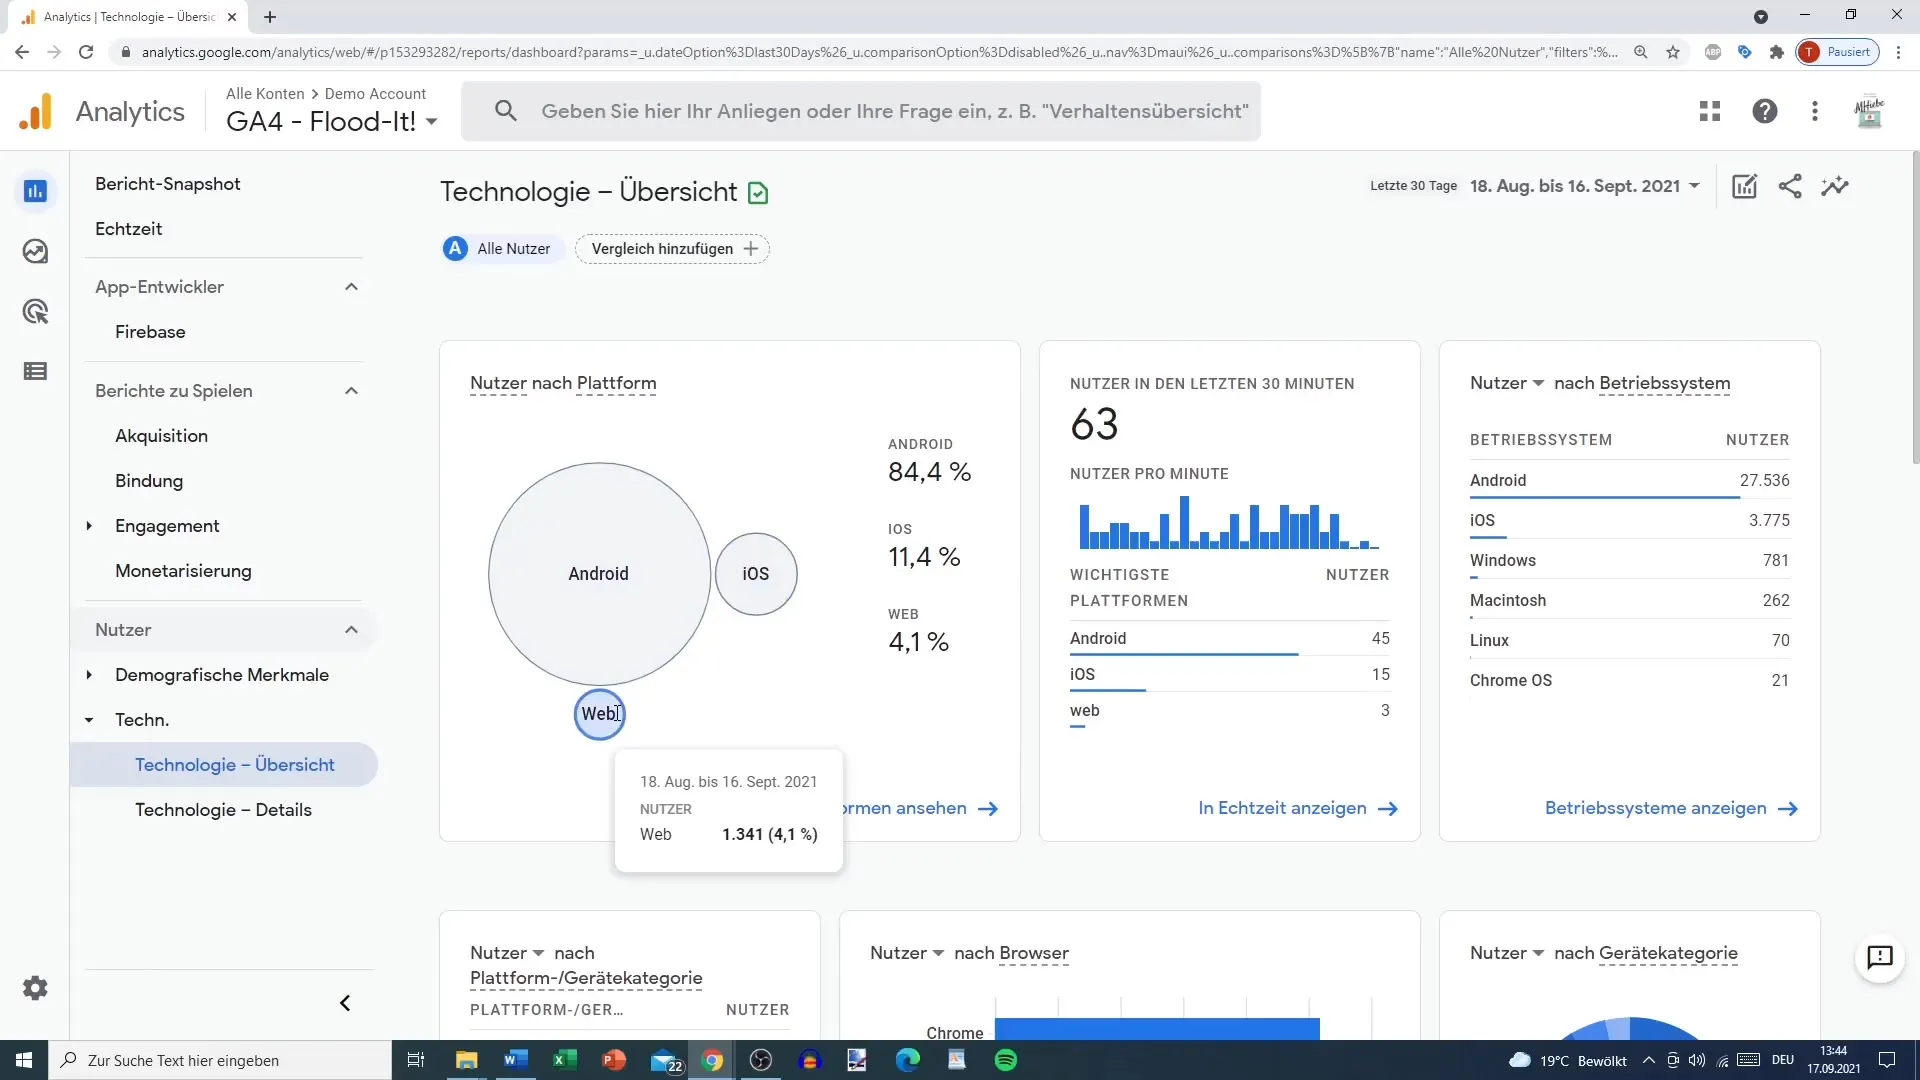
In the next step, you will see technical data regarding the operating systems of your users. Here, you will find out that a high percentage of your users are from Android, followed by iOS and other platforms. Additionally, you can filter the statistics by platforms to see how many users are using your app via the web or directly through mobile devices.
Discovering Gender and Device Types
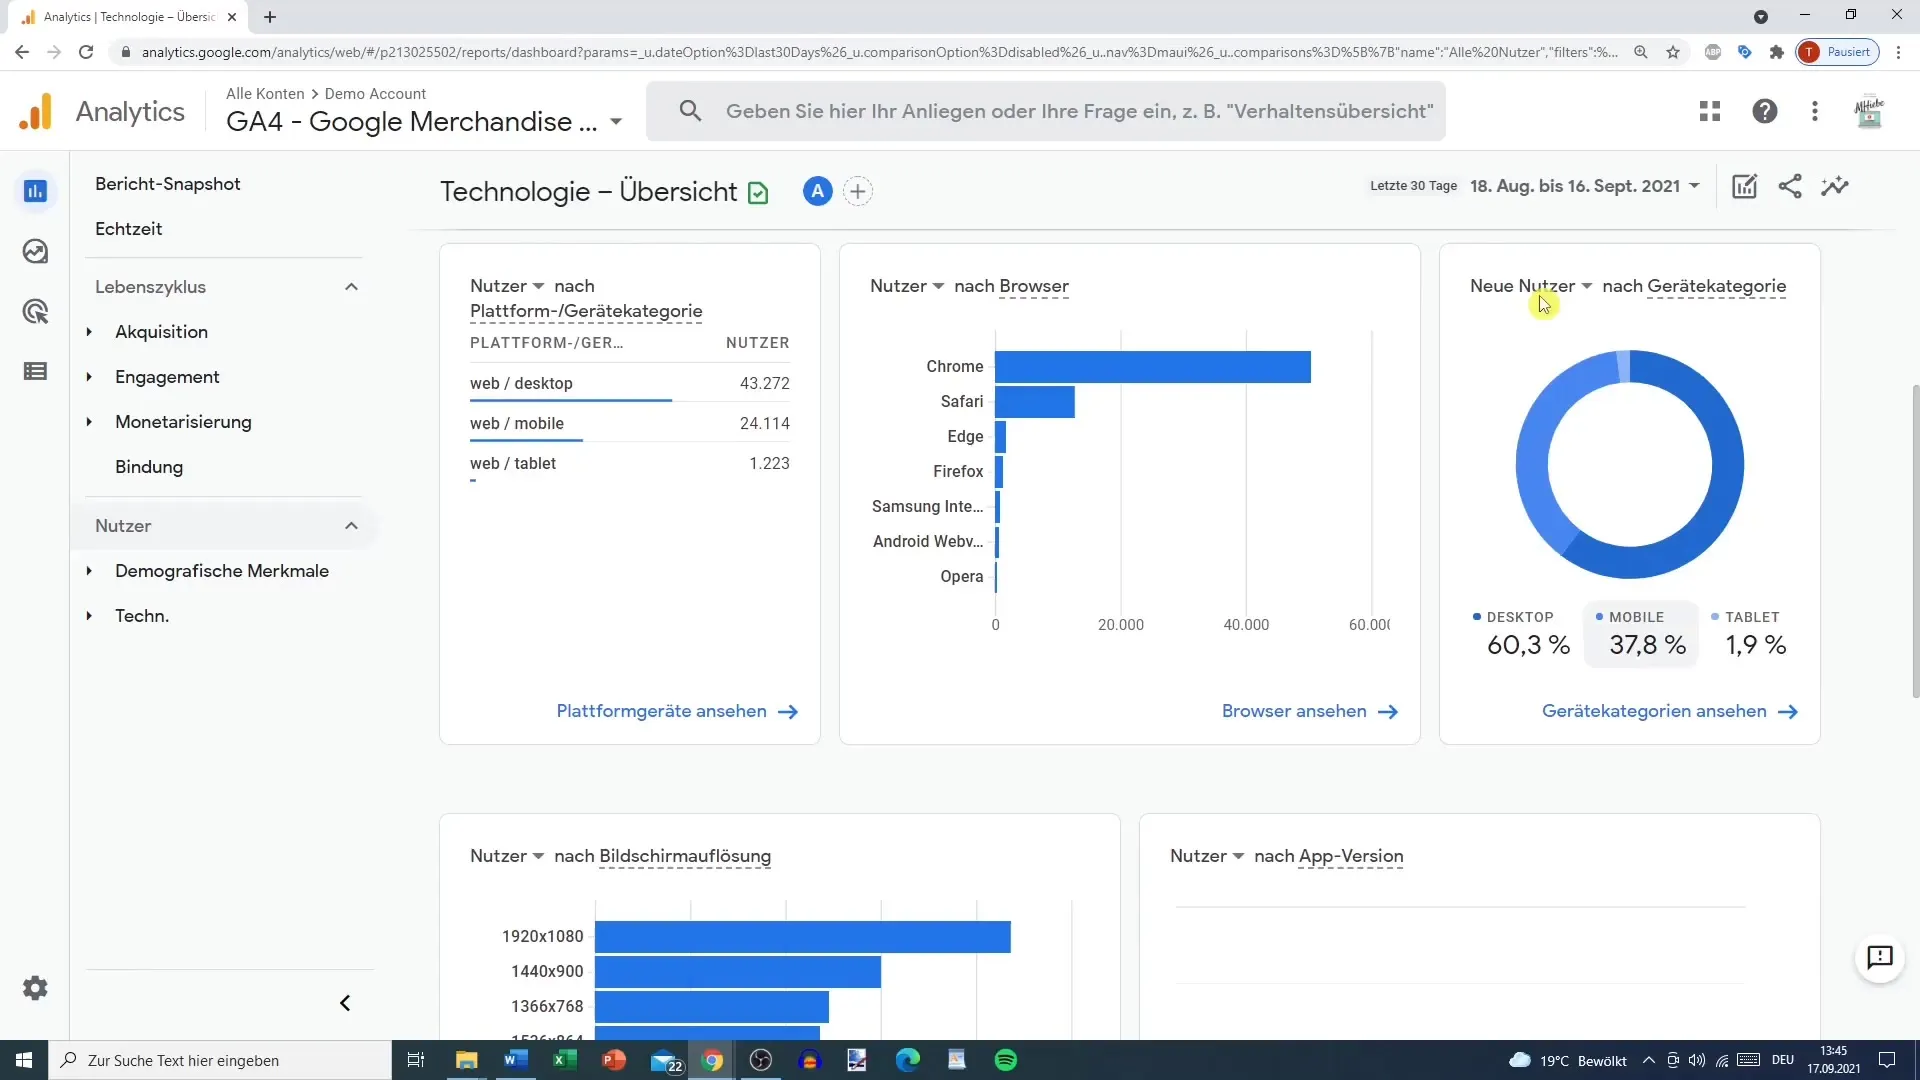
In Google Analytics, you can also differentiate new users from returning ones and even split them by device type – desktop, mobile, and tablet. In many cases, new users often represent mobile users, while returning users frequently use desktop devices. This can help you optimize your marketing strategies effectively, especially if you offer products or services.
Examining Browser Statistics
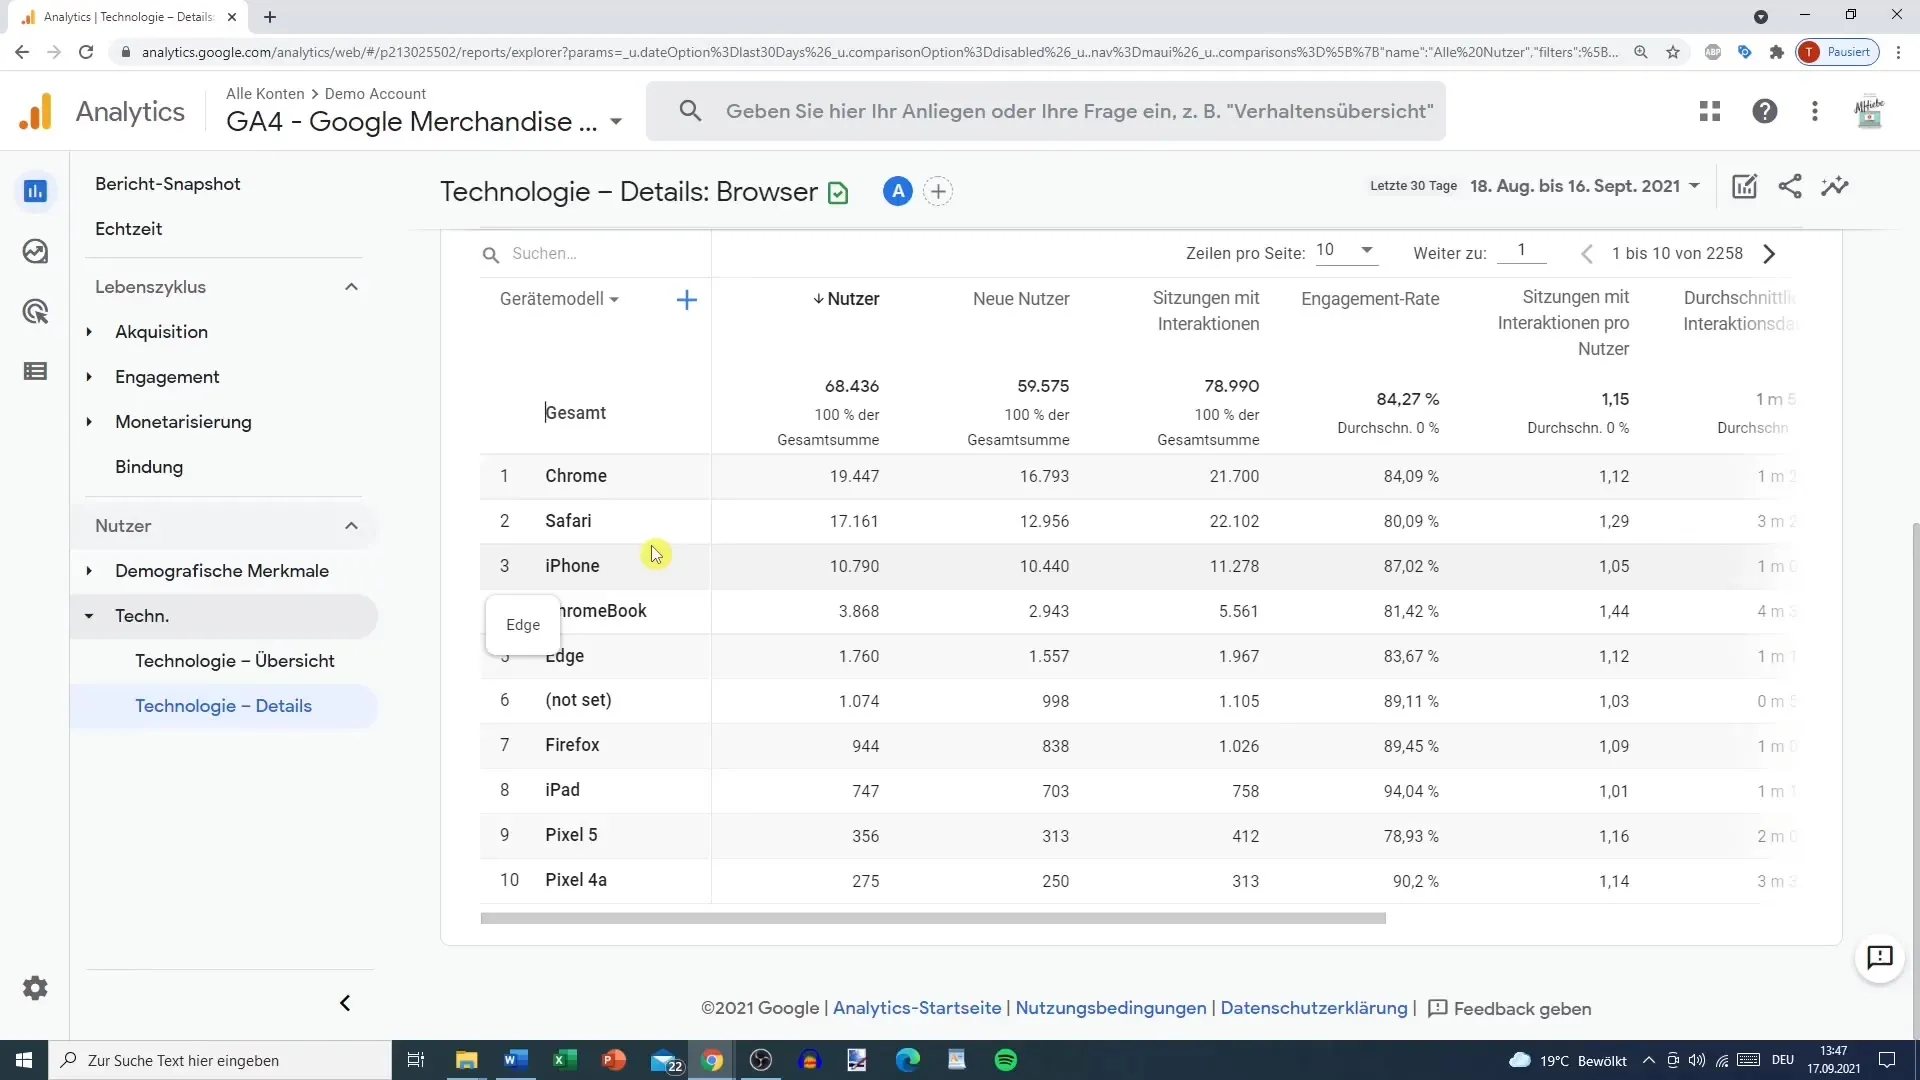
Another important metric in the user report is the distribution of your users' browsers. You will see that the majority of your visitors use Chrome. Understanding these statistics will help you design your website to function optimally on the most commonly used browsers.
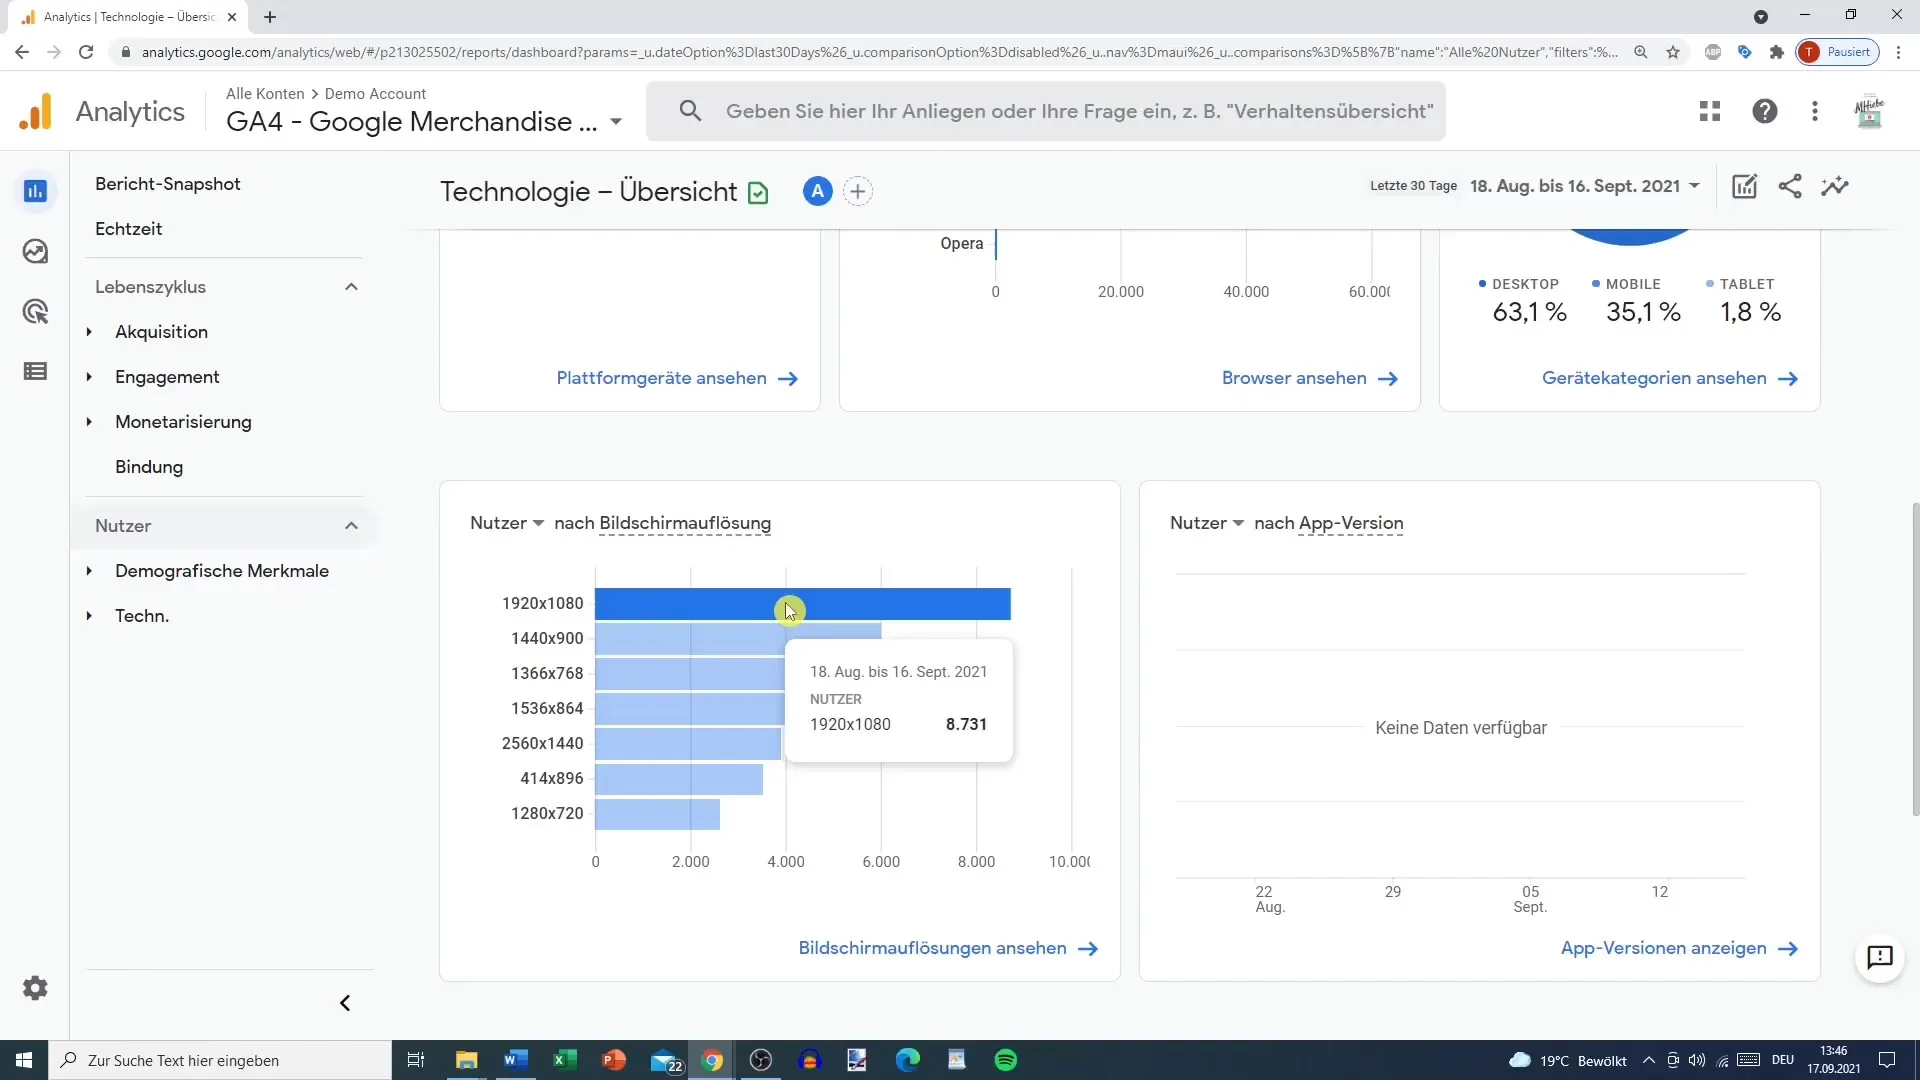
Analyzing Screen Resolutions
Examining the screen resolutions of your visitors can give you insights into how well your website appears on different devices. It's interesting to know how many users visit your site in each resolution and whether adjustments are needed to enhance the user experience.
Detailed Evaluation of Device Groups
If you need more detailed information on device types, you can filter the data by devices. For example, you may discover that there are even users accessing your site via gaming consoles like PlayStation. This insight can give you clues on the importance of developing a multi-dimensional strategy for your website.
Utilizing Revenue Analysis Tools
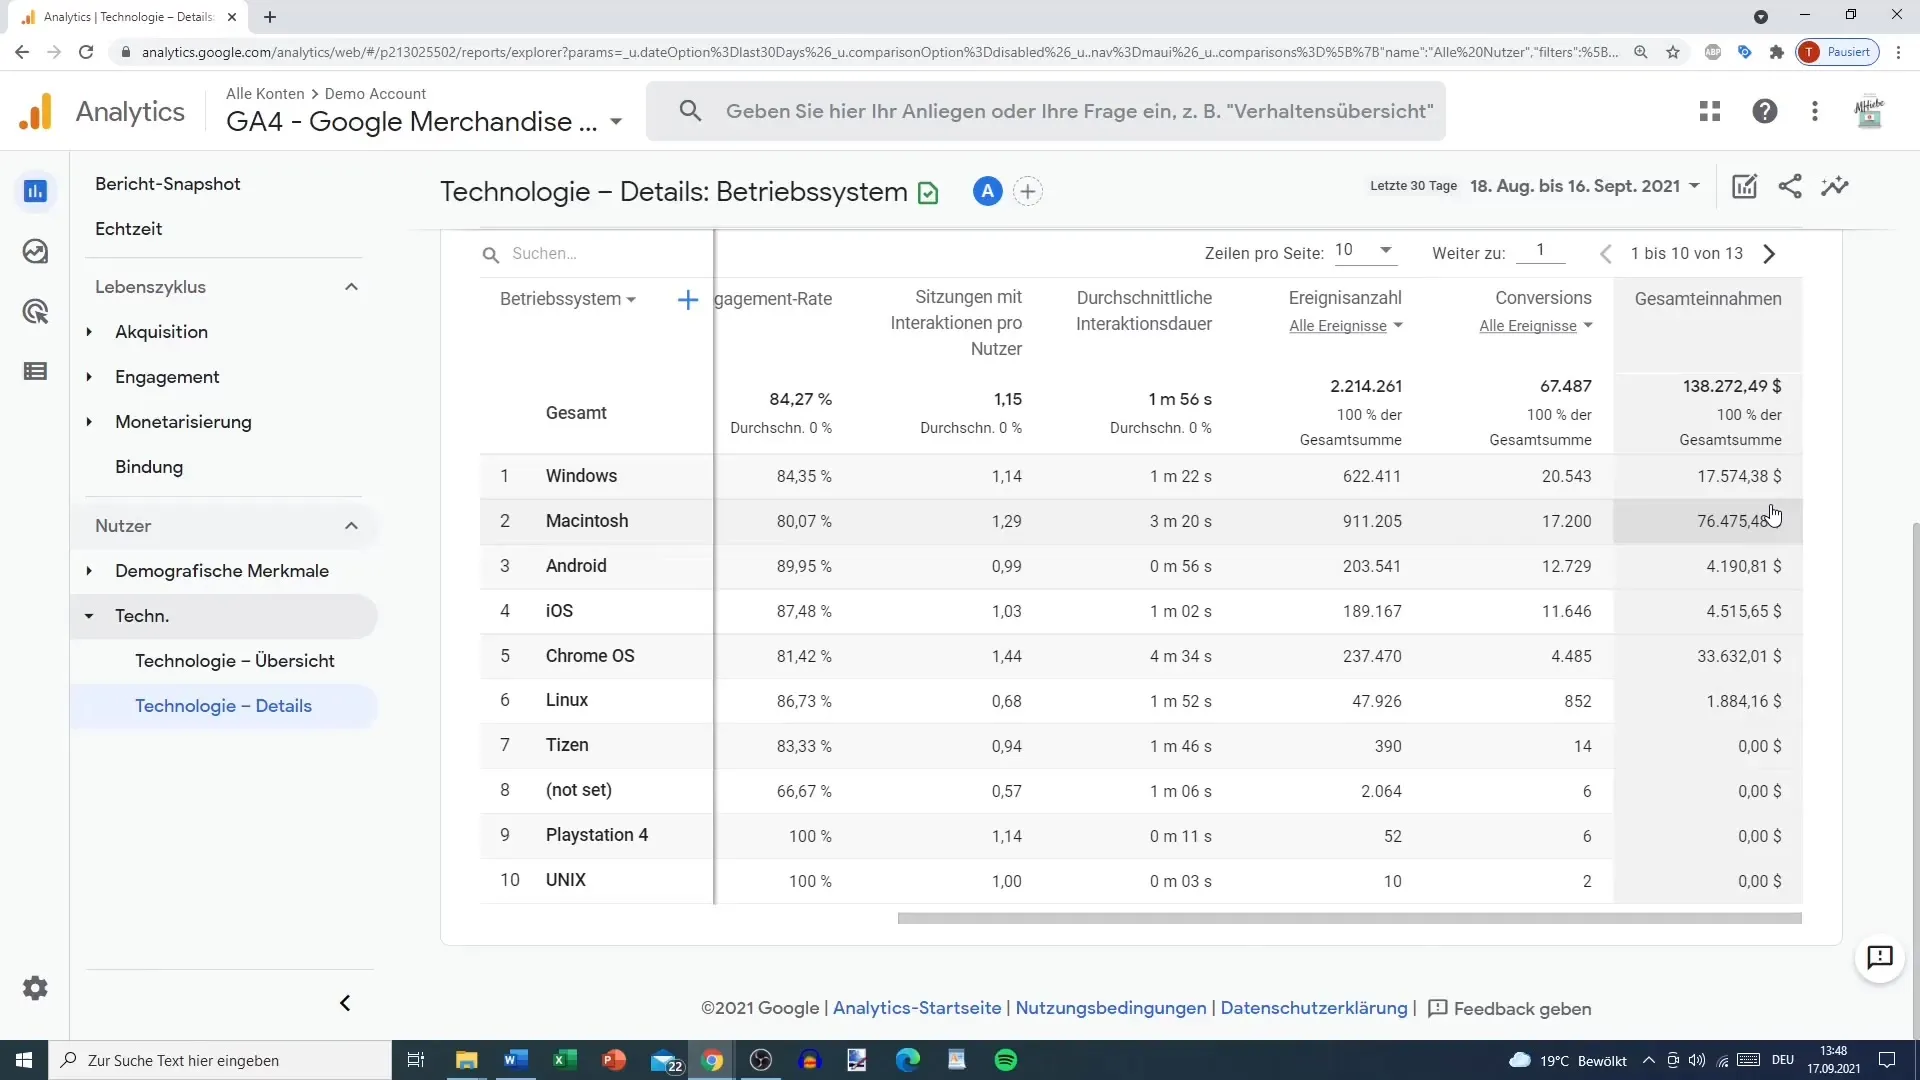
The final sections of the user report provide you with crucial insights into the revenue generated across different platforms. You will notice that Mac users tend to spend more money than Windows users. This information is critical when it comes to adjusting future marketing strategies and catering specifically to different user groups.
Summary
The technical report in Google Analytics provides you with a range of valuable information about the devices, operating systems, and browsers of your users. In order to determine the right optimization strategy for your website or app, it is crucial to carefully analyze this data. Consider how you can use these insights to improve the user experience and ultimately increase conversion rates.
Frequently Asked Questions
How can I view technical data in Google Analytics?You can view the technical data by navigating to your Google Analytics account and accessing the user report.
What does it mean when all users are shown as web users?This means that all users, including mobile users, who visit your website through the web are listed there.
How can I differentiate between new and returning users?You can filter new and returning users in your Google Analytics report to gain better insights into user behavior.
Which browser is most commonly used?In most cases, Google Chrome is the most commonly used browser among the users of your site.
How do I use screen resolutions for optimization?By analyzing the screen resolutions of users, you can determine if your website looks good on different devices or if adjustments are needed.
