Cohort analyses are a powerful tool for understanding user behavior over time. They provide insights that go beyond simple metrics and help to identify trends and patterns in specific user groups. This tutorial will help you effectively conduct cohort analyses in Google Analytics so you can leverage the full potential of your data.
Key Insights
- Cohort analysis allows tracking user groups over different time periods.
- Historical data provide information on user engagement and retention.
- Adjusting segments and values in the analysis can lead to more detailed insights.
Understanding Cohort Analysis
Cohort analyses are a specific area of exploratory data analysis. They allow you to group users based on specific criteria such as registration date or first purchase and track their behavior over a defined period. This is particularly useful to determine how many users are active on your platform from week to week and how their activities evolve.
Steps to Conducting a Cohort Analysis
1. Accessing the Cohort Analysis
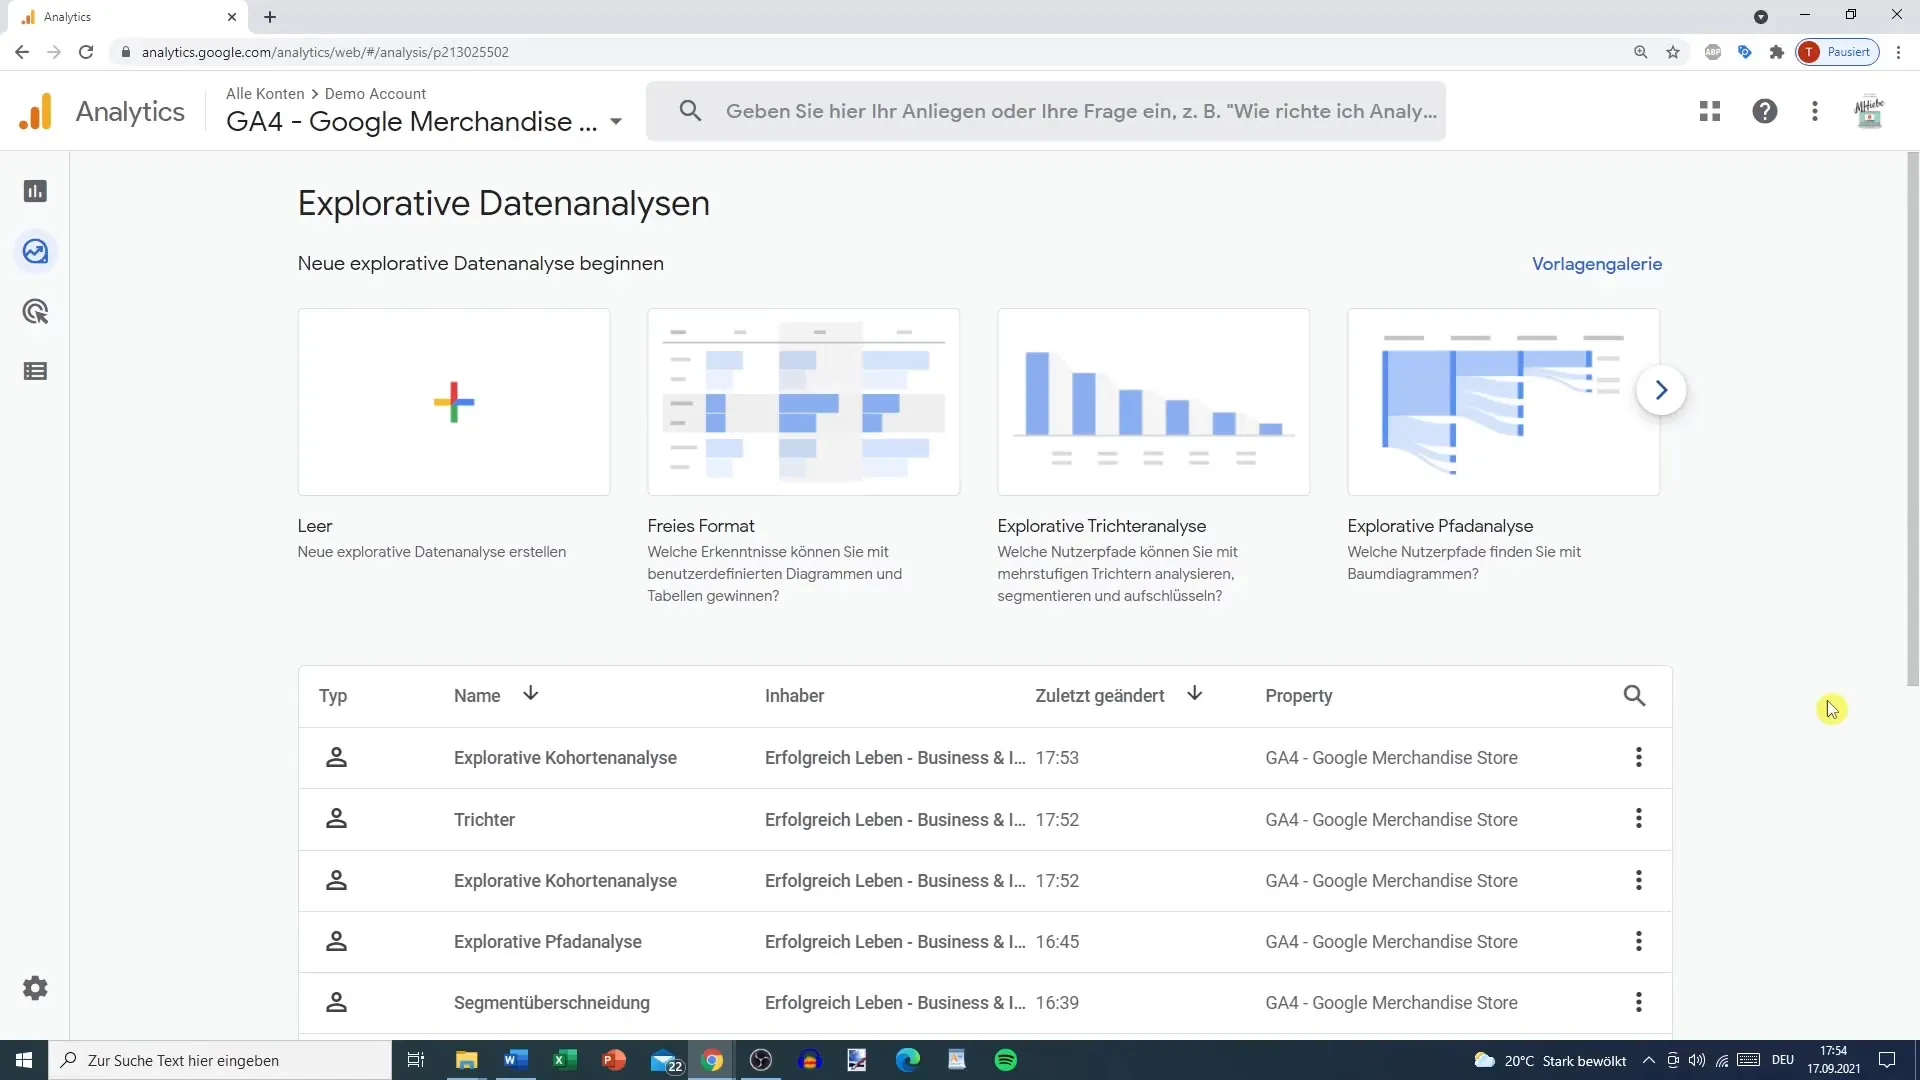
To start the cohort analysis in Google Analytics, open the corresponding dashboard. Navigate to the section where the cohort analysis is available. You can choose between different templates that give you an overview of user groups.

2. Selection of Metrics and Time Periods
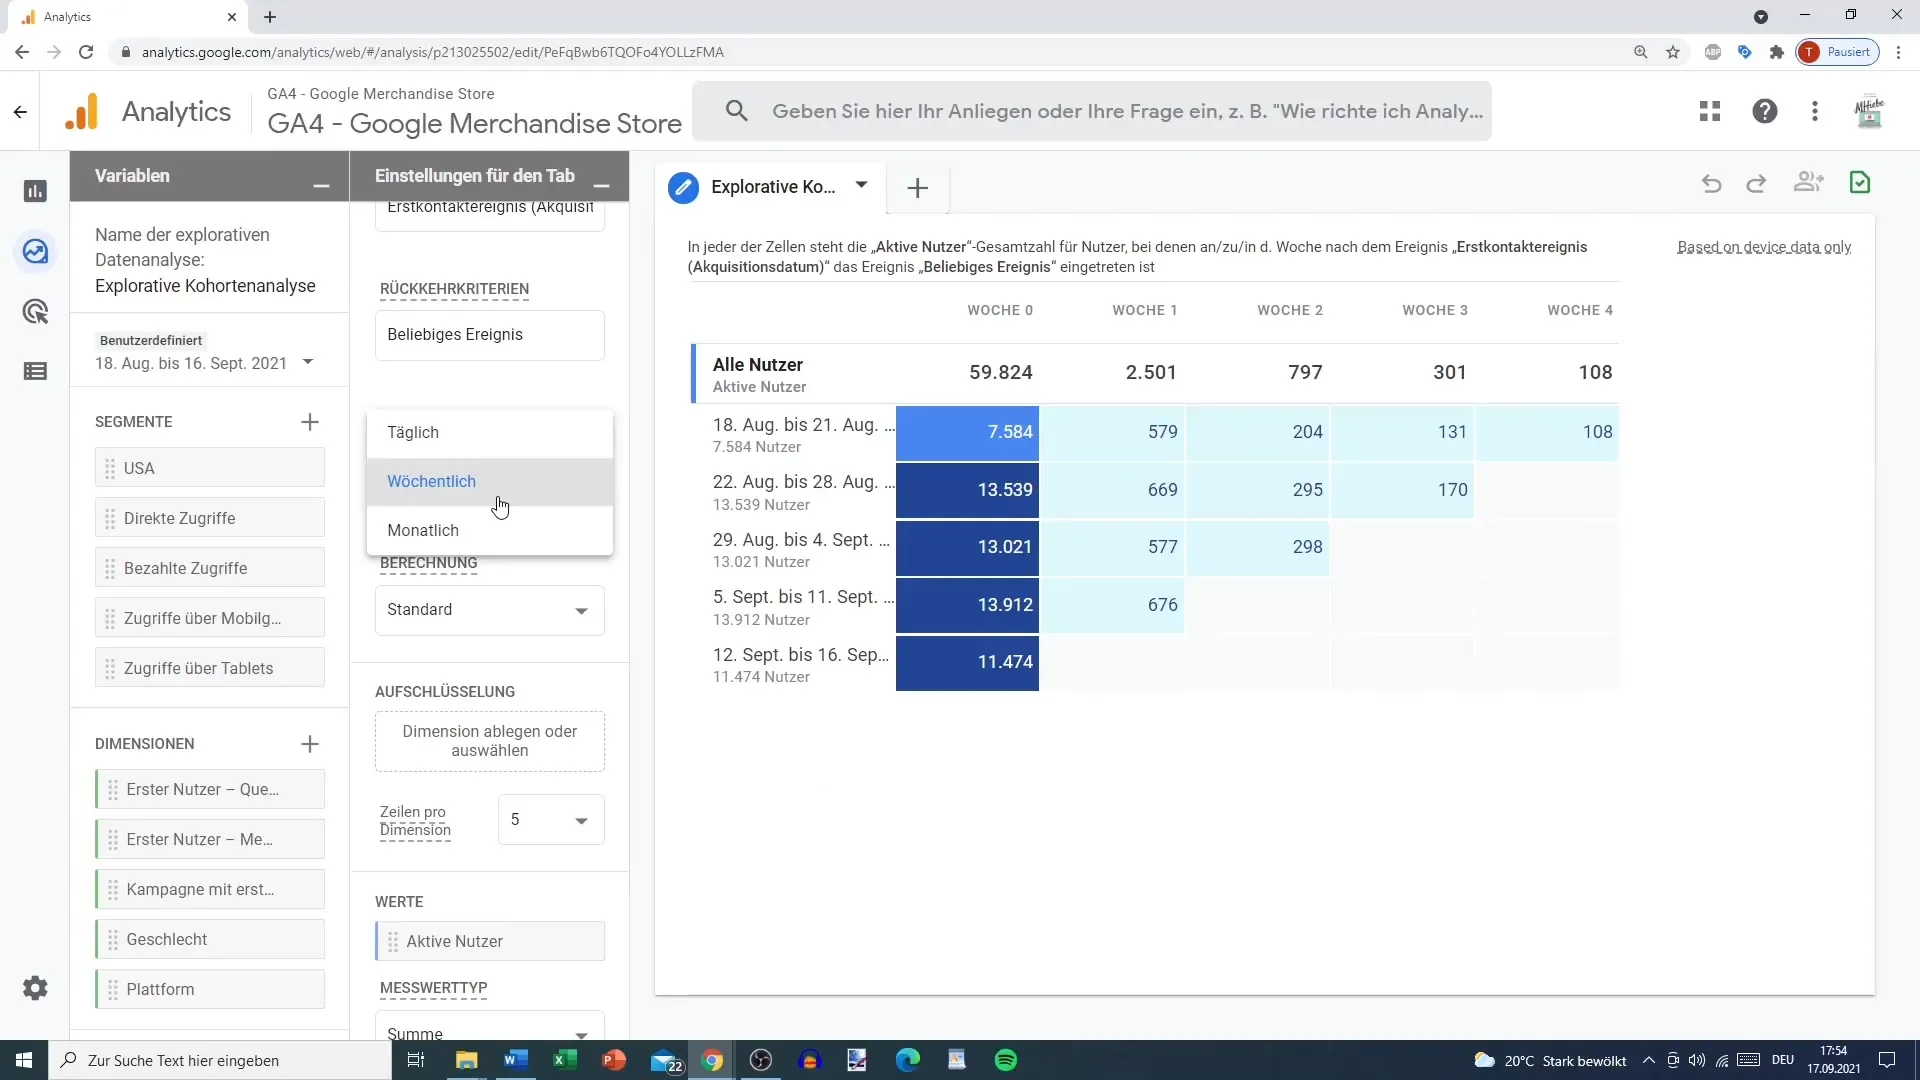
After accessing the cohort analysis tools, you can decide whether you want to analyze user data weekly or daily. In our case, we choose daily analysis and limit the number of rows per dimension. This decision impacts the loading times of the data analyses.
3. Analyzing User Activities
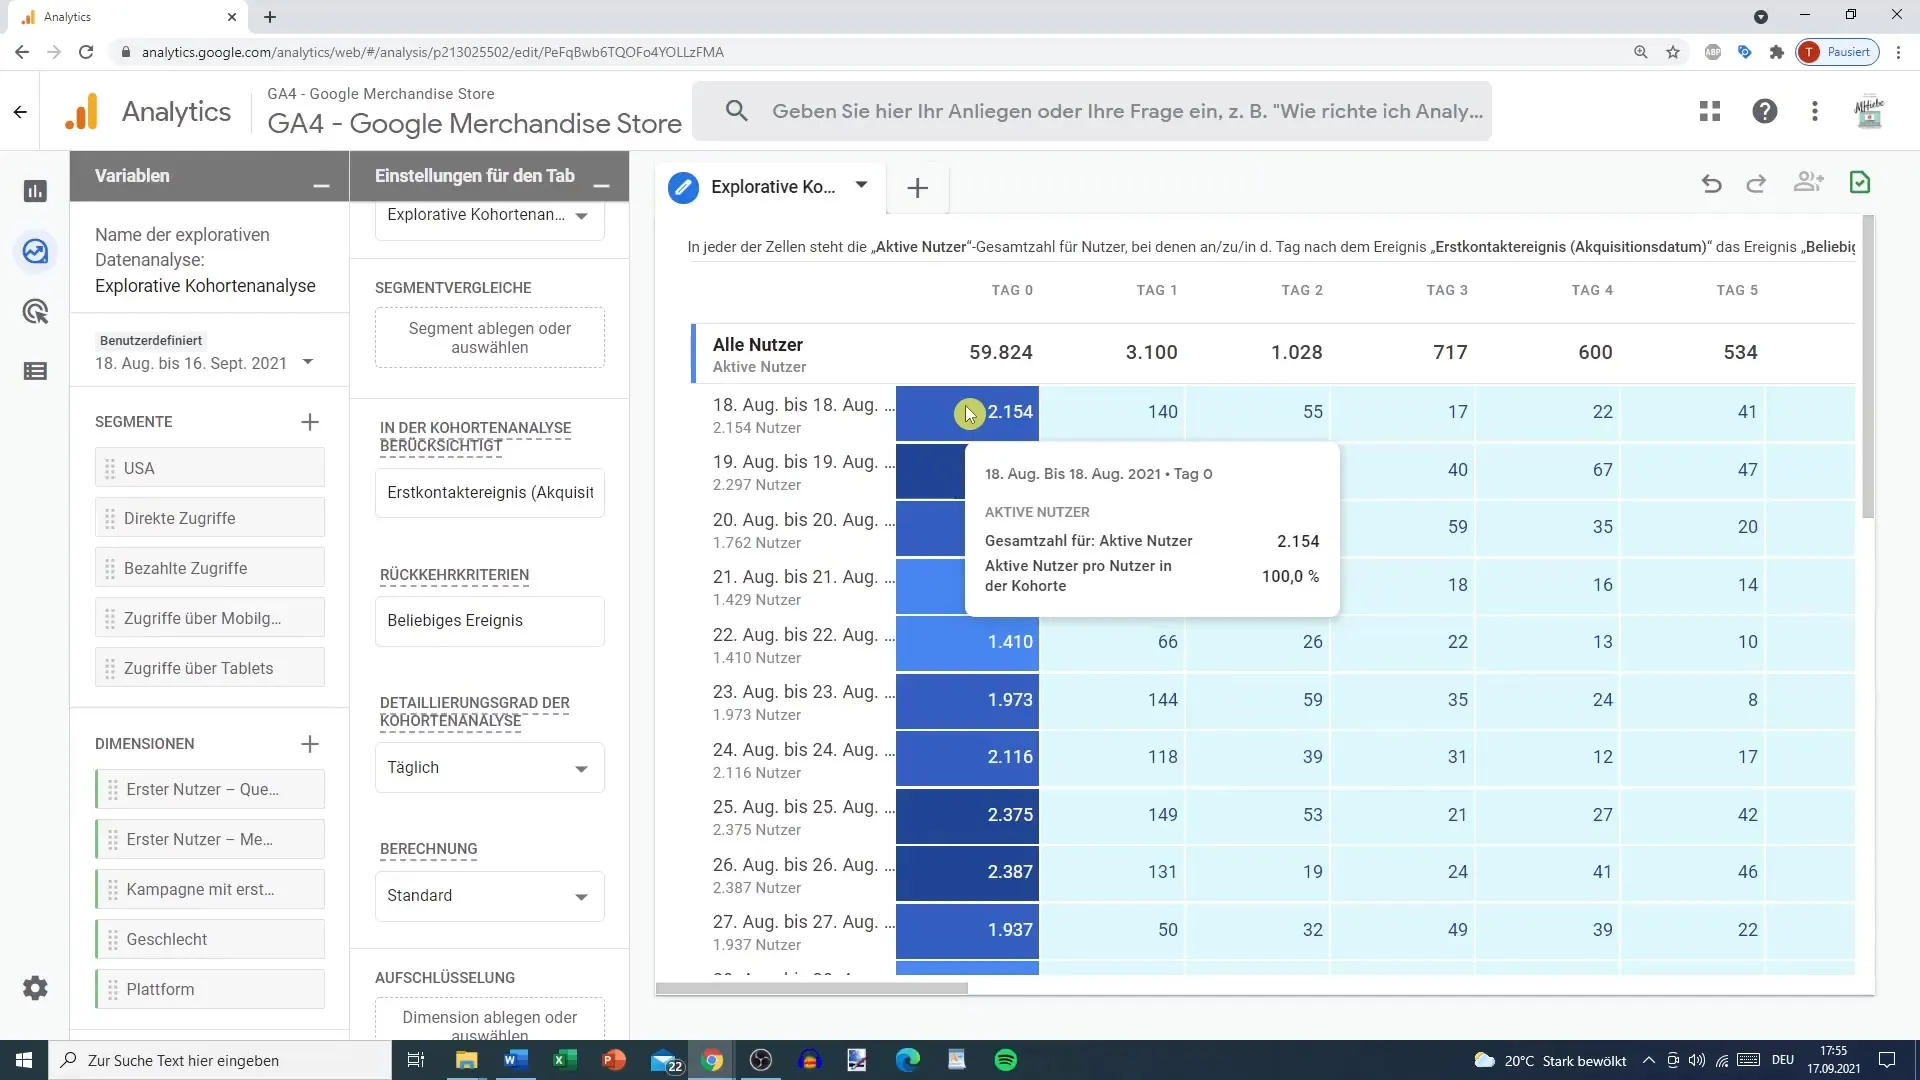
In the cohort analysis, you can see the active users within a specific time frame. For example, the data shows how many users were active on your site on August 18. These numbers illustrate how many users interacted on that day and what percentages returned on following days.
4. Understanding Percentage Shares
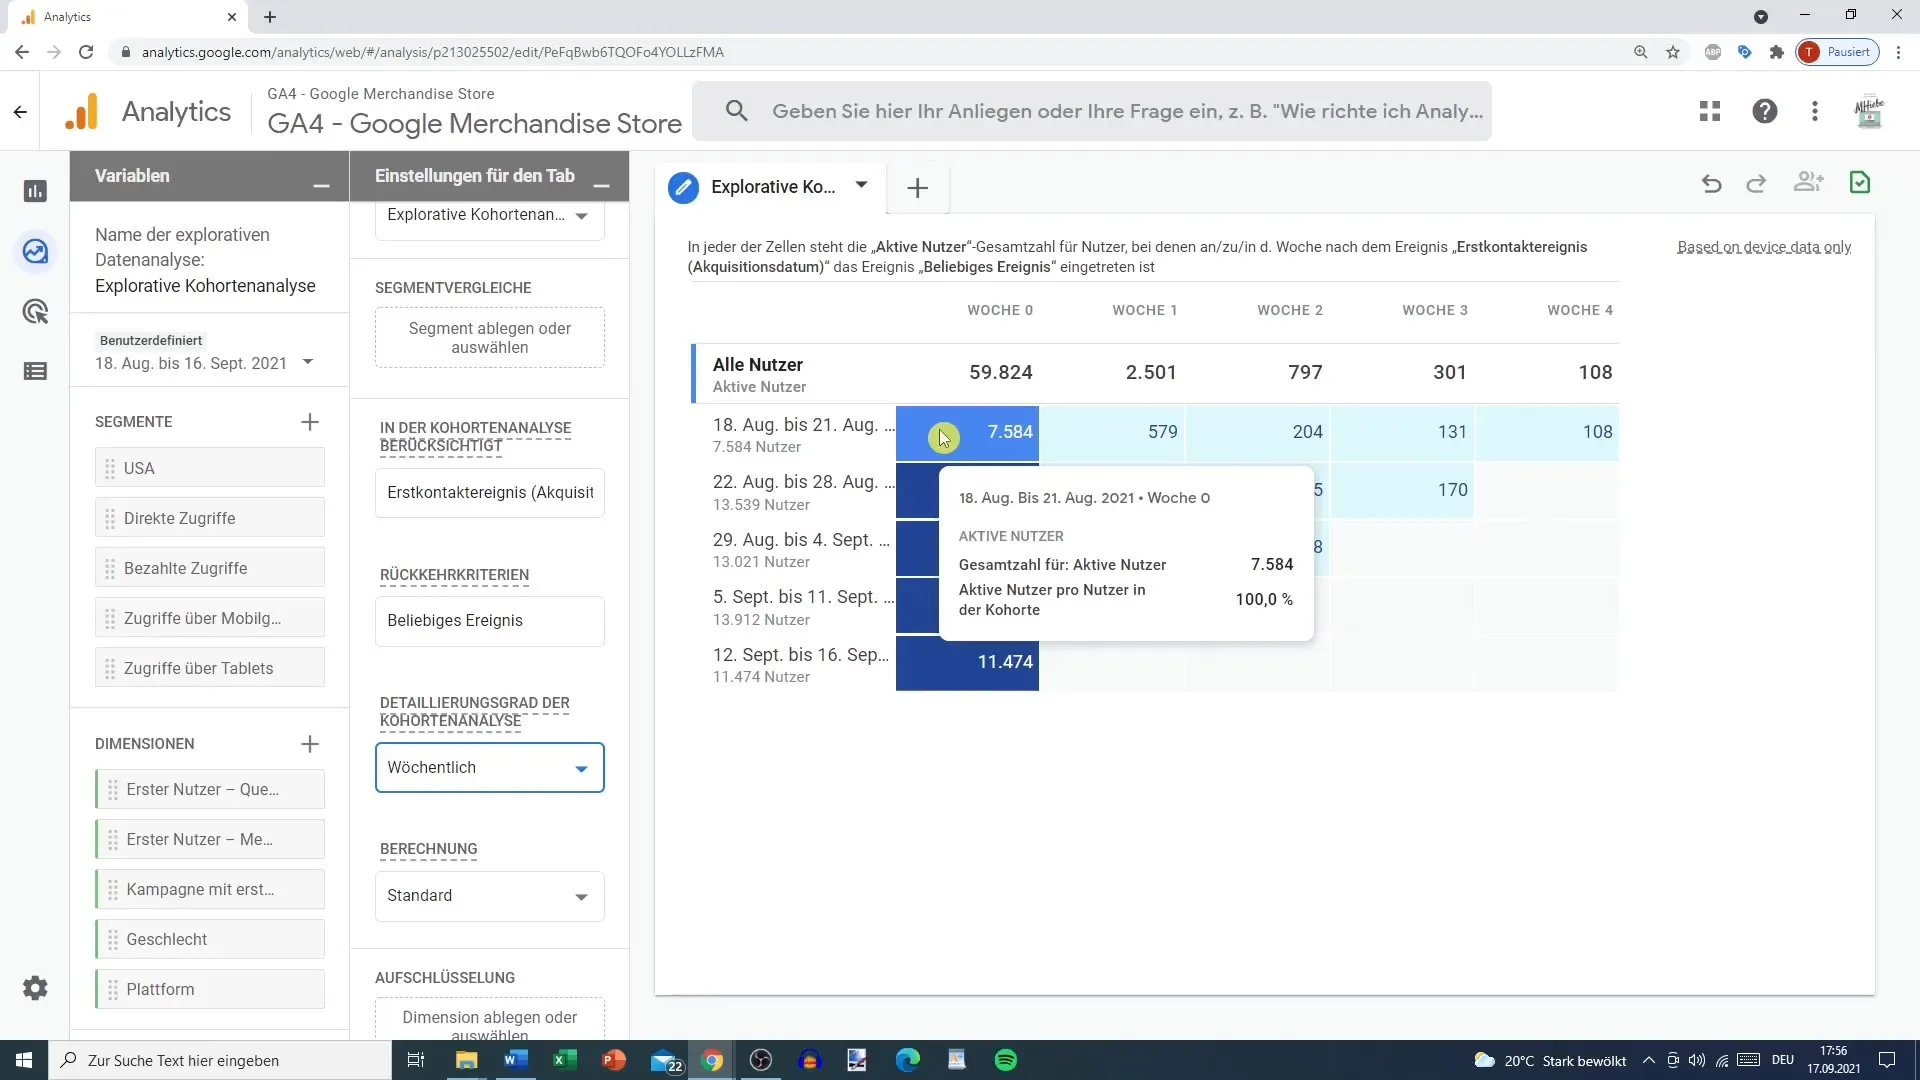
The cohort analysis not only shows you the absolute numbers of active users, but also the percentage of returners over time. This allows you to determine how well your platform retains users in the long term. This requires weekly data analysis to get a clear picture of the trends.
5. Adjusting Metrics
An important feature of cohort analysis is the ability to adjust the values you want to analyze. In addition to user numbers, you can also keep track of other metrics such as revenues or event numbers. However, you should be cautious about which metrics you use, as not everything is meaningfully representable.
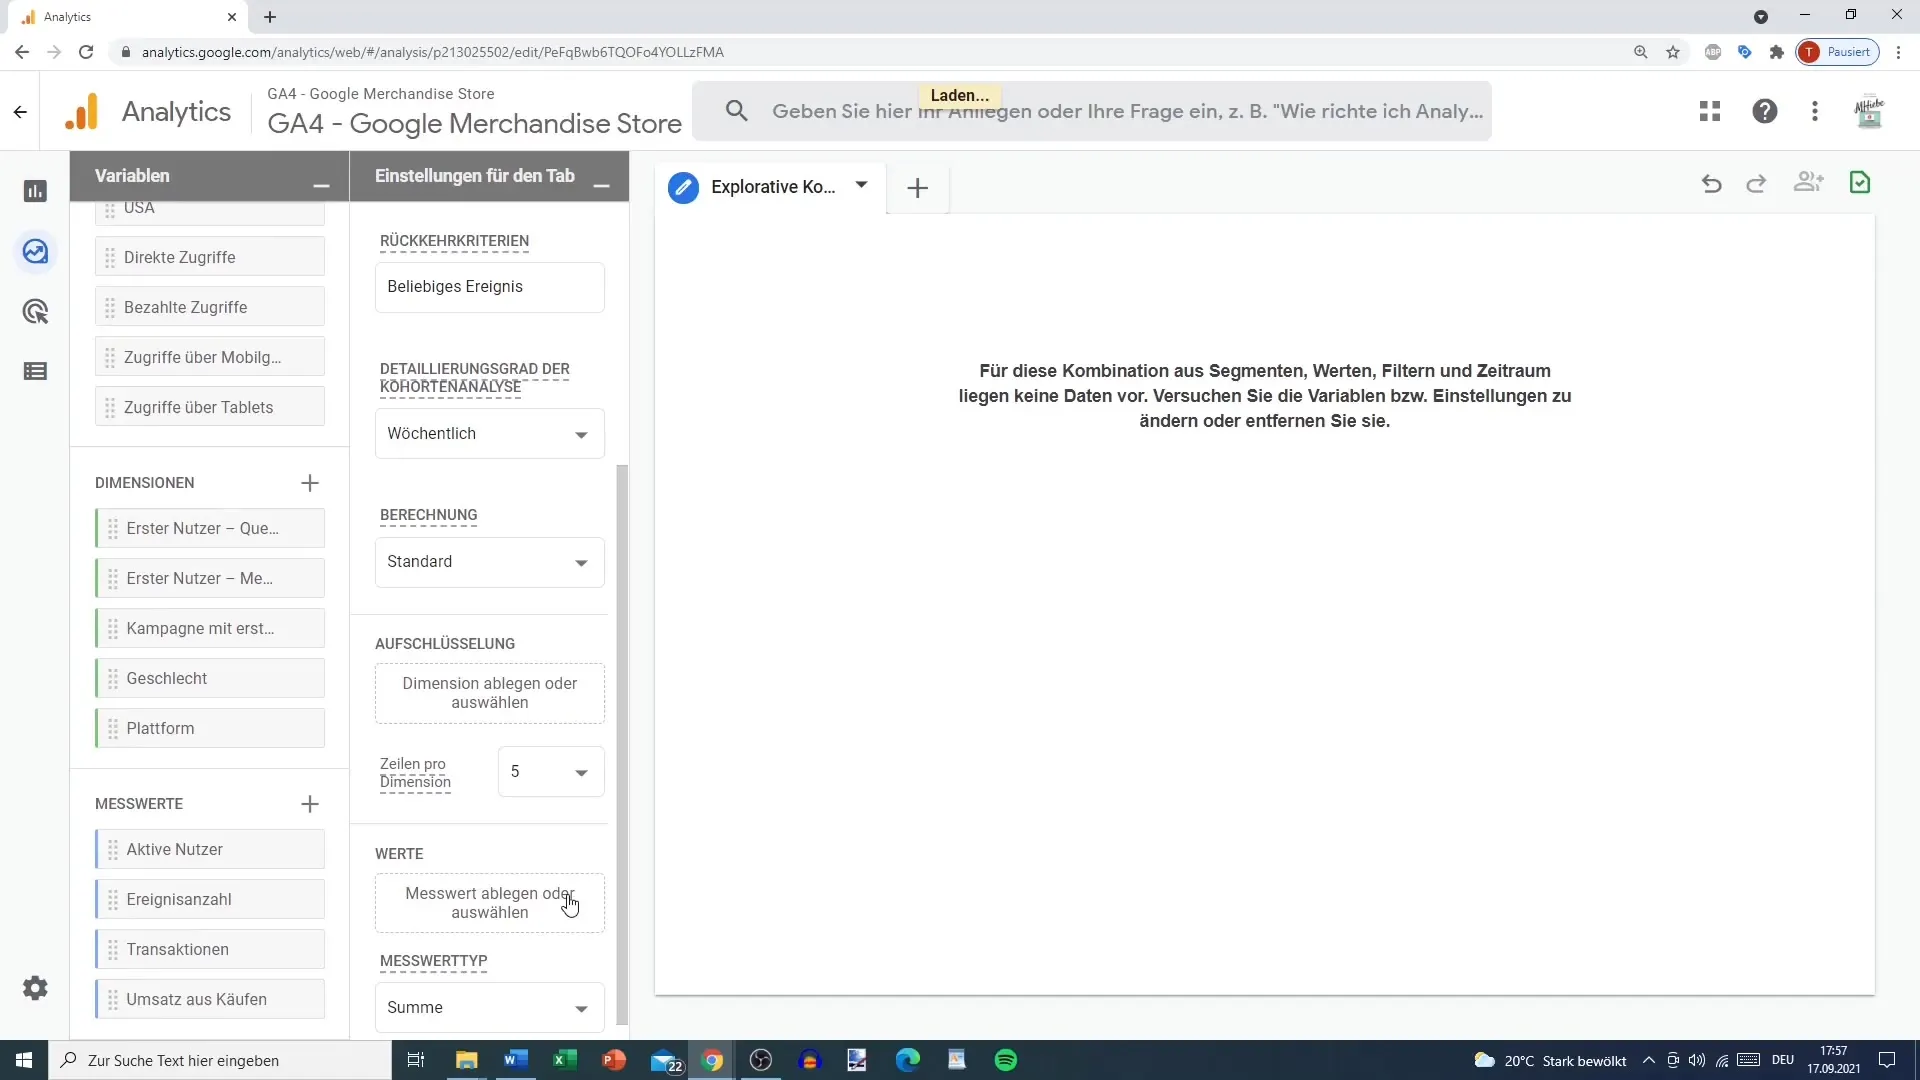
6. Experimenting with Different Segments
To gain deeper insights, you can try combining or comparing different segments. This can help you identify specific user behaviors. Remember that it is useful to experiment with the available options to find out which information is most relevant for your analysis.
Summary
Cohort analysis allows you to track and understand the dynamics of your users over time. You learn how many users remain active and what factors influence the return rate. By making targeted metric adjustments and experimenting with segments, you can break down conflicting data and ultimately make strategic decisions based on informed analyses.
Frequently Asked Questions
What is a cohort analysis in Google Analytics?A cohort analysis is a method for tracking and analyzing the behavior of user groups over a specific period of time.
How can I use cohort analysis in Google Analytics?You can use cohort analyses to segment users based on their interaction date and analyze their return rate and engagement.
Which metrics should I consider in cohort analysis?You should consider both the number of active users and their return rate, as well as revenues or engagement metrics.
Which time interval is better for cohort analysis: daily or weekly?It depends on your goal. Daily analyses are more precise, while weekly analyses can provide a better overview.
Can I create individual segments in cohort analysis?Yes, Google Analytics allows you to create individual segments to gain more specific insights from the data.
