The exploratory data analysis is an essential part of working with data, especially in the field of online marketing. With Google Analytics, you have a powerful tool at your disposal to gain deeper insights into user behavior. In this guide, I will take you through the basic steps of exploratory analysis that will help you make the most of Google Analytics. Let's get started!
Key Insights
- Google Analytics offers various templates for exploratory analysis.
- You can use different segments, dimensions, and metrics to create detailed queries.
- Visualization options such as pie charts, line charts, and heatmaps help to represent the data more visually.
- Custom segments allow you to carry out tailored analyses.
Step-by-Step Guide to Exploratory Analysis
Tab Selection and Templates
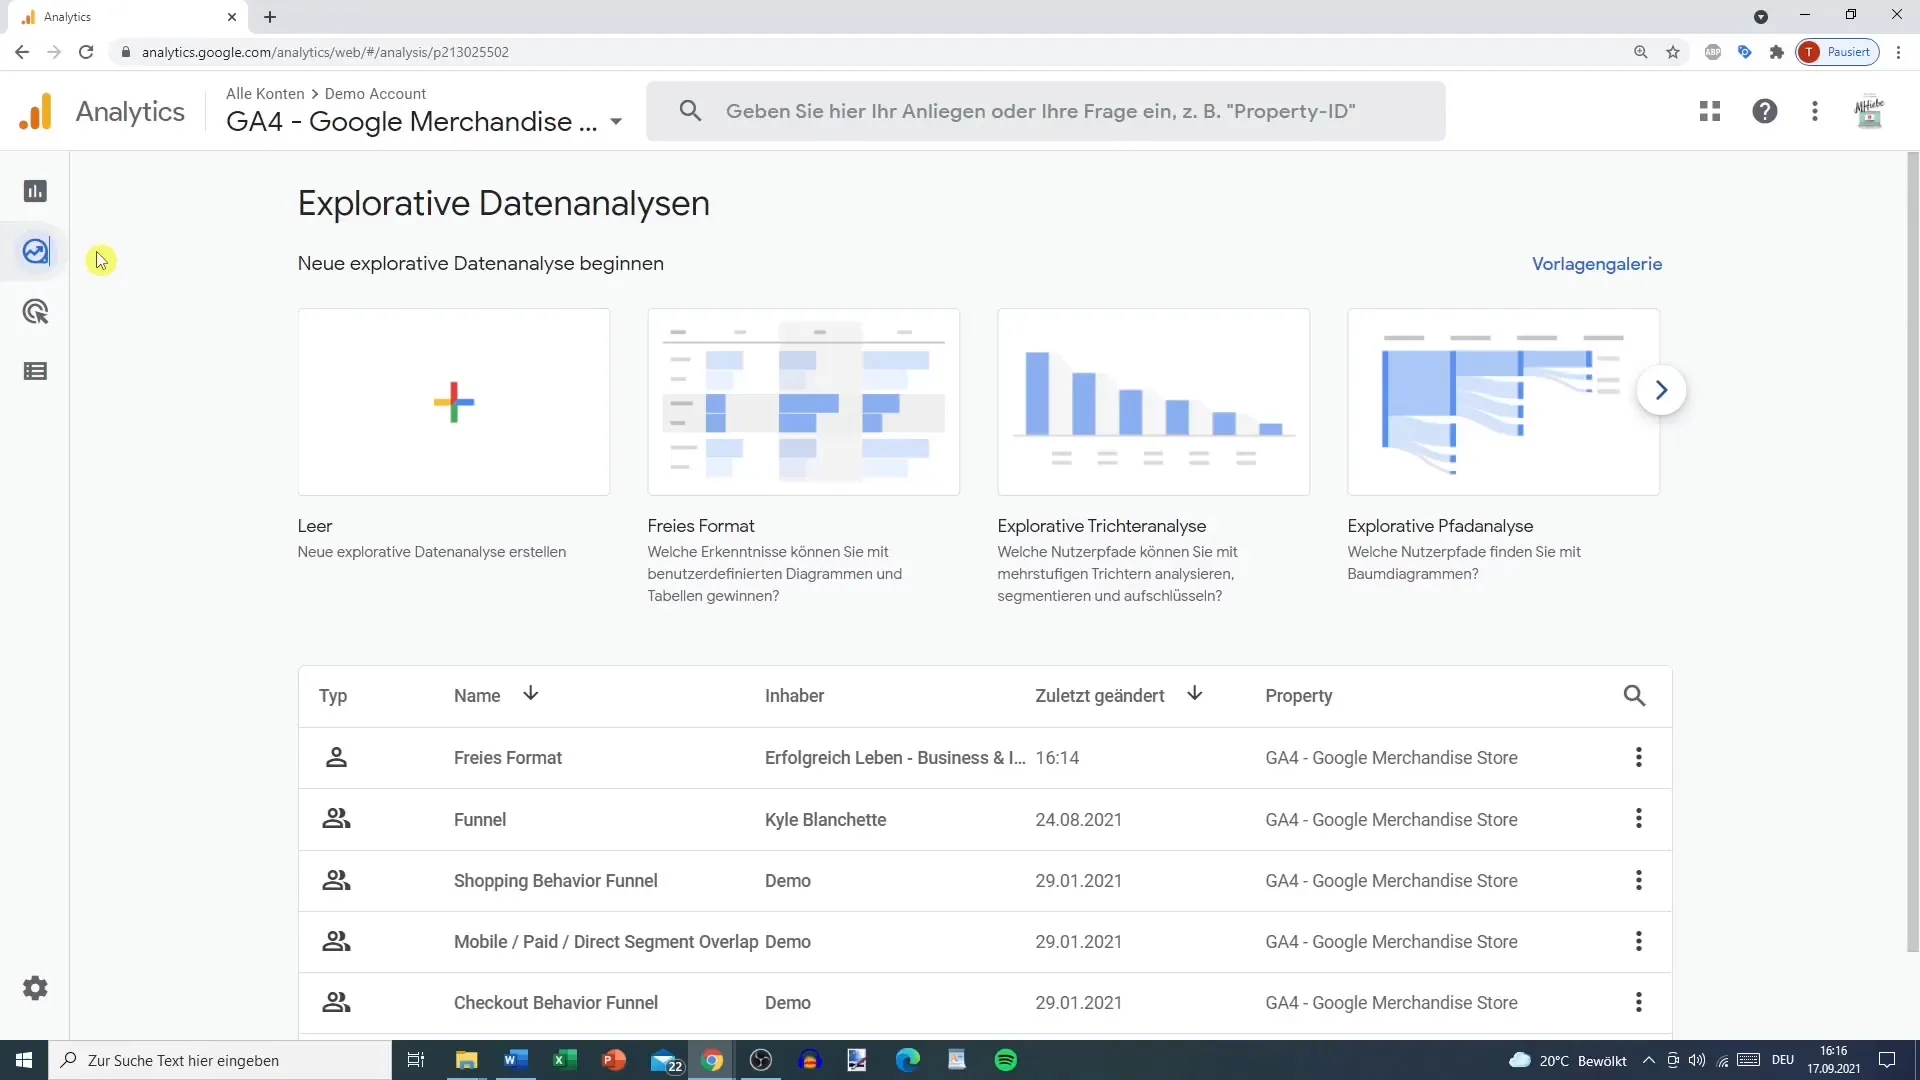
At the beginning of exploratory analysis, you select the templates available to you in the tab. The options are versatile, including the freely selectable template, the funnel analysis, and the path analysis. To better illustrate the possibilities, I will first open the template for the free format.
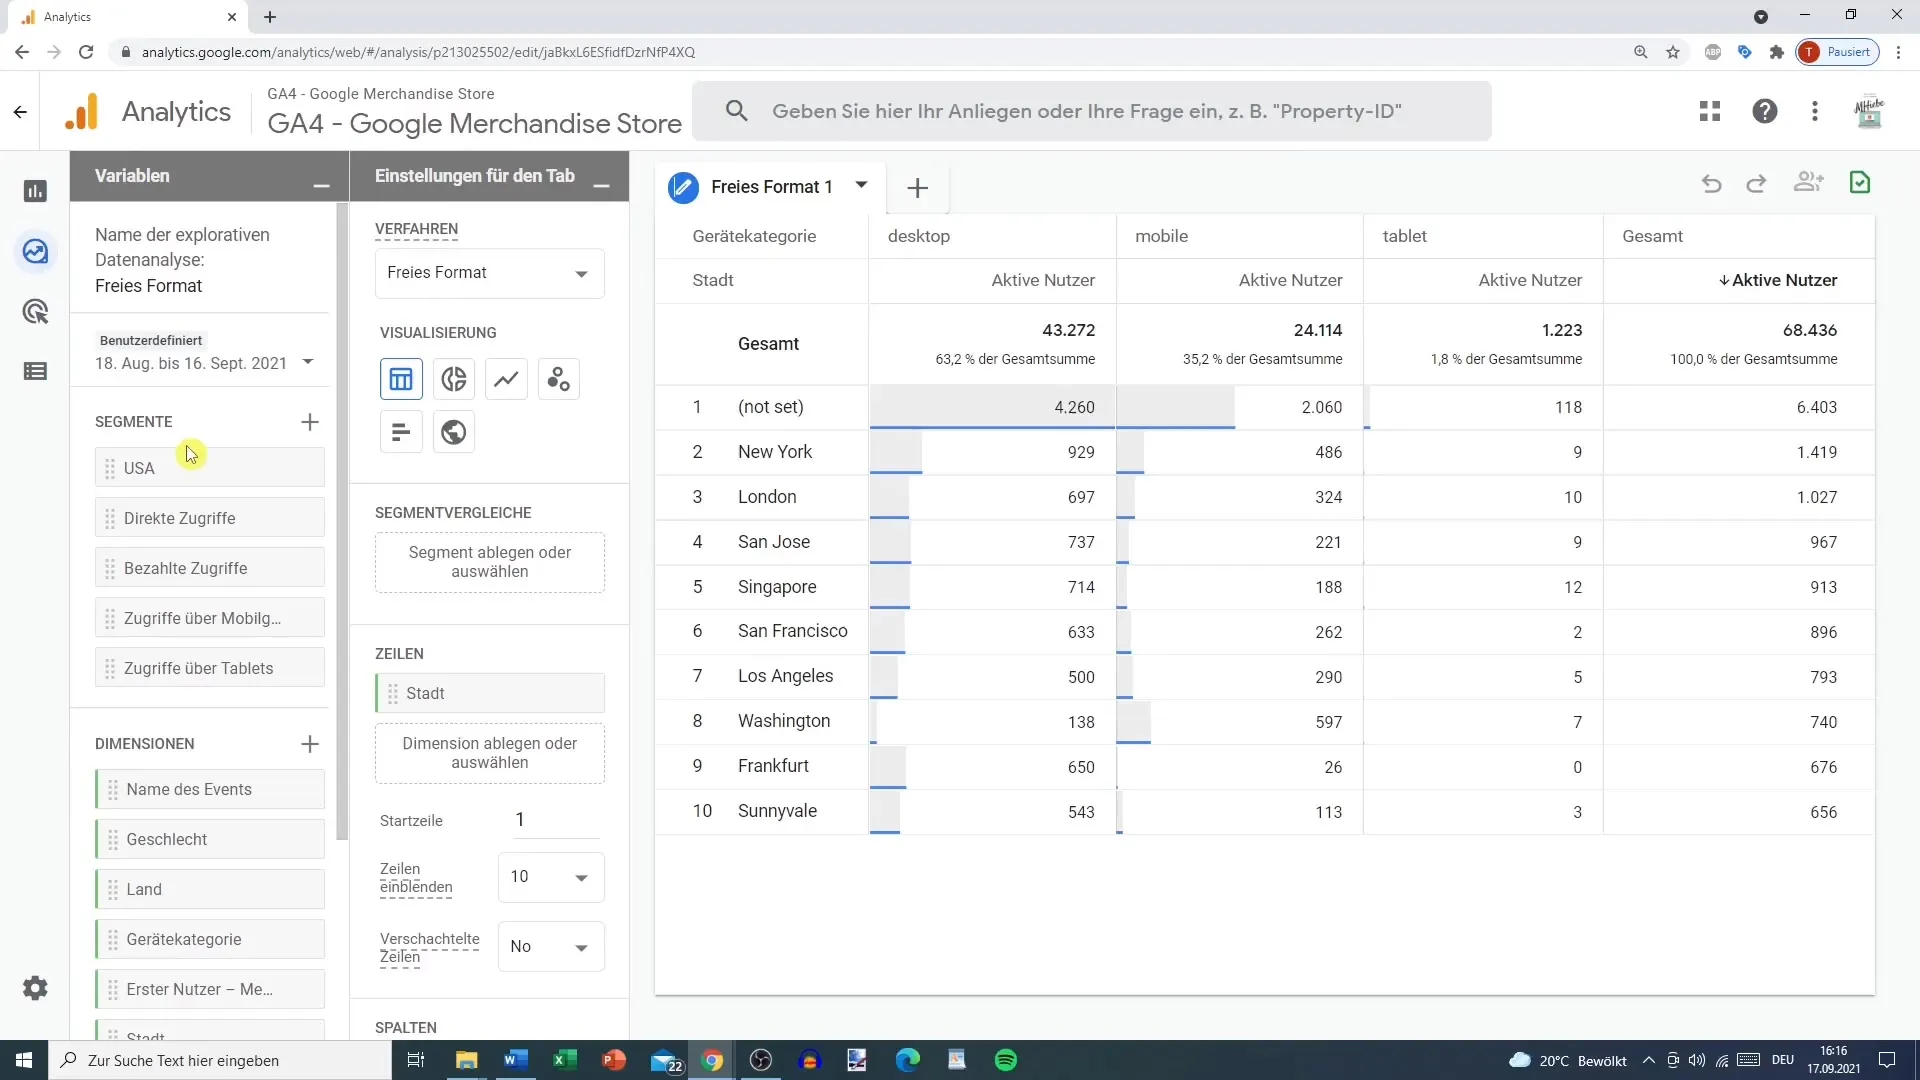
Now you see two different tabs. On the left side, you will find a selection of variables—these are your segments, dimensions, and metrics.
Data Visualization
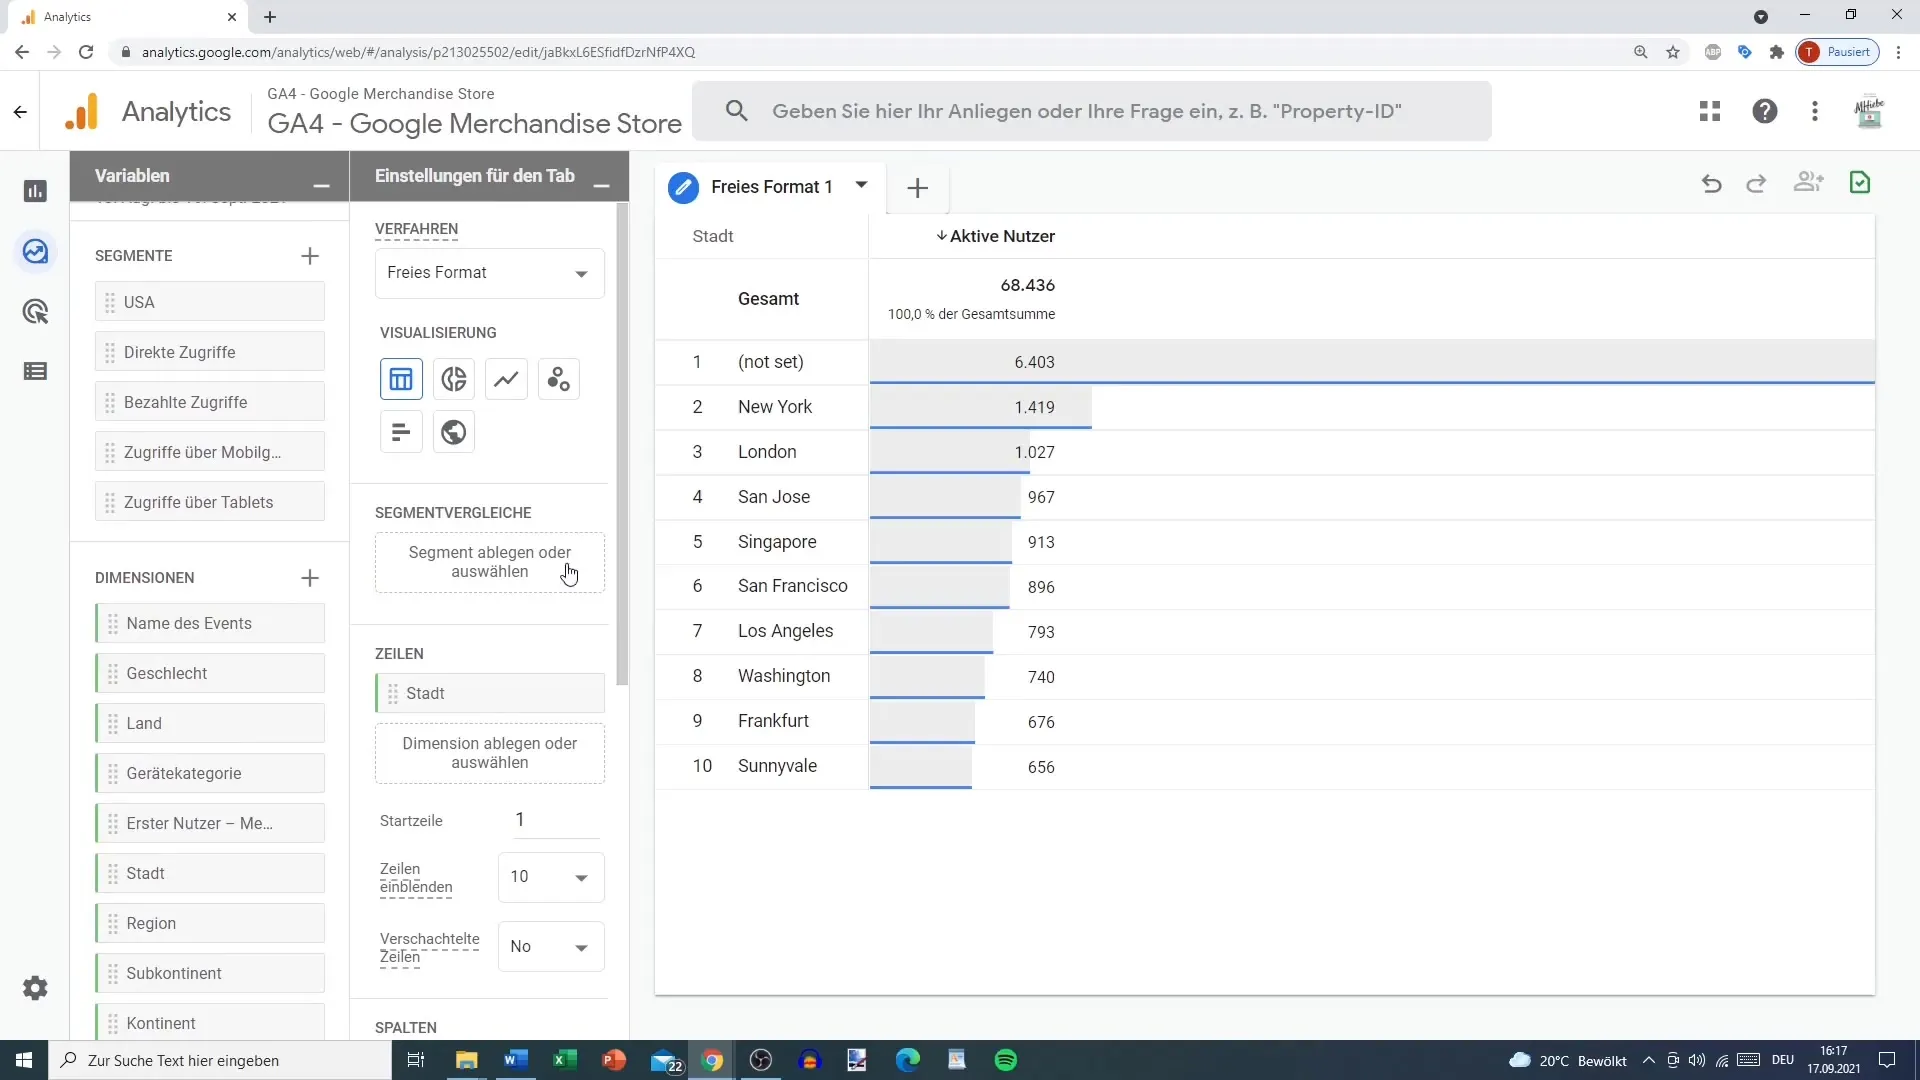
If you stick with the free format, you can customize the view. By default, the data is displayed in a simple box format. However, you can also utilize other visualization options such as:
- Pie charts
- Line charts
- Scatter plots
- Bar graphs
- Maps
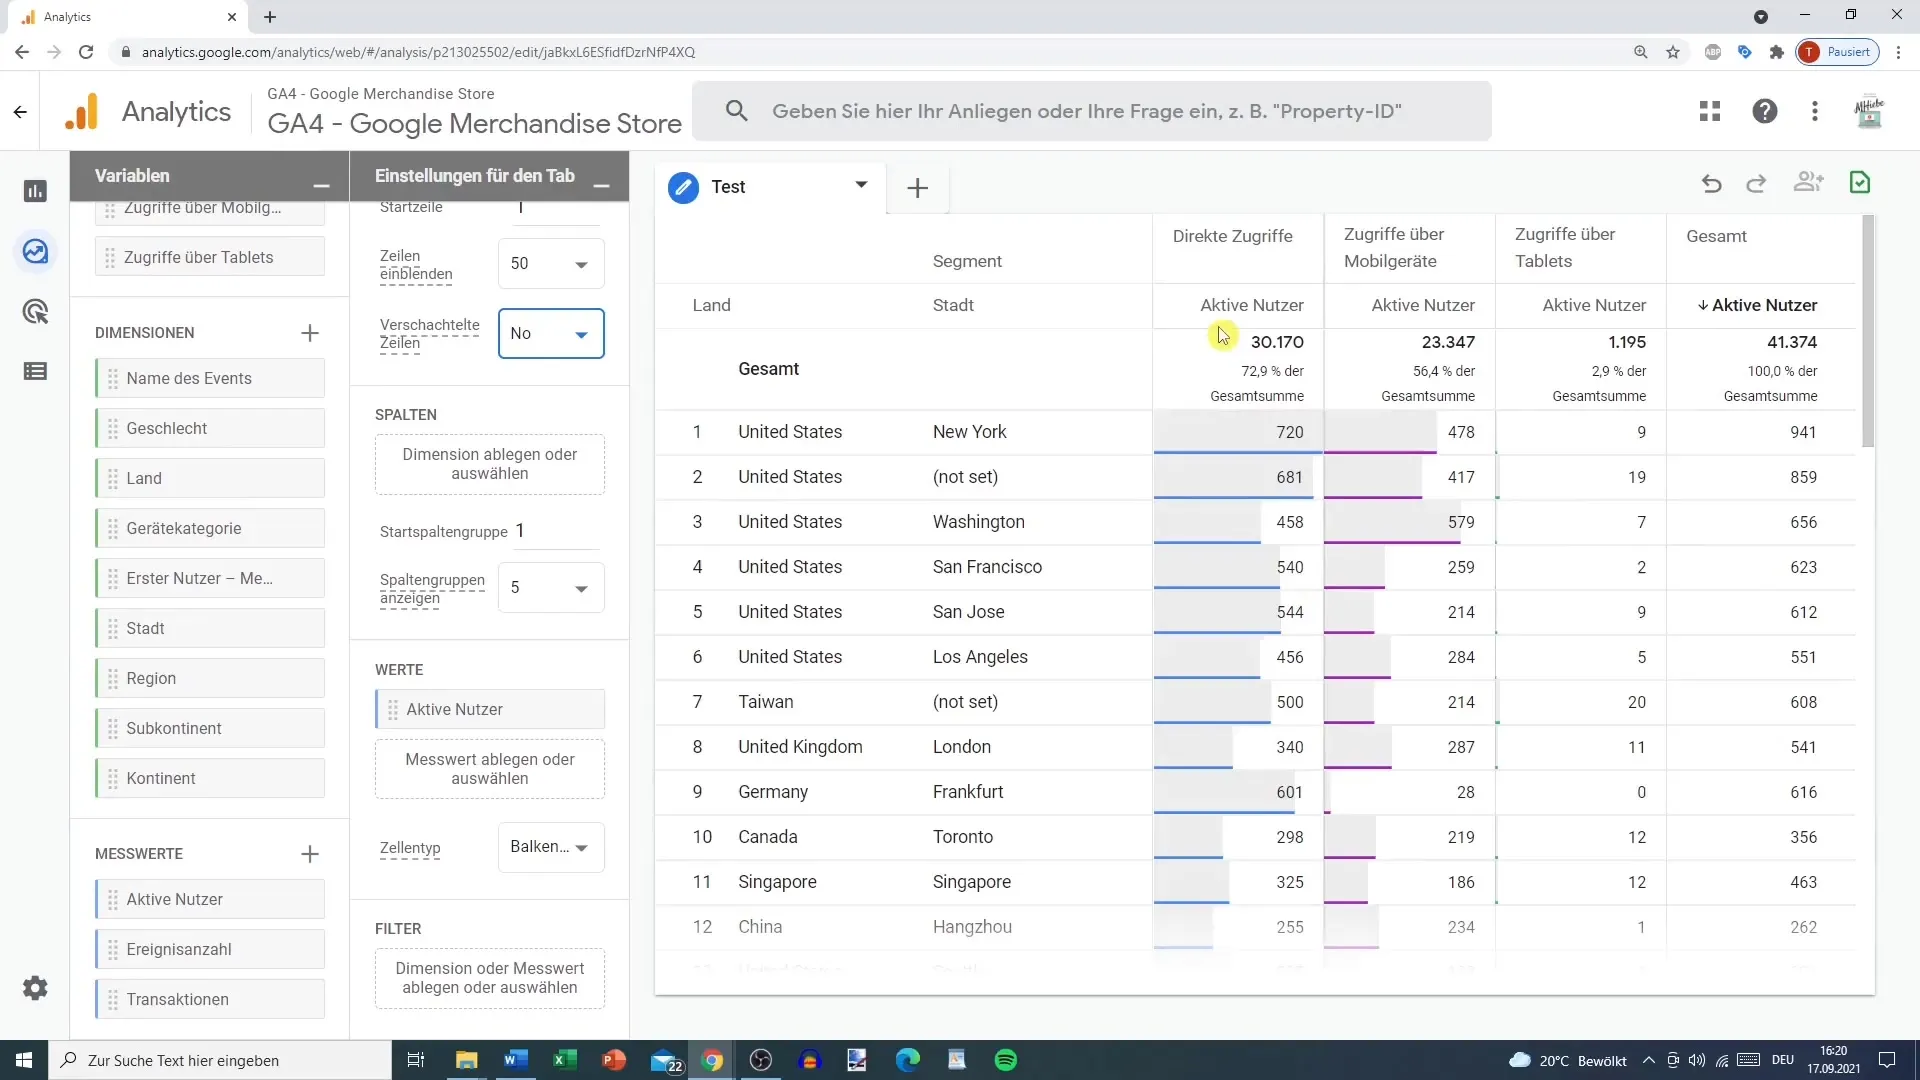
For example, if you want to visualize the segment of direct traffic, simply drag it from the left column into the data view.
Adding Segments
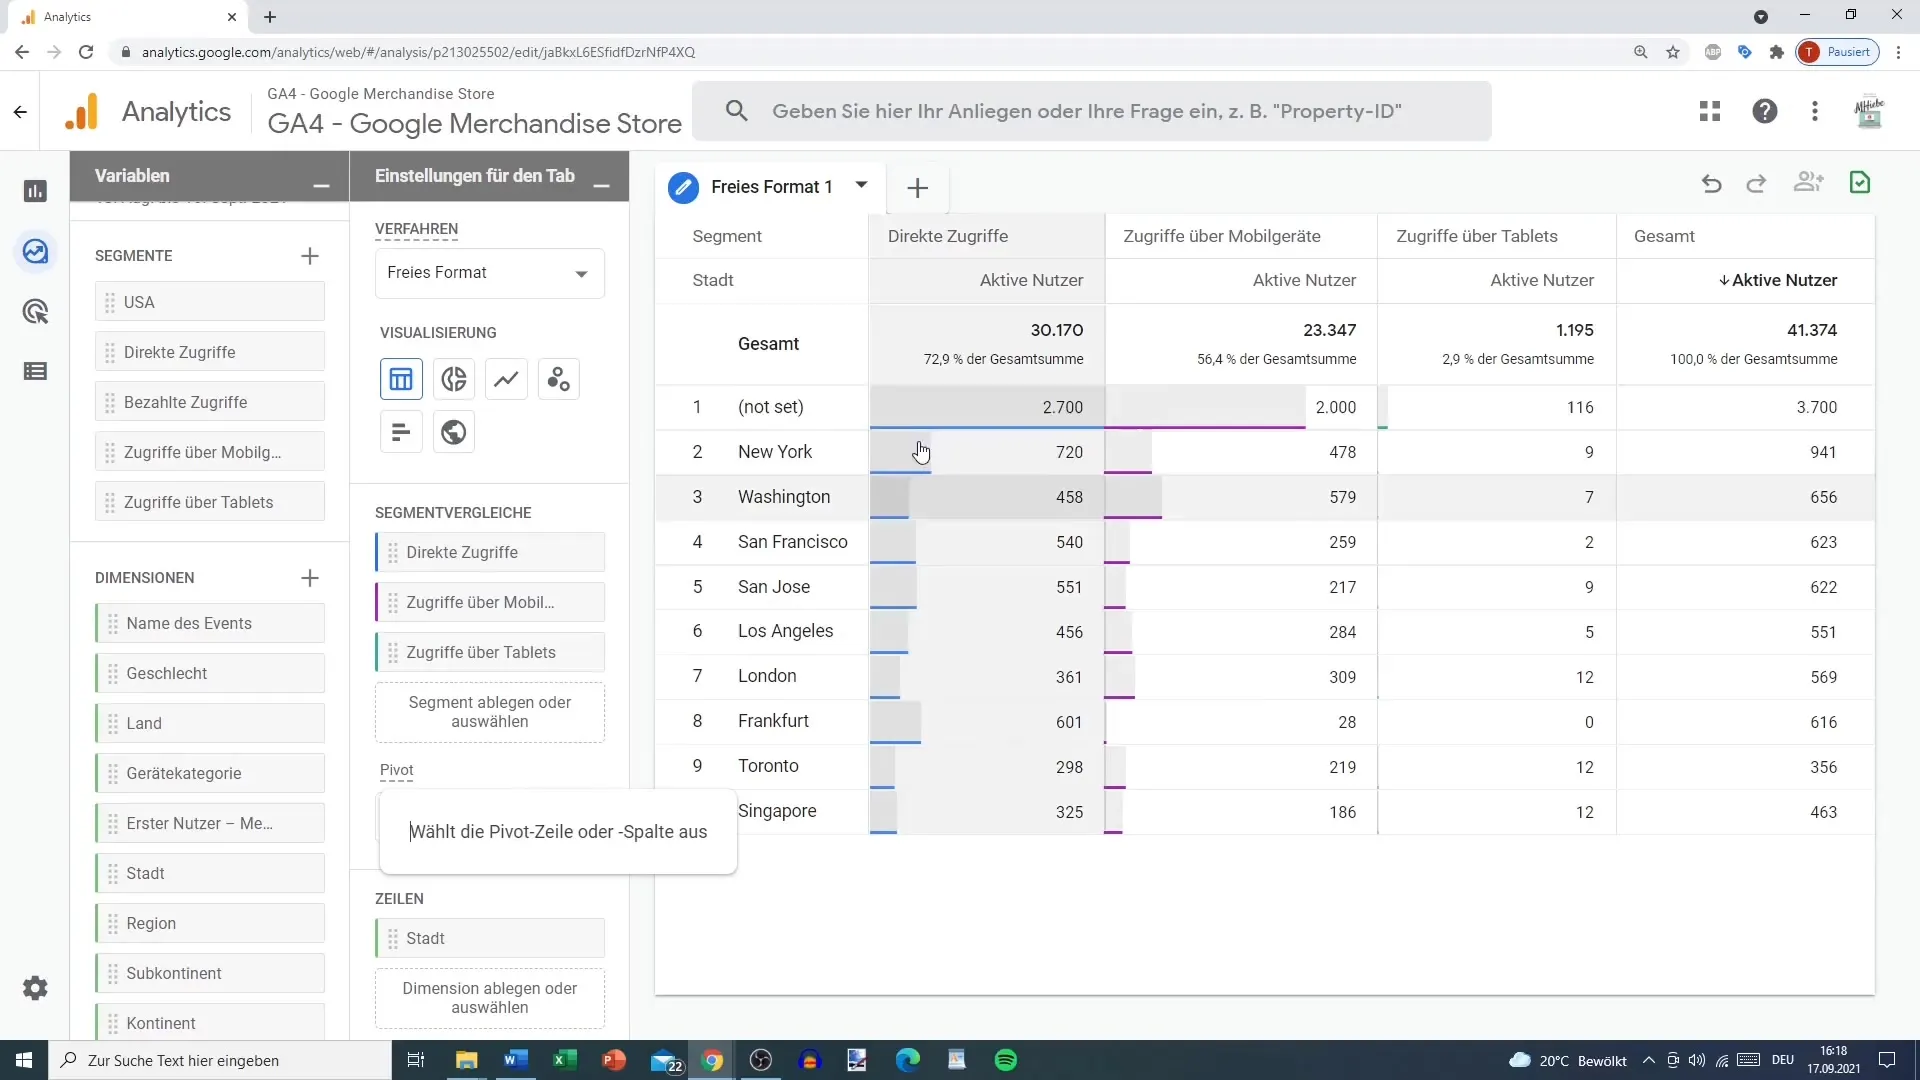
After adding direct traffic, you can also include other segments. For example, traffic from mobile devices and tablets. Drag these into the visualization view to display them simultaneously.
Adjusting Dimensions
Now it's time to adjust the dimensions. You may have currently selected the city as a dimension. However, you can also add the country or a combination of both. You can change the number of rows displayed, for example to 50, and decide whether you want to display nested rows or not.
Adding Metrics
Now look at the metrics. By default, only the number of active users is displayed. However, you have the option to add other metrics such as event numbers or transactions. Consider which metrics are crucial for your analysis and drag them into the view.
Creating Custom Segments
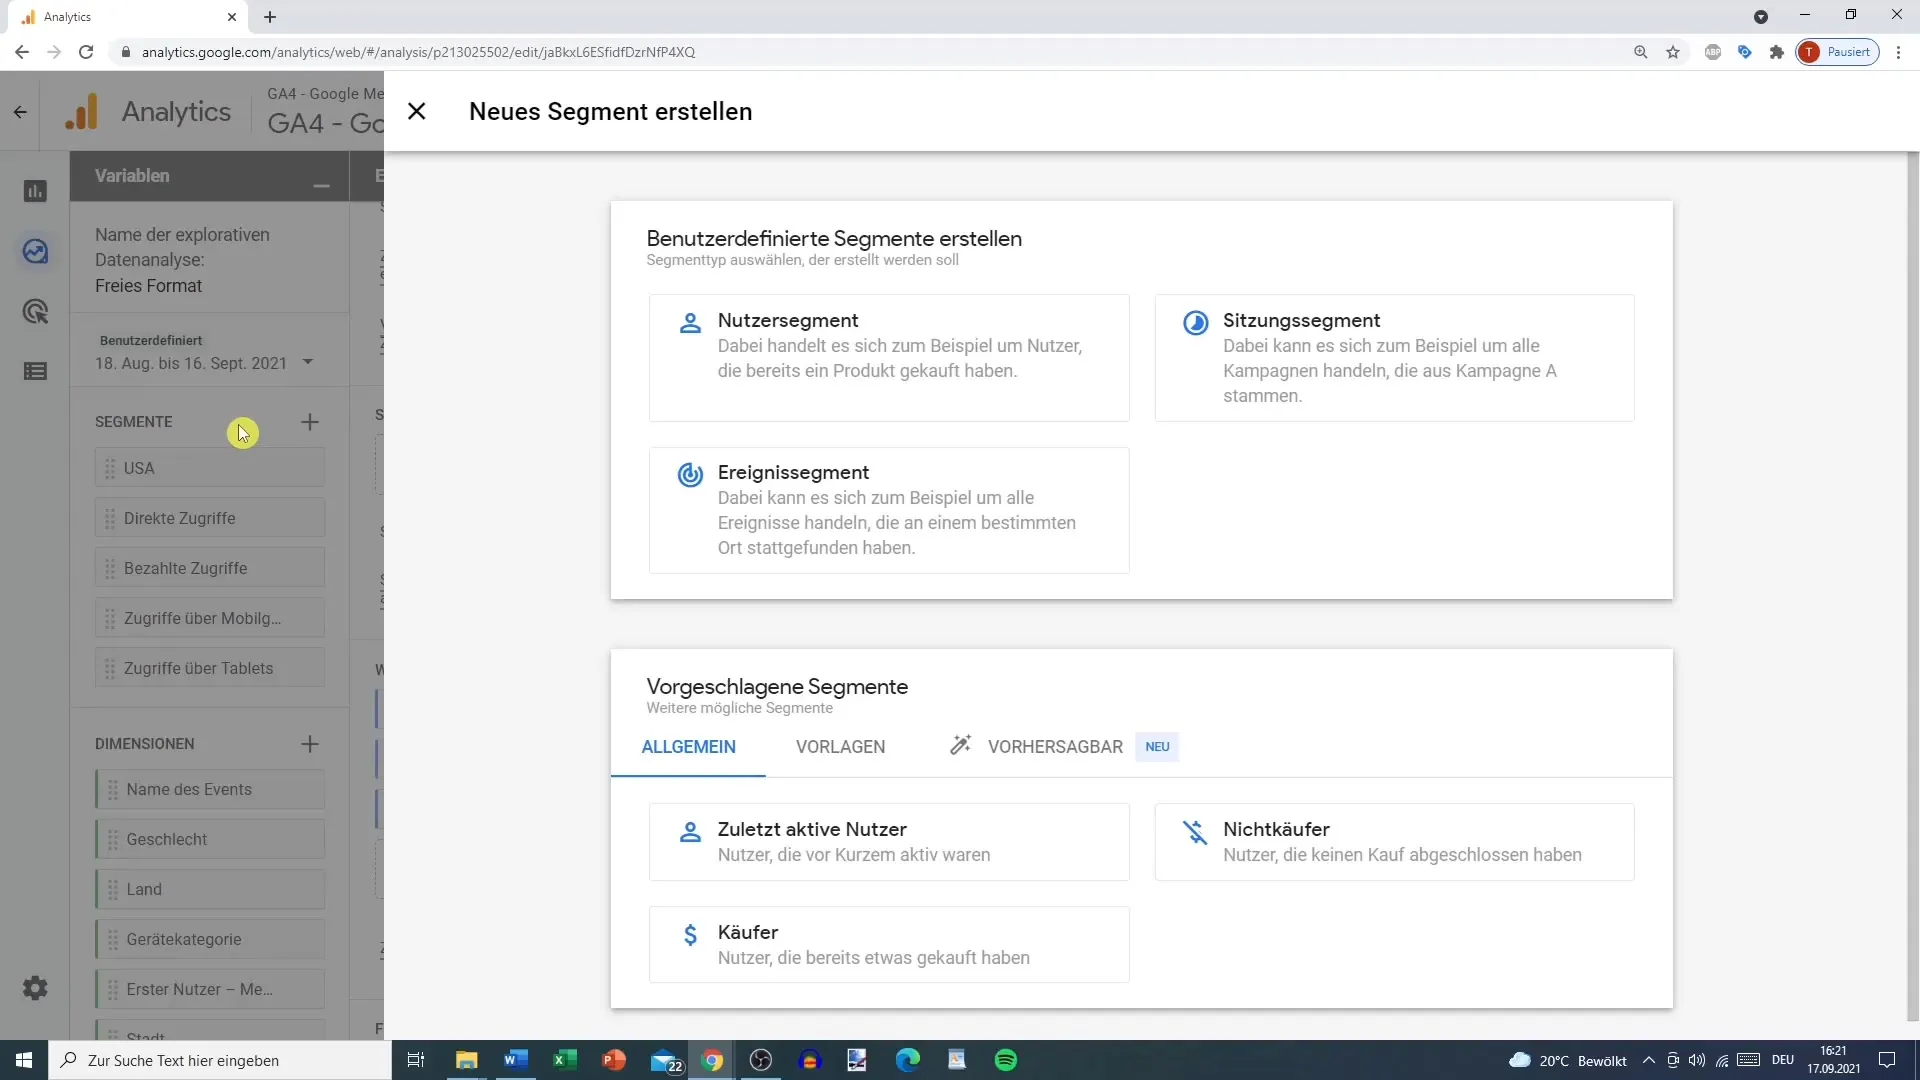
One outstanding feature of Google Analytics is the custom segments. Here, you can consider your specific requirements. Click on the plus sign and select "custom segment". Here, you can set conditions to analyze user patterns.
Editing Segments
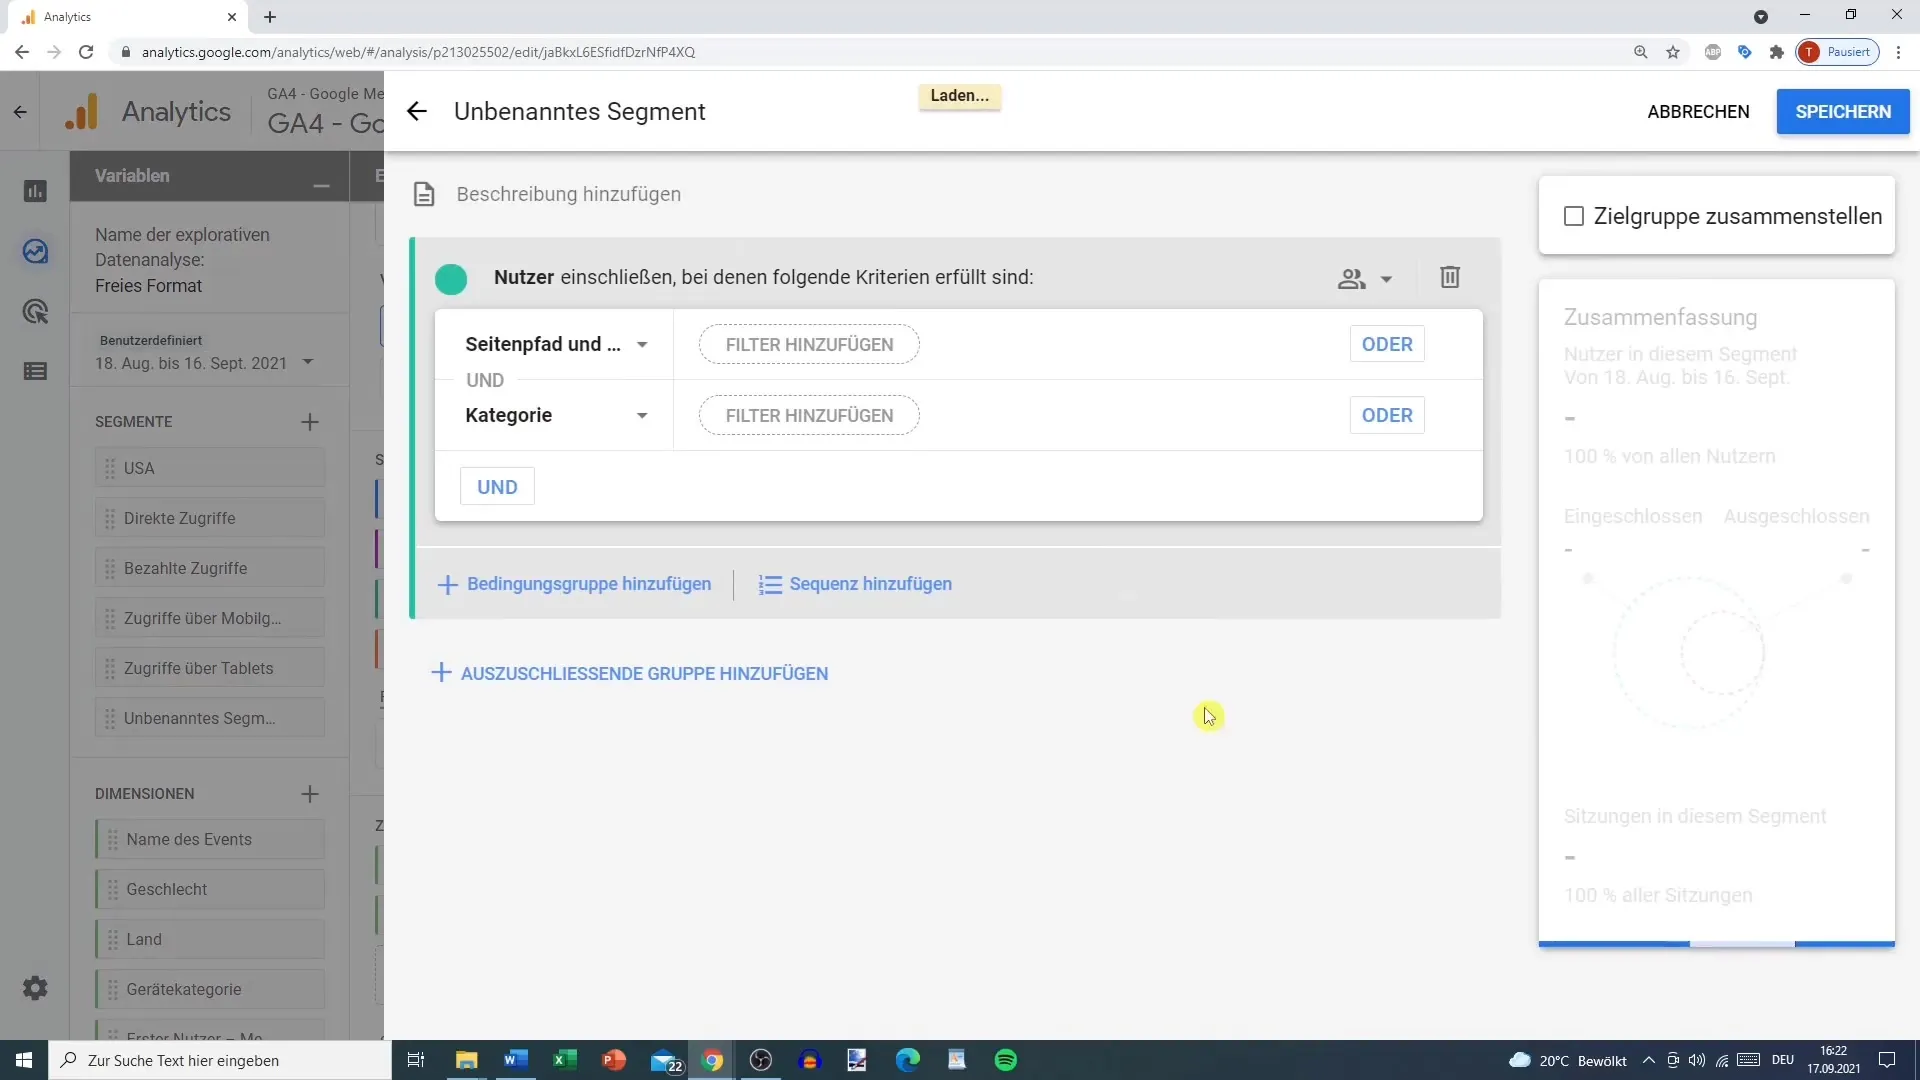
Once you have created a segment, you can make adjustments at any time. Go to "Edit Segment". This way, you can integrate the page path segment or alternative measures to refine your analysis.
Conclusion on Exploratory Data Analysis
It is important to familiarize yourself with the available reporting functions in Google Analytics. It is recommended to thoroughly try out the different options to meet your individual needs. Exploratory analysis can be complex, but you will find that the flexibility of Google Analytics is very helpful. Make sure to keep track and regularly check the reports to make constant improvements.
Summary
In this guide, you have learned how to conduct exploratory data analysis in Google Analytics. From selecting templates to creating custom segments, you have all the necessary information to effectively visualize and interpret your data. Use these steps to gain valuable insights from your user data.
Frequently Asked Questions
How do I add new segments in Google Analytics?You can add new segments by dragging them from the left side to the visualization view.
What visualization options are available in Google Analytics?You can use pie charts, line charts, bar charts, scatter plots, and maps.
How can I create custom segments?Click on the plus sign in the segment view and select "custom segment."
Can I change the dimensions of my analysis?Yes, you can adjust the dimensions at any time to display different data.
Is there a limit to the number of rows in the view?Yes, you can set the number of displayed rows to a maximum of 50.
