If you want to optimize your TikTok marketing, understanding your target audience is essential. In this tutorial, we will look at TikTok analytics, especially the insights about your followers. You will learn how to analyze the data to create targeted content and maximize your reach.
Key Insights
- Gender distribution and its relevance for your marketing
- Geographic locations of your followers
- Analysis of follower activity for optimal posting times
Step-by-Step Guide
Analyze gender distribution
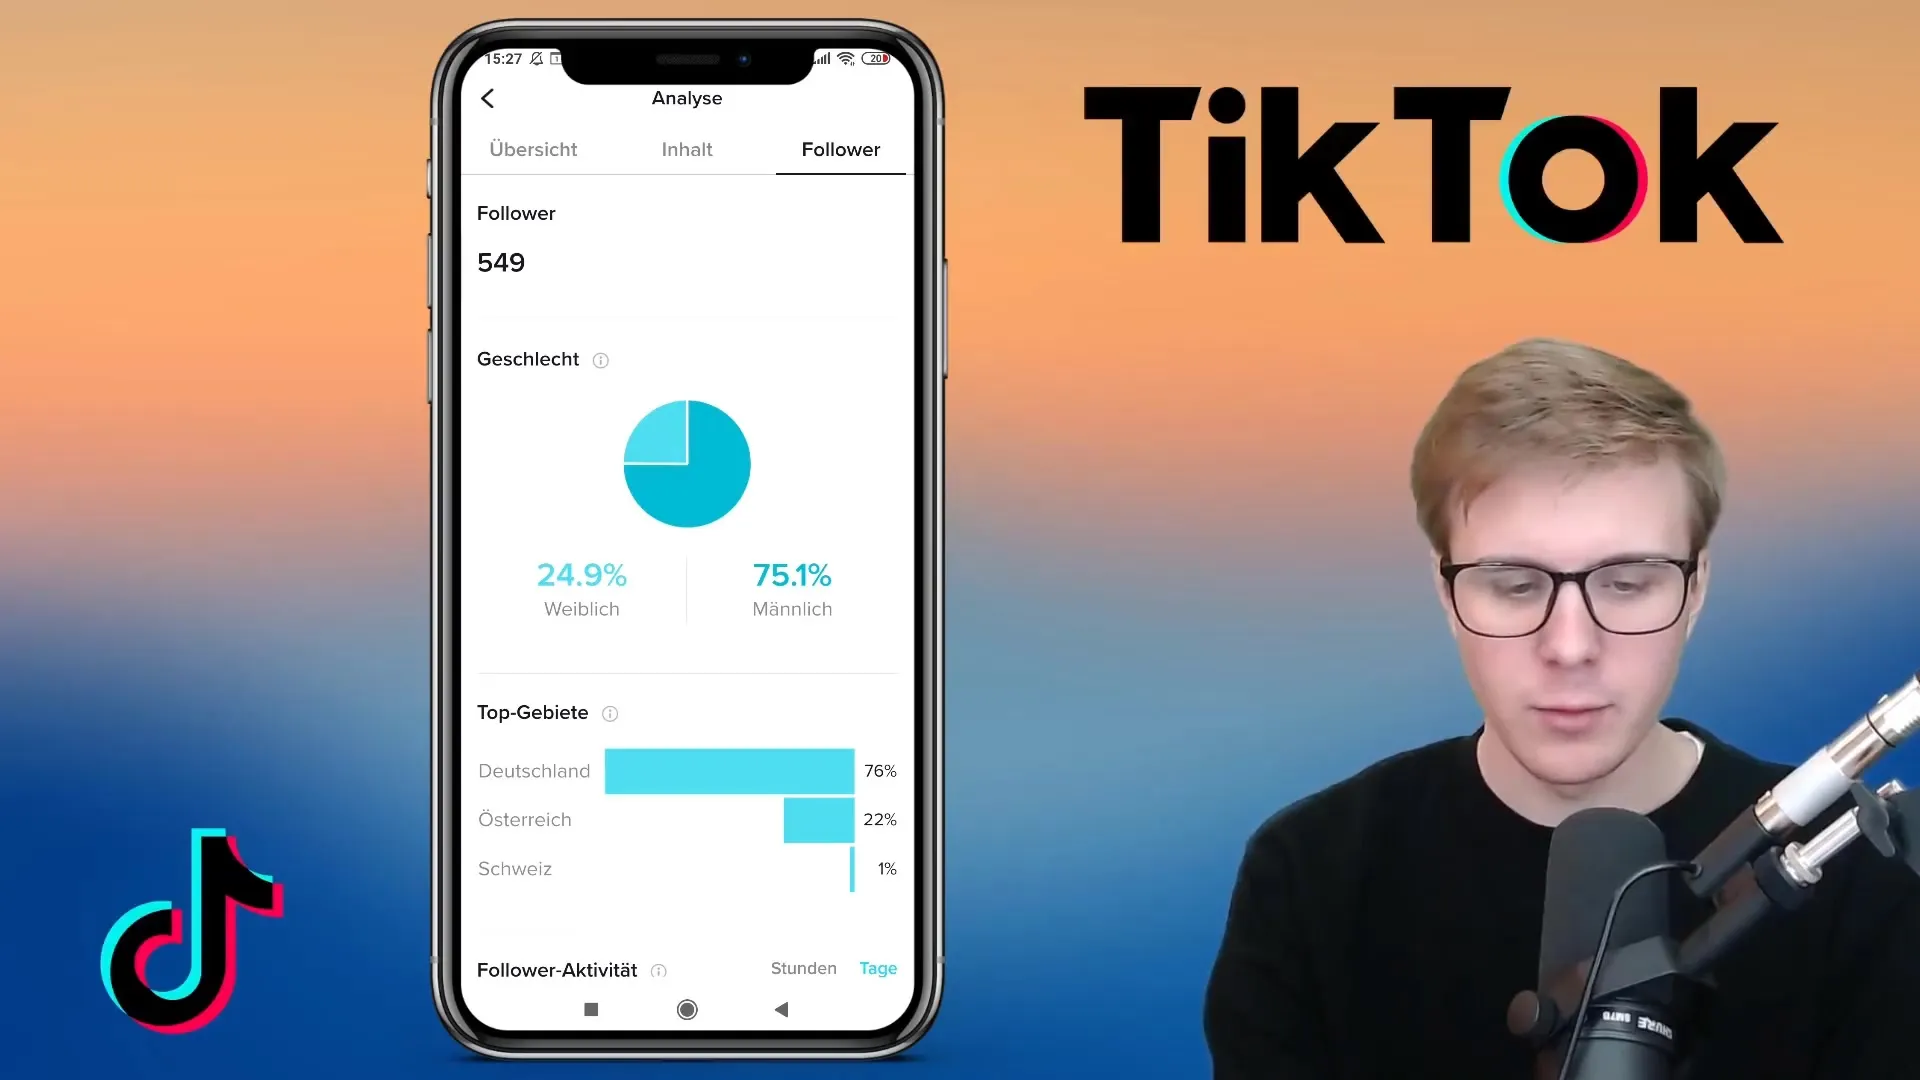
Start by checking the gender distribution of your followers. This will help you identify which gender group predominates. In our example, we see that about 25% of viewers are female, while the majority are male. This information can be crucial when it comes to targeting future content or advertising specifically towards a certain group. For instance, if you want to appeal to more women, you can adjust your advertising accordingly to better reach the female target audience.

Understand the geographic distribution of followers
Another important point is the geographic distribution of your followers. These insights reveal which countries your viewers come from. In this case, a significant portion comes from Germany, Austria, and Switzerland. It's noteworthy how many followers come from Austria, especially if your content is specifically tailored to that audience. These insights not only assist in content planning but also in advertising strategy.

Analyze follower activity
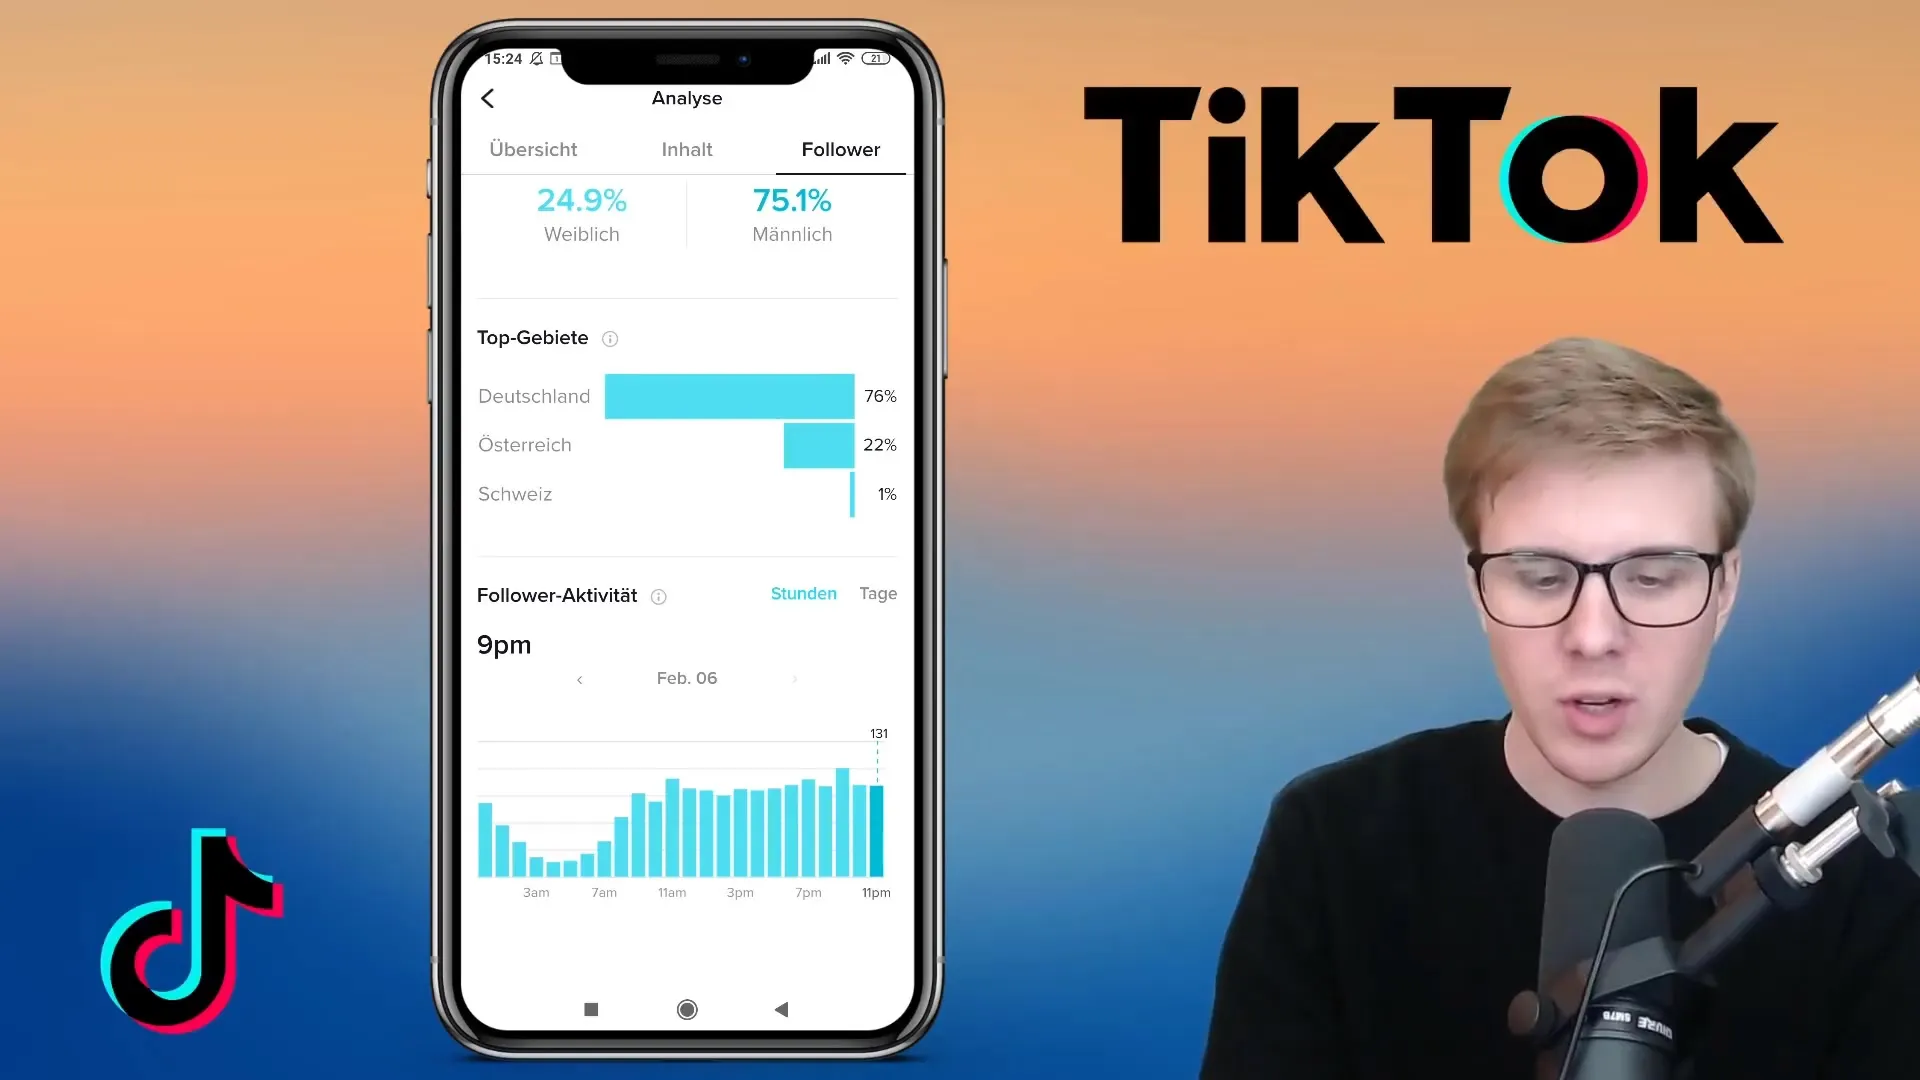
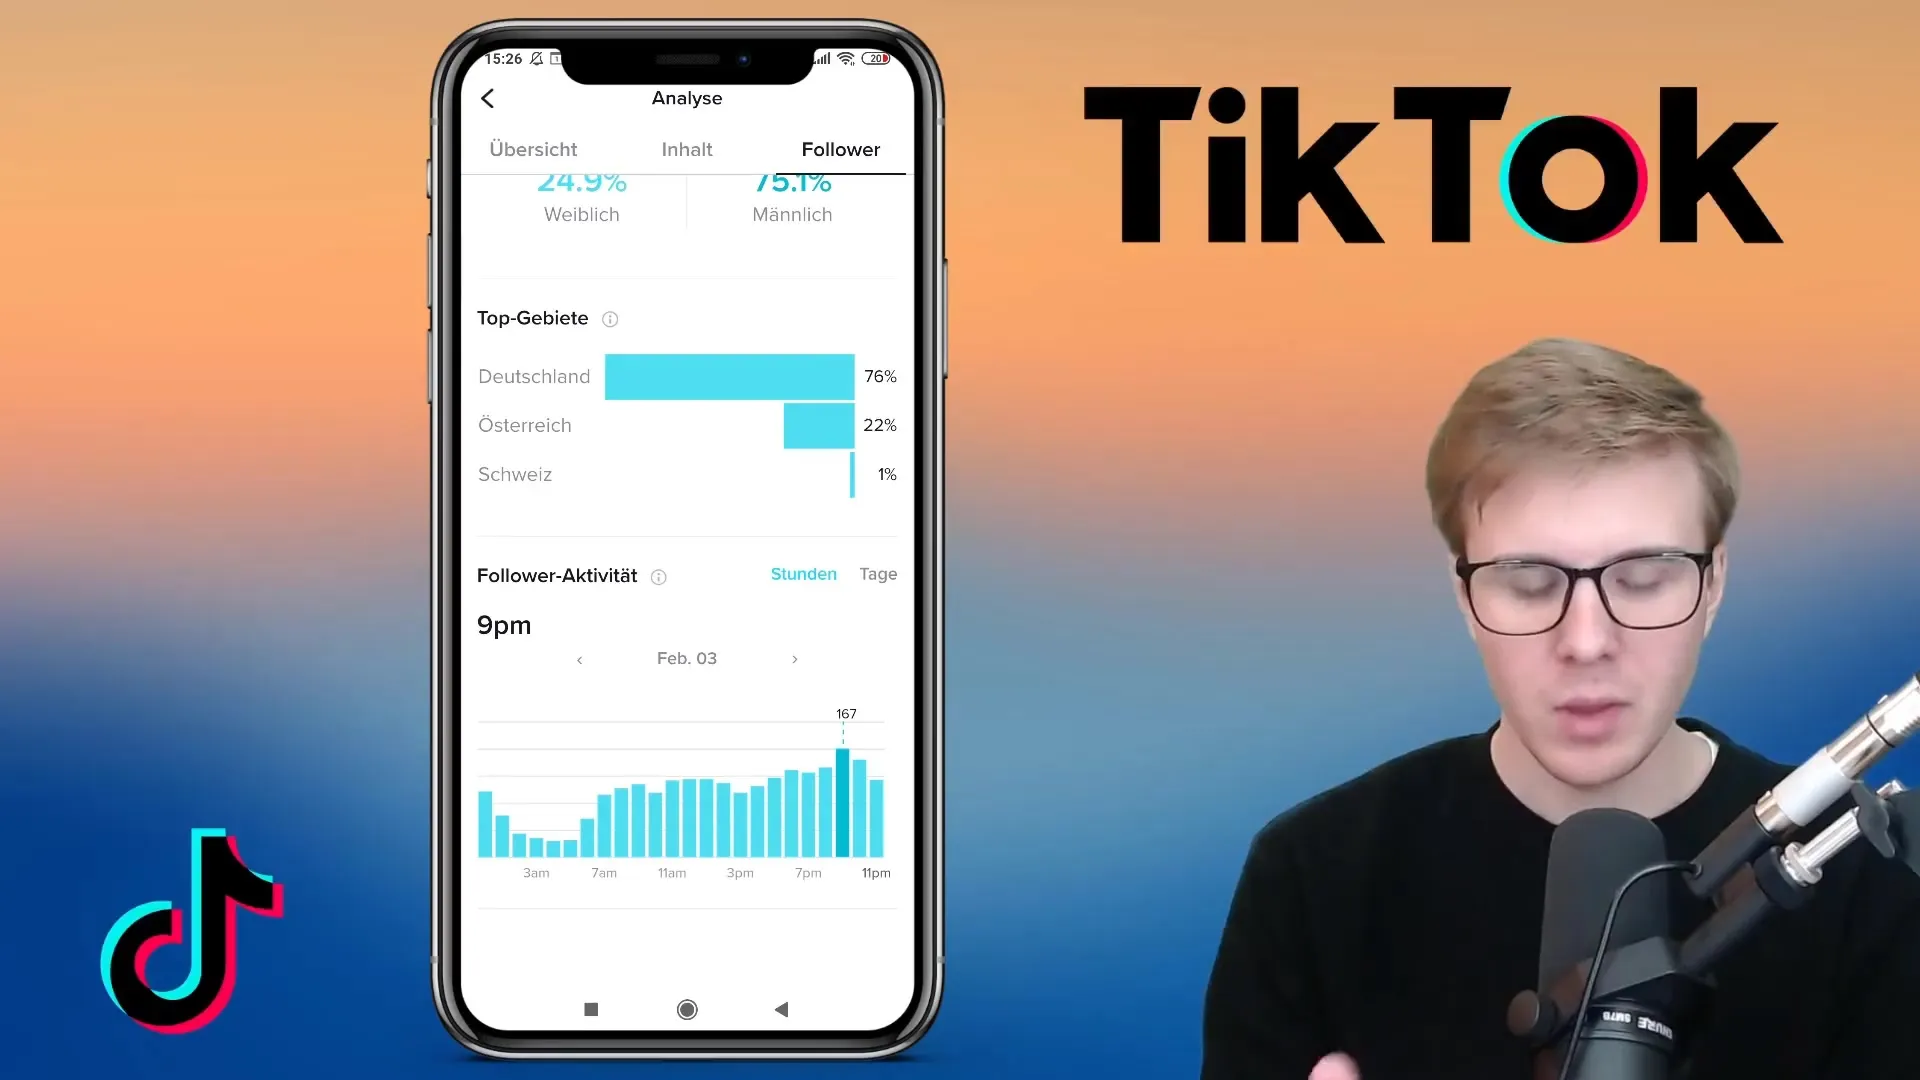
To determine the best times for your posts, analyzing follower activity is crucial. You should take a look at the days and times when your followers are most active. For example, many users are online in the evening, particularly between 6 pm and 9 pm. Therefore, if you publish your posts during these times, you increase the likelihood of engagement. This means your followers will see your content faster and are more likely to interact.
Utilize optimal posting times
Use the insights from the follower activity analysis to create a posting schedule. If you notice that most of your followers are active on Saturdays at 8 pm, plan your content to be published exactly at that time. It can also be helpful to test different days to find out if the day of the week impacts the interaction rate.

Continuously adapt the strategy
Regularly monitor your analytics as the data can change. It's important to remain flexible and continuously adjust your strategy to achieve the best results. For example, if you notice a decrease in follower activity on a Friday, you may choose to avoid that day or schedule specific content for times when less active users are expected.

Summary
By analyzing gender distribution, geographic locations, and activity times, you can make strategic decisions to better reach your target audience and increase your engagement rates. These insights are essential for a successful TikTok marketing strategy.
Frequently Asked Questions
What is the gender distribution of my followers?In our example, about 25% are female and 75% are male.
How can I find out the geographic distribution of my followers?The geographic distribution is visible in TikTok analytics and shows the countries where most followers come from.
When are my followers most active?Followers are most active between 6 and 9 pm, but this varies depending on the day of the week.
How often should I check my analytics?It is advisable to check analytics regularly, at least once a week, and adjust your strategy as needed.
Why is follower activity lower on Fridays?Activity can be influenced by various factors, such as the day of the week and typical user behavior.


