Inserting charts into Google Docs can significantly simplify the process of visualizing your data. Whether for presentations, reports, or personal projects, charts help to present information clearly and concisely. In this guide, you will learn how to effectively insert charts from Google Sheets into your Google Docs documents to present your data in an organized way.
Main Insights
- You can insert various chart types from Google Sheets into Google Docs, including bar, column, line charts, and pie charts.
- An important feature is the ability to link the charts so that updates in Google Sheets are also reflected in Google Docs.
- It is advisable to prepare a Google Sheets document before inserting to optimize the process.
Create and Insert Charts
Prepare Chart in Google Sheets
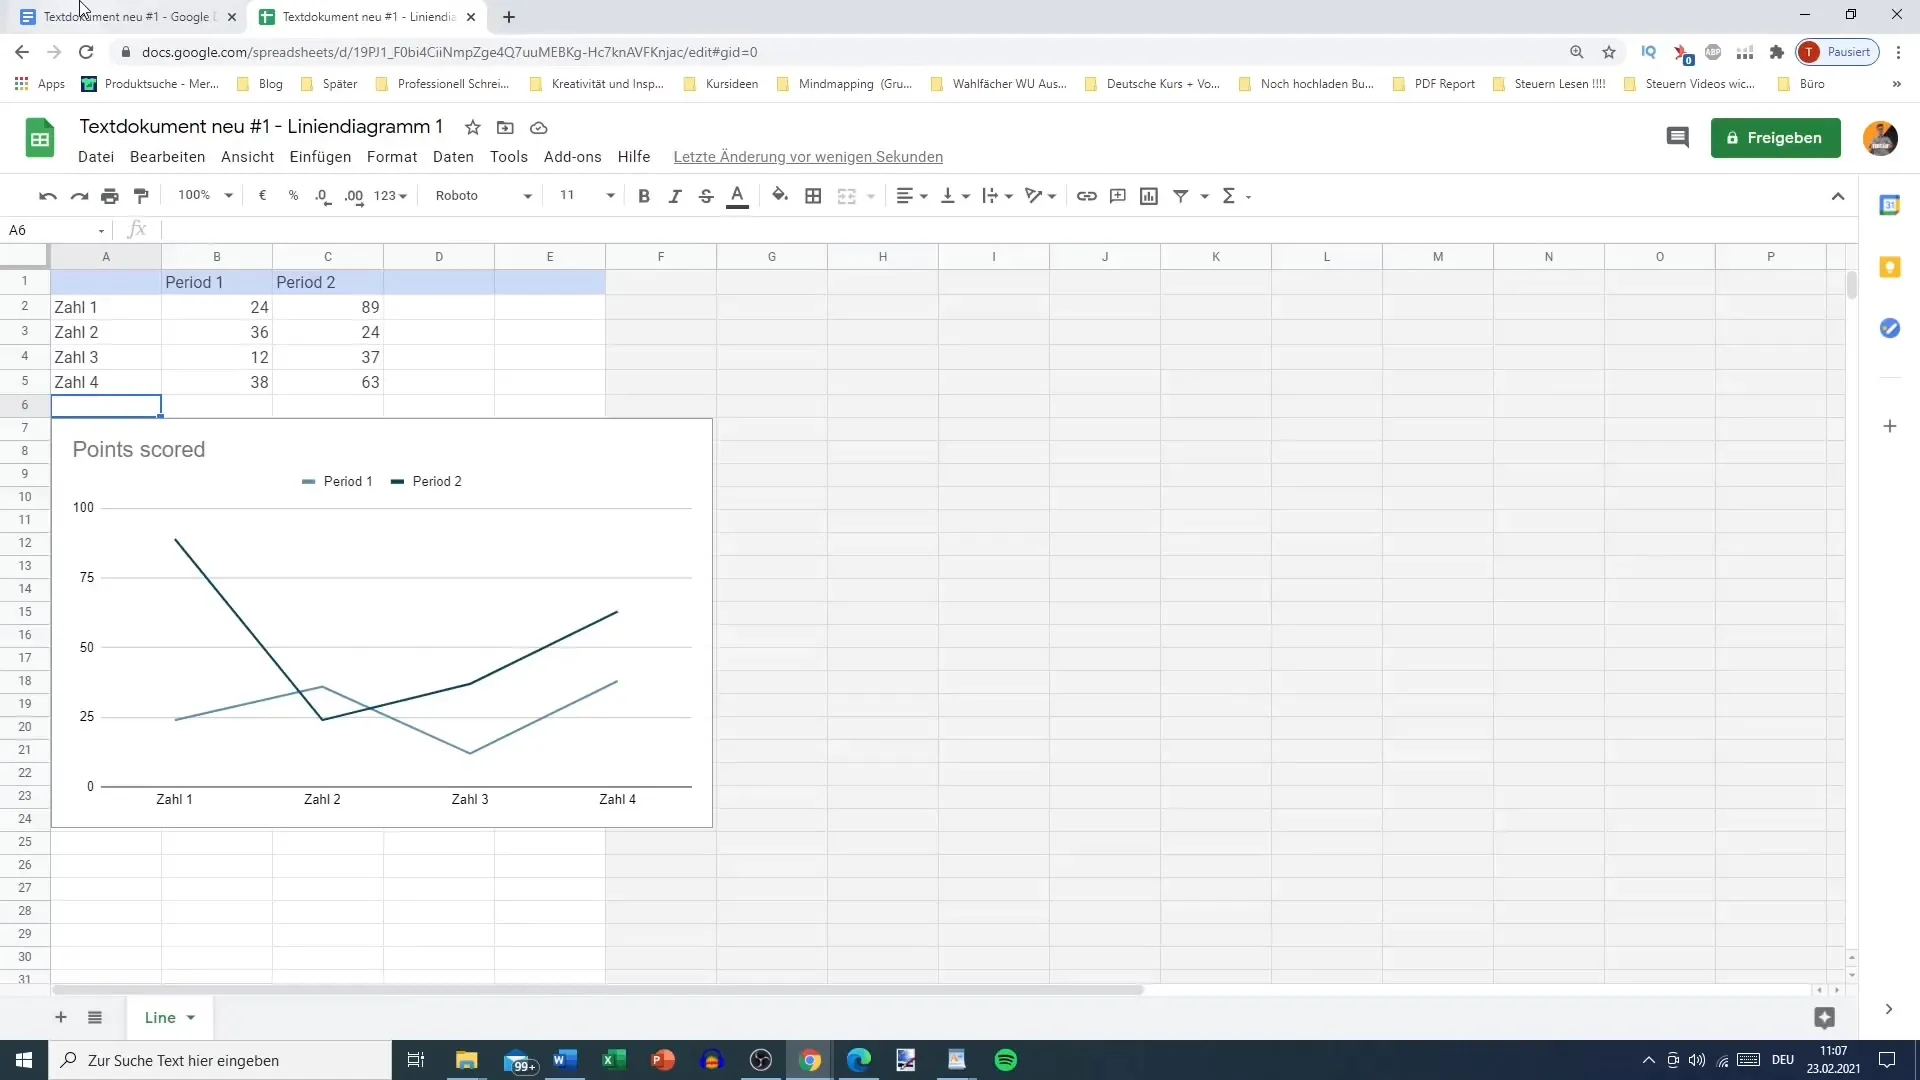
First, you need to create a Google Sheets document with the relevant data. Here you can manually enter the values and categories you want to represent in your chart. For example, if you want to create a line chart, arrange your data as follows: the first column contains the categories (e.g., Team 1 to Team 4), while the second column contains the values (e.g., from 0 to 100).
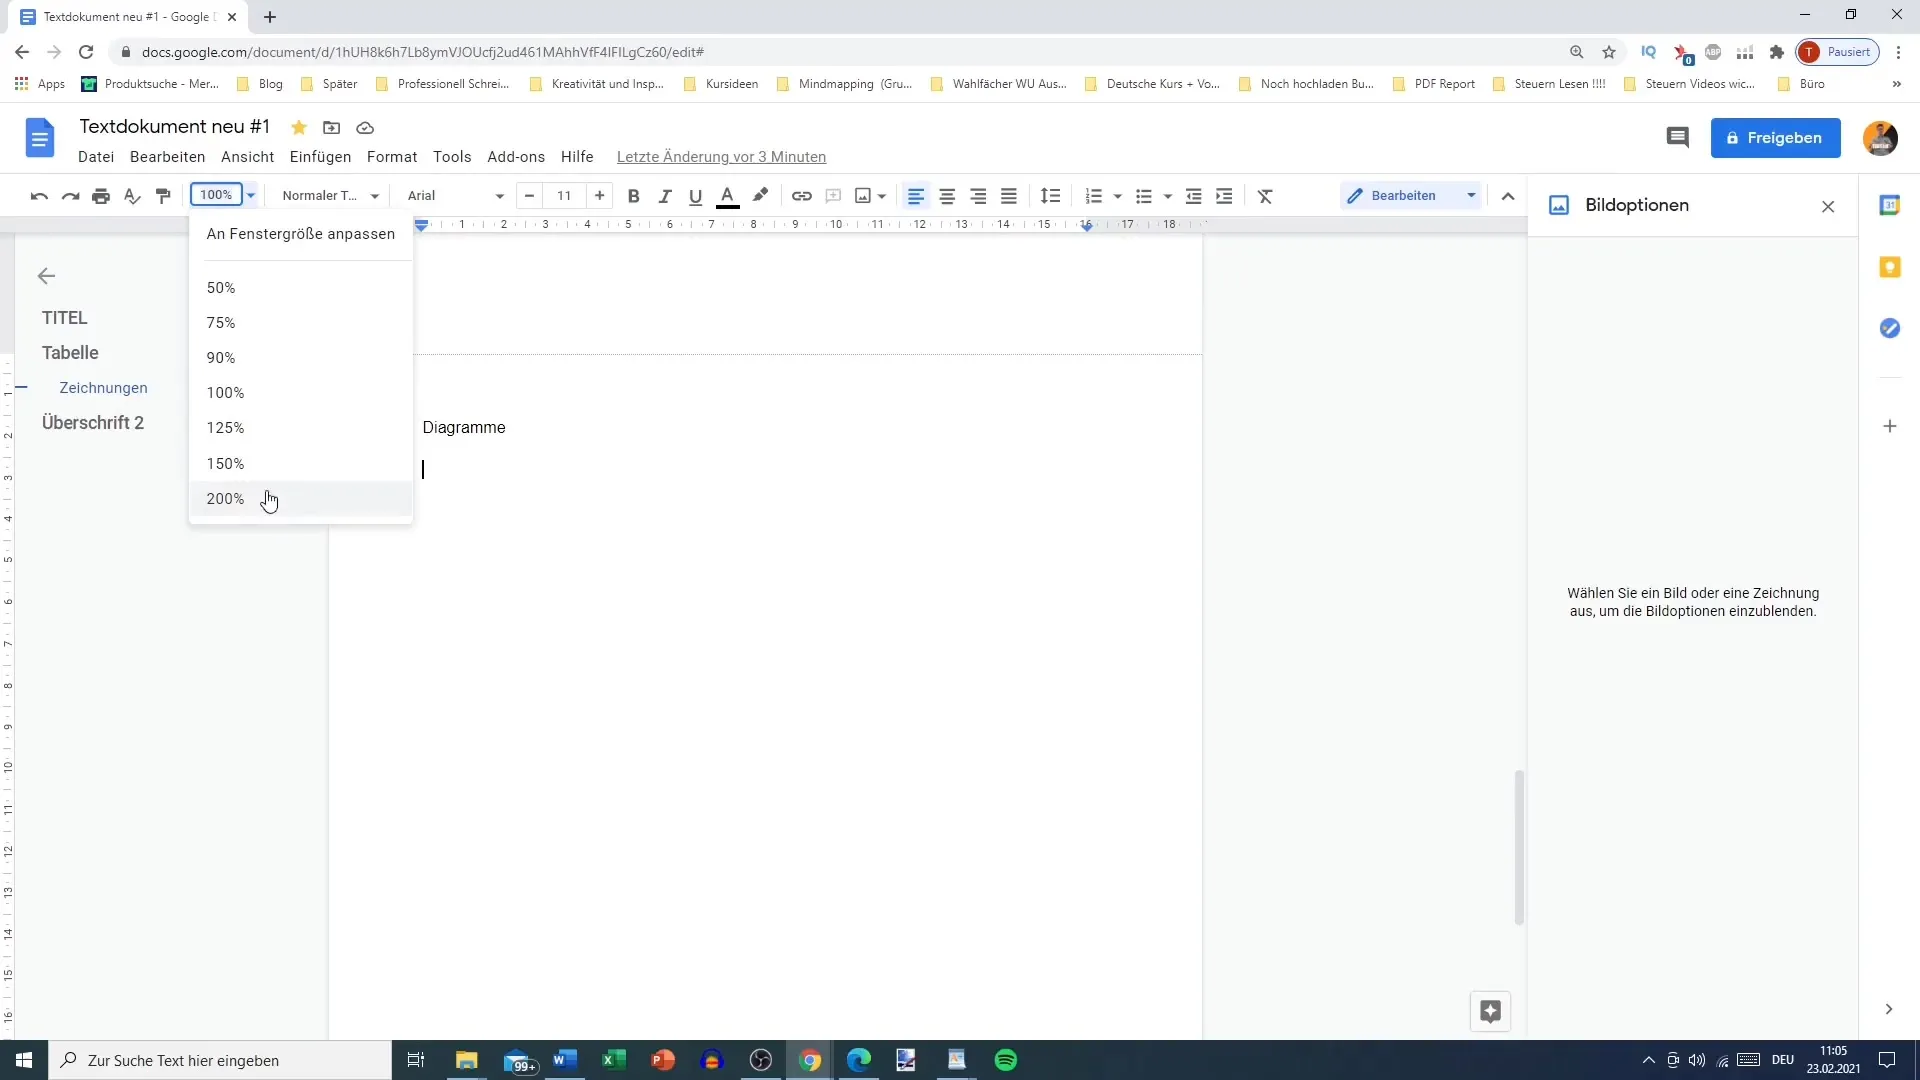
You can adjust the data as needed. Change the names on the X-axis from Team 1 to Number 1, or adjust the values. This can be done easily and quickly. Changes to your chart can be made by simply editing the values in Google Sheets.
Insert Chart from Google Sheets
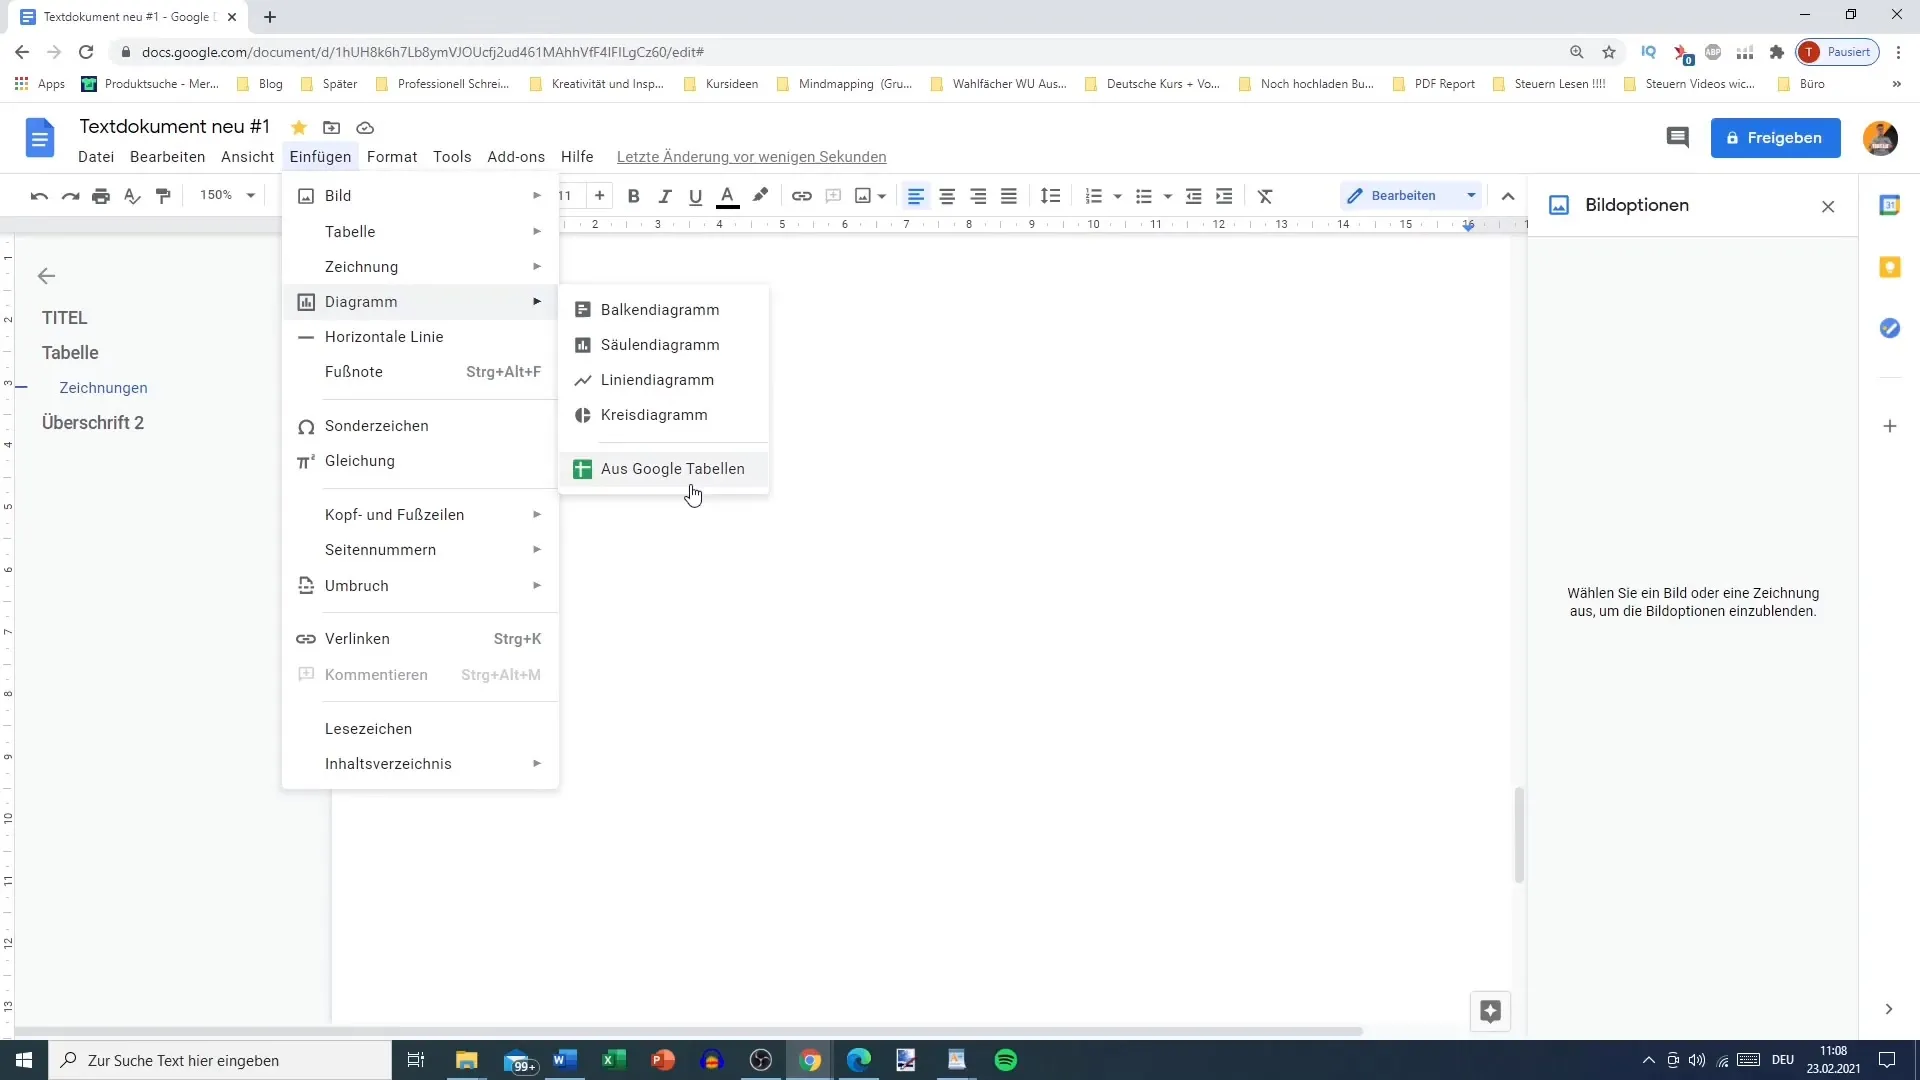
Once you have created your chart, it is time to insert it into your Google Docs document. Switch to Google Docs and click on "Insert." Then choose the "Chart" option and then "From Google Sheets."
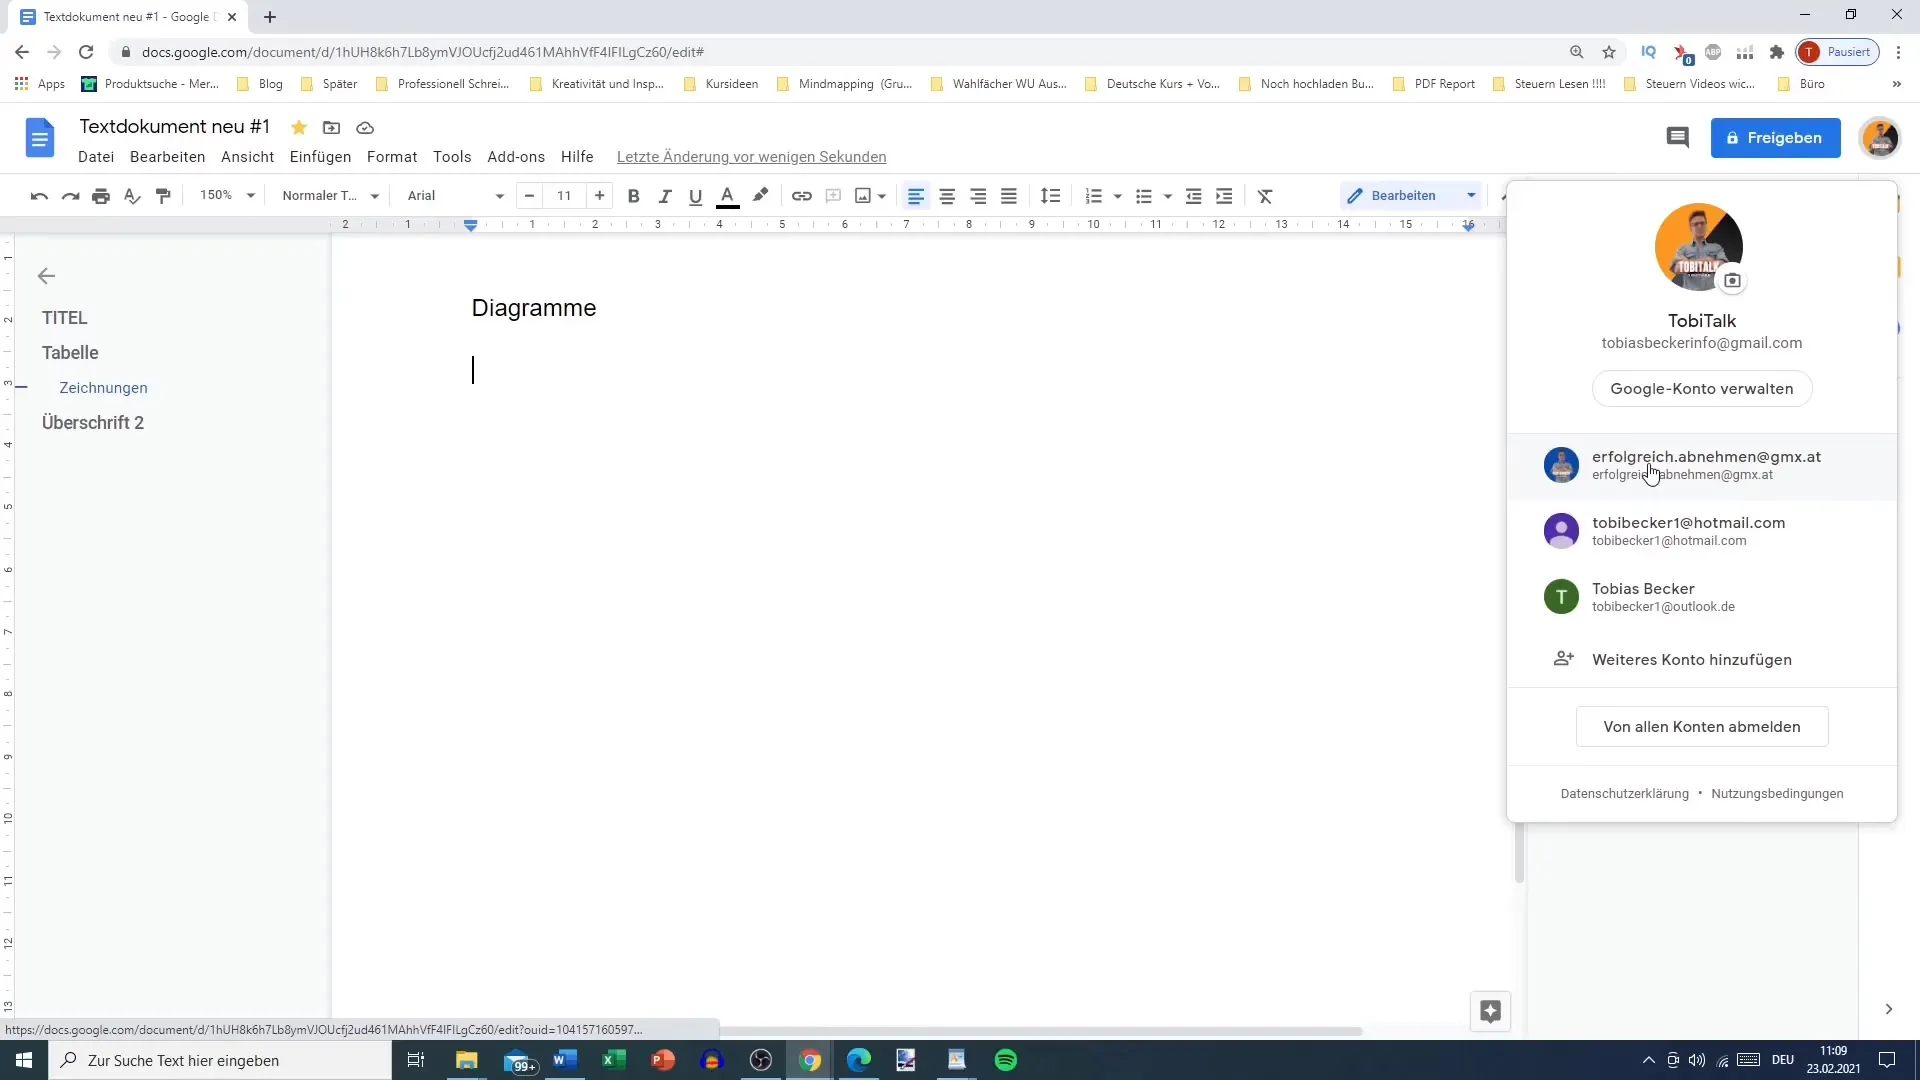
Make sure you select the correct Google Sheets document containing your chart. If you use multiple Google accounts, ensure that the document was created by the account you are using or that you have set the appropriate permissions.
Linking the Charts
Once you have inserted the chart in Google Docs, you have the option to link it to the original Google Sheets document. This option allows you to edit the data in Google Sheets and automatically update the changes in your Google Docs document.
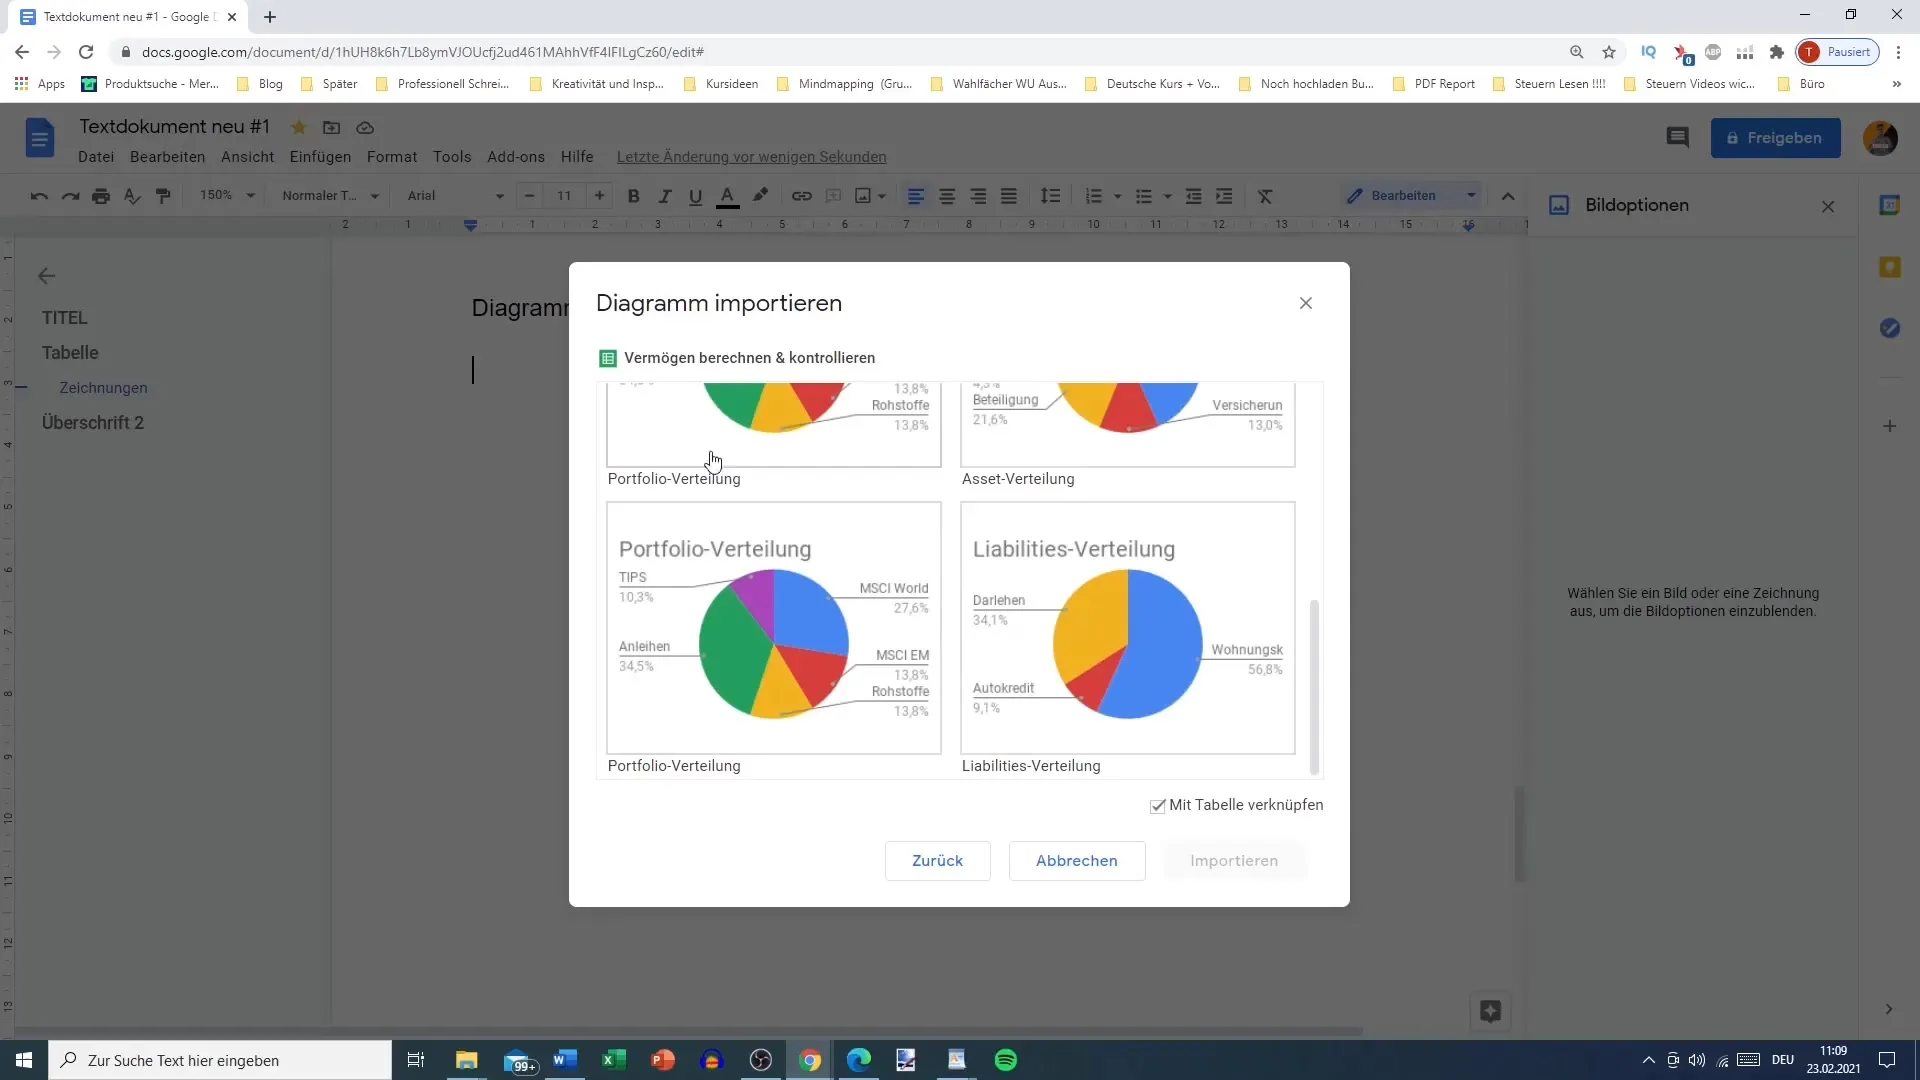
By enabling the "Link" option, you will be able to update your chart. For example, if you change a value in Google Sheets, you will have the option to update your chart in Google Docs.
Decide whether you want to link the chart or insert it independently. If you unlink the chart, it will remain in the state it was inserted, regardless of changes in Google Sheets.
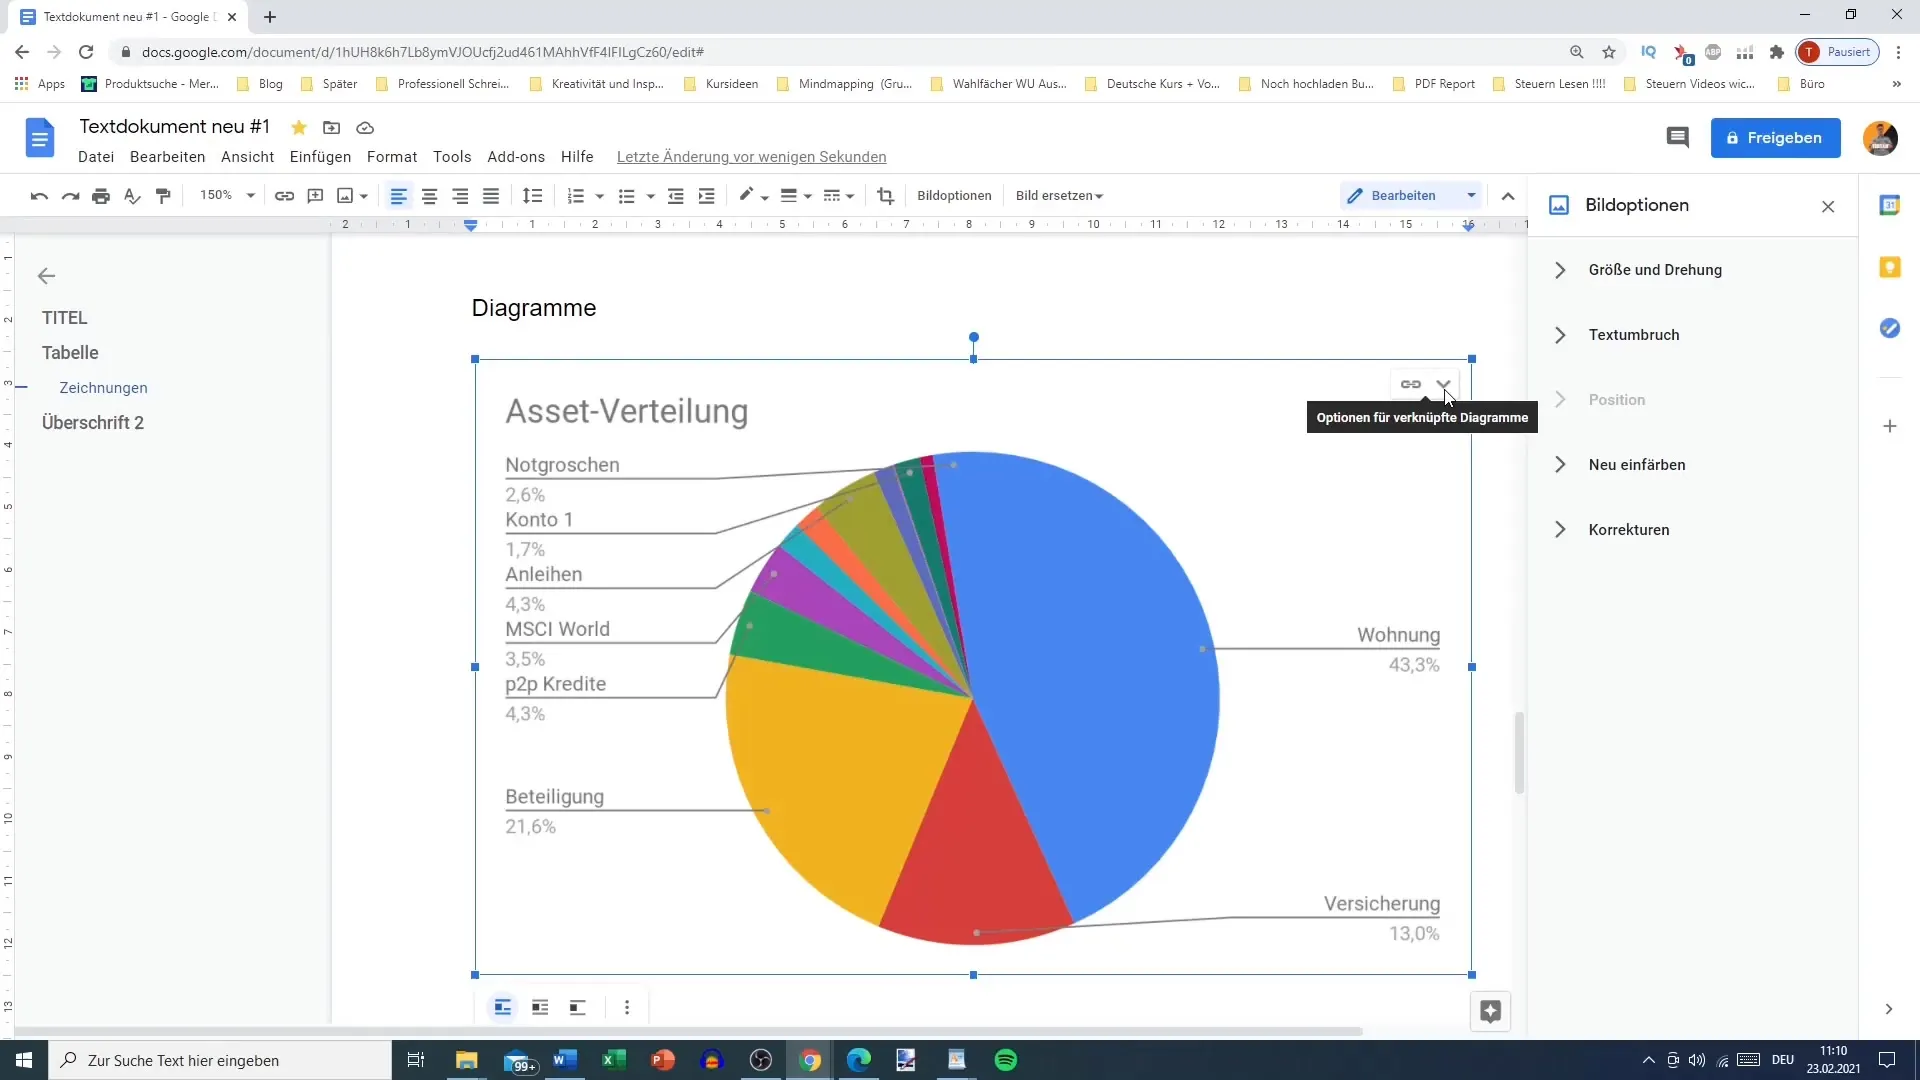
Update Chart
If you have linked the chart with Google Sheets, you can easily reflect the current data in Google Docs. To update the chart, simply go to the chart and click on the "Update" button. This will incorporate changes from Google Sheets, and the chart in Google Docs will be updated accordingly.
If you wish to unlink the chart later, you can do so through the options for linked charts. This allows you to maintain flexibility in how you represent your data.
Conclusion
By using Google Sheets and Google Docs, you can not only organize your data more efficiently but also present it attractively. By inserting and managing charts, you have the opportunity to present your information clearly and visually appealing. Use these features to enhance your projects and give more weight to your data.
Summary
In this tutorial, you have learned how to insert and manage charts from Google Sheets into Google Docs. The process involves preparing the data in Google Sheets, inserting it into Google Docs, and linking the data for effective updates.
Frequently Asked Questions
How do I insert a chart from Google Sheets into Google Docs?In Google Docs, select "Insert", then "Chart", and "From Google Sheets" to add the chart.
What happens if I break the link of the chart?The chart will remain in its current state and will no longer update automatically when changes occur in Google Sheets.
Can I update a chart later?Yes, if the chart is linked, you can update it anytime to display the latest data from Google Sheets.
How can I change permissions for my Google Sheets document?Go to your Google Sheets document, click "Share", and change the permission settings to grant access to other users.
Can I also insert other types of charts?Yes, you can choose between different chart types such as bar, column, line charts, and pie charts.
