
Excel tutorial: Pivot, charts and table design for clear data presentation

- Over 3-hour Excel tutorial for the clear and informative preparation of data
- Pivot table in Excel: How to keep an overview at all times, even with large amounts of data
- Table design: Use functions such as conditional formatting for a better overview
- Excel presentation: Create, for example, a traffic light that switches at different values
- Excel charts: How to set up an informative speedometer chart, among other things
- Many more tips and tricks for working efficiently with Microsoft Excel
All your data can be so beautifully presented and therefore even more informative! Give your tables a design boost with this Excel tutorial - for a better overview and clarity.
44 Videos, 190 minutes
Intro
Excel tutorial: Pivot, charts and table design for clear data presentation - 1 intro
1 minWelcome to the Excel tutorial! Find out briefly and concisely what you can expect here.
Evaluations and data overview
Excel tutorial: Pivot, charts and table design for clear data presentation - 2.1 Times with the numeric keypad
3 minHow you can still enter times in the numeric keypad, despite the missing colon.
Excel tutorial: Pivot, charts and table design for clear data presentation - 2.2 Evaluating specific cells
9 minTotalize every second or any other line
Excel tutorial: Pivot, charts and table design for clear data presentation - 2.3 Copying formulas automatically
3 minCopying and using a formula
Excel tutorial: Pivot, charts and table design for clear data presentation - 2.4 Mixing text, data and formulas in a cell
4 minCombining different formatting in one cell
Excel tutorial: Pivot, charts and table design for clear data presentation - 2.5 Displaying formulas
2 minIdentify cells where there are no fixed values but formulas
Excel tutorial: Pivot, charts and table design for clear data presentation - 2.6 Worksheet in a new Excel file
3 minCopying and moving worksheets to another Excel file
Excel tutorial: Pivot, charts and table design for clear data presentation - 2.7 Day of the week in conditional formatting
3 minDivision of a schedule using weekdays with conditional formatting
Excel tutorial: Pivot, charts and table design for clear data presentation - 2.8 Managing conditional formatting
4 minGet an overview of the different conditional formatting of a worksheet
Excel tutorial: Pivot, charts and table design for clear data presentation - 2.9 Highlighting filled cells
4 minWe use conditional formatting to select all cells that contain values.
Excel tutorial: Pivot, charts and table design for clear data presentation - 2.10 Fractions in Excel
3 minCalculate and correctly display fractions in Excel
Excel tutorial: Pivot, charts and table design for clear data presentation - 2.11 Swapping columns and rows
3 minGet to know the "Transpose" insertion option.
Excel tutorial: Pivot, charts and table design for clear data presentation - 2.12 Database mask in Excel
5 minEntering data in tables using the mask
Excel tutorial: Pivot, charts and table design for clear data presentation - 2.13 Help for formulas
6 minHow to enter formulas using the help function
Presentation and print
Excel tutorial: Pivot, charts and table design for clear data presentation - 3.1 Coloring every second row
6 minHow to highlight every second row in Excel in color
Excel tutorial: Pivot, charts and table design for clear data presentation - 3.2 Create slanted headings
3 minHow to create a heading in an Excel spreadsheet and format it
Excel tutorial: Pivot, charts and table design for clear data presentation - 3.3 Sparklines in Excel
3 minUse sparklines for the graphical evaluation of data.
Excel tutorial: Pivot, charts and table design for clear data presentation - 3.4 Tachograph chart in Excel
14 minDisplay numbers in a special form with the tachodiagram
Excel tutorial: Pivot, charts and table design for clear data presentation - 3.5 Customizing Excel tables visually
6 minUse an Excel spreadsheet design to create the presentation.
Excel tutorial: Pivot, charts and table design for clear data presentation - 3.6 Create traffic light function
7 minLet's create a simple traffic light that we can light up differently using numbers.
Excel tutorial: Pivot, charts and table design for clear data presentation - 3.7 Print settings on all worksheets
2 minApply the print settings to other worksheets as well.
Excel tutorial: Pivot, charts and table design for clear data presentation - 3.8 Printing multiple worksheets on one page
3 minSave paper by putting several worksheets on one page.
Excel tutorial: Pivot, charts and table design for clear data presentation - 3.9 Manual page break when printing
2 minAdd page breaks manually.
Excel tutorial: Pivot, charts and table design for clear data presentation - 3.10 Excel table on a single page
1 minPut your tables on a single page.
Excel tutorial: Pivot, charts and table design for clear data presentation - 3.11 Hide error messages when printing
1 minErrors that are actually suggestions can be easily hidden in Excel.
Excel tutorial: Pivot, charts and table design for clear data presentation - 3.12 Format codes in headers and footers
6 minInsert header and footer elements such as file name, date or page number
Pivot 1x1
Excel tutorial: Pivot, charts and table design for clear data presentation - 4.1 Pivot: basics
12 minPivot tables can be created very quickly in Excel. In this step-by-step guide, you will learn how to do this.
Excel tutorial: Pivot, charts and table design for clear data presentation - 4.2 Pivot: calculations/field settings
6 minCalculating fields in pivot tables is one of the most powerful features. Here you will learn how we can summarize sales and compare them as a percentage.
Excel tutorial: Pivot, charts and table design for clear data presentation - 4.3 Pivot: Timelines and data slicing
6 minCalculate sales based on time data and only select sales at certain times.
Excel tutorial: Pivot, charts and table design for clear data presentation - 4.4 Pivot: Filtering
3 minFiltering specific data records in pivot tables
Excel tutorial: Pivot, charts and table design for clear data presentation - 4.5 Pivot: Charts
4 minGet to know the pivot charts. Create charts from the pivot template.
Excel tutorial: Pivot, charts and table design for clear data presentation - 4.6 Pivot: Layout
4 minAdjustments to the design and layout of a pivot table
Excel tutorial: Pivot, charts and table design for clear data presentation - 4.7 Pivot: Options
3 minOverview of the options of a pivot table
Tips & Tricks for faster working
Excel tutorial: Pivot, charts and table design for clear data presentation - 5.1 Secret selection
2 minSuggestions as soon as you enter the first letter
Excel tutorial: Pivot, charts and table design for clear data presentation - 5.2 New text lines within a cell
2 minCreate line breaks within a cell.
Excel tutorial: Pivot, charts and table design for clear data presentation - 5.3 Lines in cells
3 minCells can be formatted with different lines.
Excel tutorial: Pivot, charts and table design for clear data presentation - 5.4 Changing the capitalization of text in Excel
2 minUse a function to display all values of a cell in upper or lower case.
Excel tutorial: Pivot, charts and table design for clear data presentation - Convert 5.5 hours into minutes
2 minSimple trick to display hours in minutes.
Excel tutorial: Pivot, charts and table design for clear data presentation - 5.6 Automatically generate ranked lists
4 minDepending on your requirements, you can now number the placement according to the largest or smallest value without changing the original arrangement of the cells.
Excel tutorial: Pivot, charts and table design for clear data presentation - 5.7 Calculating with the status bar
2 minResults appear in the status bar
Excel tutorial: Pivot, charts and table design for clear data presentation - 5.8 Totaling by cell range criteria
7 minTotaling a cell range according to criteria
Excel tutorial: Pivot, charts and table design for clear data presentation - 5.9 Counting by cell range criteria
5 minZÄHLENWENNS applies criteria to cells in several areas and counts how often all criteria apply.
Excel tutorial: Pivot, charts and table design for clear data presentation - 5.10 Calculate mean value
4 minUse a function to calculate the number in the middle of a number line.
Excel tutorial: Pivot, charts and table design for clear data presentation - 5.11 Important Excel macros for everyday use
11 minMaster the most common tasks in Excel with clever macros
You might also like

10 sets of 50 vector icons in line and duotone, available in SVG, EPS, and PNG
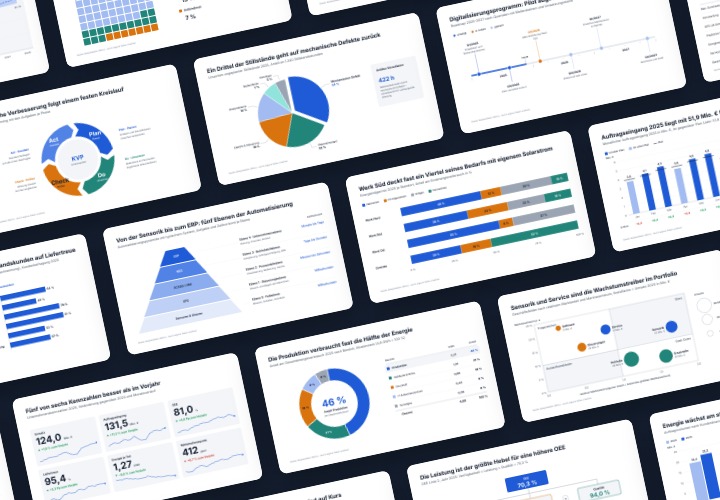
48 editable chart templates in SVG, PDF, EPS, PNG, and PowerPoint – in under a minute in the customer’s corporate identity
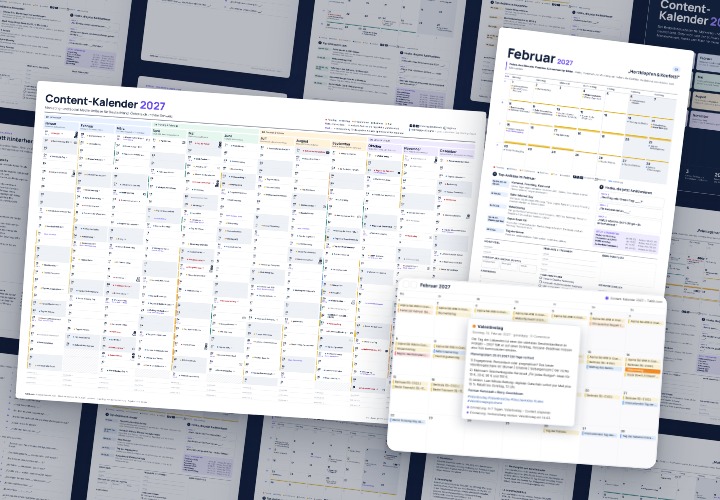
277 occasions with 3 post ideas each, wall planner A2/A1, monthly calendar A4, Excel database, calendar file, and bonus tools

From Context Hints to Conversion: Campaigns in ChatGPT
Comment now „Excel tutorial: Pivot, charts and table design for clear data presentation“